本页面介绍了如何自定义 GKE 推理网关部署。
本页面适用于负责管理 GKE 基础设施的网络专家,以及管理 AI 工作负载的平台管理员。
如需管理和优化推理工作负载,您可以配置 GKE 推理网关的高级功能。
了解并配置以下高级功能:
- 如需使用 Model Armor 集成,请配置 AI 安全检查。
- 如需通过 API 安全性、速率限制和分析等功能增强 GKE 推理网关,请配置 Apigee 以进行身份验证和 API 管理。
- 如需根据请求正文中的模型名称来路由请求,请配置基于正文的路由。
- 如需查看 GKE 推理网关和模型服务器的指标和信息中心,并启用 HTTP 访问日志记录,请配置可观测性。
- 如需自动扩缩 GKE 推理网关部署,请配置自动扩缩。
配置 AI 安全和安全检查
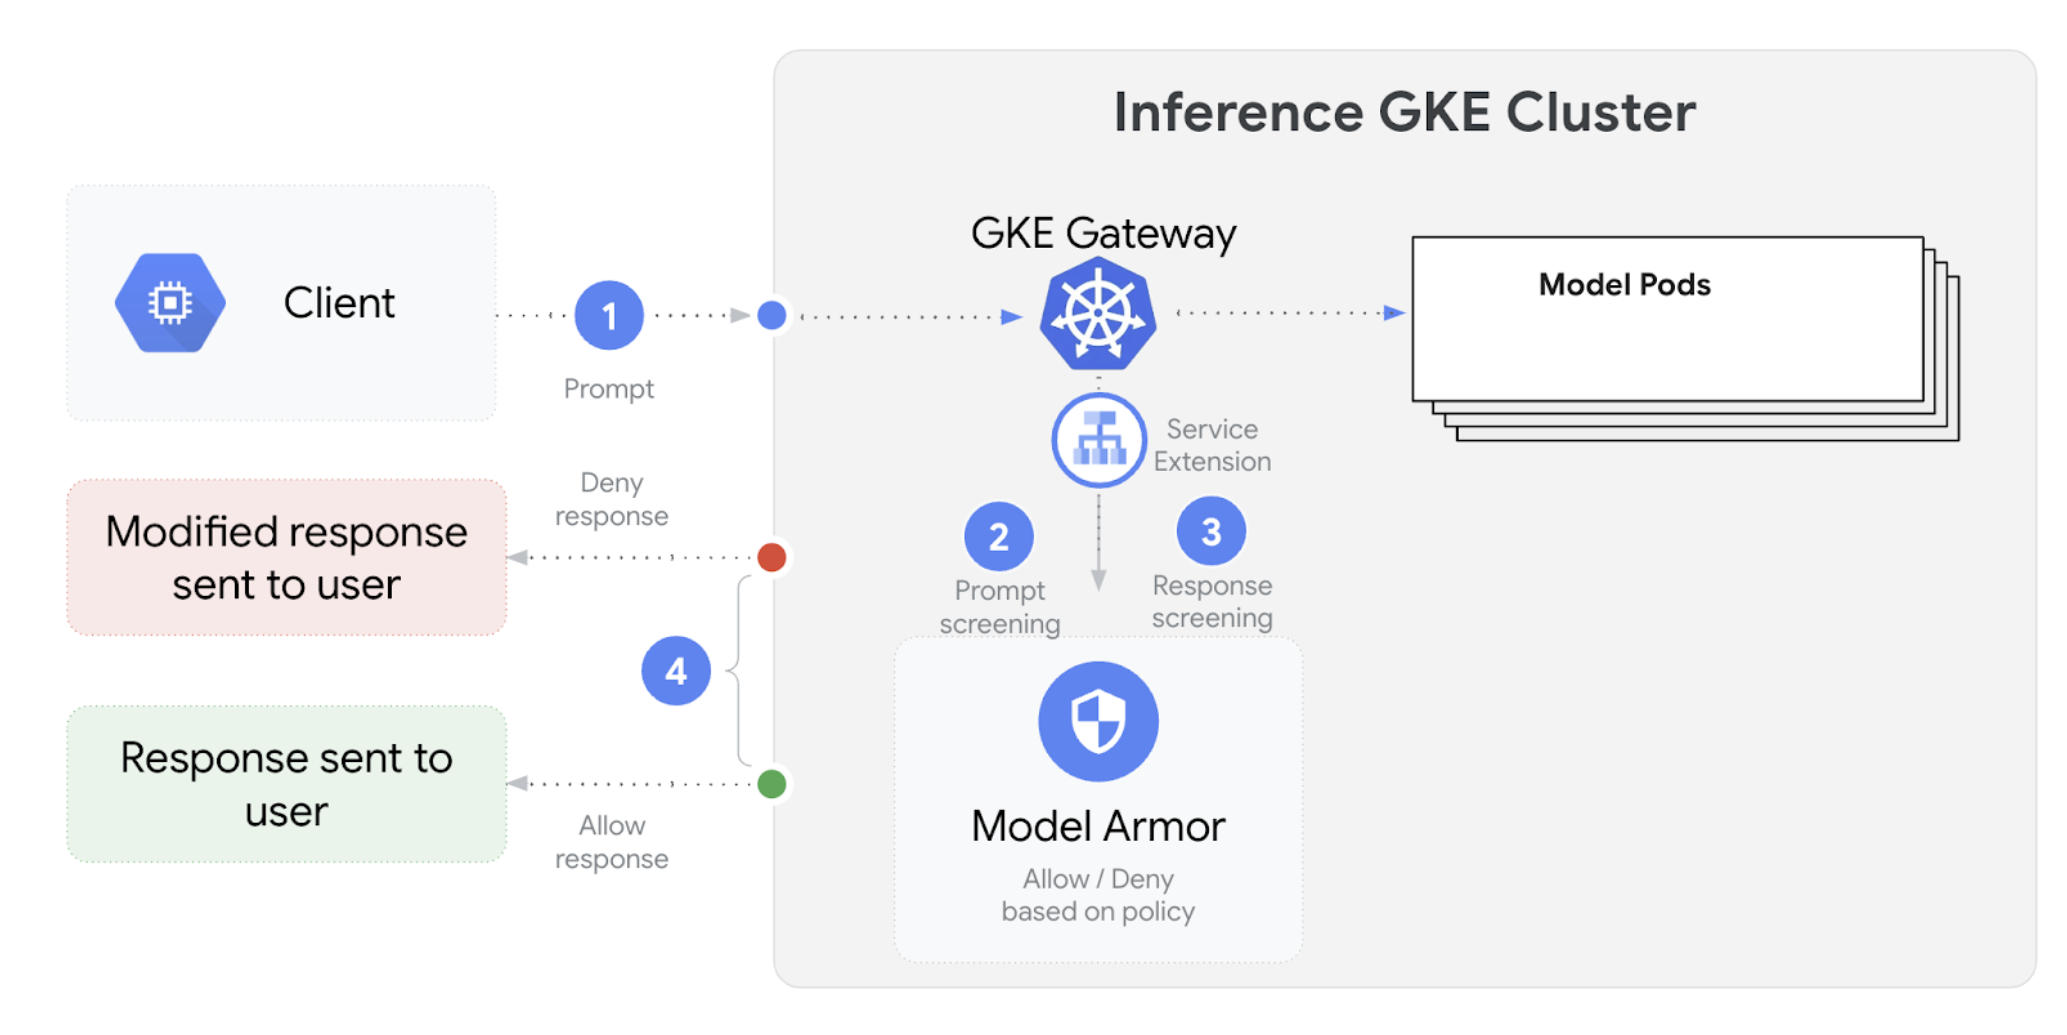
GKE 推理网关与 Model Armor 集成,以便为使用大语言模型 (LLM) 的应用对提示和响应执行安全检查。这种集成在基础设施级别额外提供了一层安全保障,对应用级安全措施起到补充作用。这可实现跨所有 LLM 流量的集中式政策应用。您还可以使用 NVIDIA NeMo Guardrails 进行安全检查。
下图展示了 Model Armor 与 GKE 集群上的 GKE 推理网关的集成:
如需配置 AI 安全检查,请执行以下步骤:
前提条件
- 在 Google Cloud 项目中启用 Model Armor 服务。
使用 Model Armor 控制台、Google Cloud CLI 或 API 创建 Model Armor 模板。以下命令会创建一个名为
llm的模板,该模板会记录操作并过滤有害内容。# Set environment variables PROJECT_ID=$(gcloud config get-value project) # Replace <var>CLUSTER_LOCATION<var> with the location of your GKE cluster. For example, `us-central1`. LOCATION="CLUSTER_LOCATION" MODEL_ARMOR_TEMPLATE_NAME=llm # Set the regional API endpoint gcloud config set api_endpoint_overrides/modelarmor \ "https://modelarmor.$LOCATION.rep.googleapis.com/" # Create the template gcloud model-armor templates create $MODEL_ARMOR_TEMPLATE_NAME \ --location $LOCATION \ --pi-and-jailbreak-filter-settings-enforcement=enabled \ --pi-and-jailbreak-filter-settings-confidence-level=MEDIUM_AND_ABOVE \ --rai-settings-filters='[{ "filterType": "HATE_SPEECH", "confidenceLevel": "MEDIUM_AND_ABOVE" },{ "filterType": "DANGEROUS", "confidenceLevel": "MEDIUM_AND_ABOVE" },{ "filterType": "HARASSMENT", "confidenceLevel": "MEDIUM_AND_ABOVE" },{ "filterType": "SEXUALLY_EXPLICIT", "confidenceLevel": "MEDIUM_AND_ABOVE" }]' \ --template-metadata-log-sanitize-operations \ --template-metadata-log-operations
授予 IAM 权限
服务扩展服务账号需要具备访问必要资源的权限。运行以下命令以授予所需角色:
PROJECT_NUMBER=$(gcloud projects describe $PROJECT_ID --format 'get(projectNumber)')

gcloud projects add-iam-policy-binding $PROJECT_ID \
    --member=serviceAccount:service-$PROJECT_NUMBER@gcp-sa-dep.iam.gserviceaccount.com \
    --role=roles/container.admin

gcloud projects add-iam-policy-binding $PROJECT_ID \
    --member=serviceAccount:service-$PROJECT_NUMBER@gcp-sa-dep.iam.gserviceaccount.com \
    --role=roles/modelarmor.calloutUser

gcloud projects add-iam-policy-binding $PROJECT_ID \
    --member=serviceAccount:service-$PROJECT_NUMBER@gcp-sa-dep.iam.gserviceaccount.com \
    --role=roles/serviceusage.serviceUsageConsumer

gcloud projects add-iam-policy-binding $PROJECT_ID \
    --member=serviceAccount:service-$PROJECT_NUMBER@gcp-sa-dep.iam.gserviceaccount.com \
    --role=roles/modelarmor.user
配置
GCPTrafficExtension如需将 Model Armor 政策应用于网关,请创建具有正确元数据格式的
GCPTrafficExtension资源。将以下示例清单保存为
gcp-traffic-extension.yaml:kind: GCPTrafficExtension apiVersion: networking.gke.io/v1 metadata: name: my-model-armor-extension spec: targetRefs: - group: "gateway.networking.k8s.io" kind: Gateway name: GATEWAY_NAME extensionChains: - name: my-model-armor-chain1 matchCondition: celExpressions: - celMatcher: request.path.startsWith("/") extensions: - name: my-model-armor-service supportedEvents: - RequestHeaders - RequestBody - RequestTrailers - ResponseHeaders - ResponseBody - ResponseTrailers timeout: 1s failOpen: false googleAPIServiceName: "modelarmor.${LOCATION}.rep.googleapis.com" metadata: model_armor_settings: '[{"model": "${MODEL}","model_response_template_id": "projects/${PROJECT_ID}/locations/${LOCATION}/templates/${MODEL_ARMOR_TEMPLATE_NAME}","user_prompt_template_id": "projects/${PROJECT_ID}/locations/${LOCATION}/templates/${MODEL_ARMOR_TEMPLATE_NAME}"}]'替换以下内容:
GATEWAY_NAME:网关的名称。MODEL_ARMOR_TEMPLATE_NAME:您的 Model Armor 模板的名称。
gcp-traffic-extension.yaml文件包含以下设置:targetRefs:指定此扩展程序适用的网关。extensionChains:定义要应用于流量的扩展程序链。matchCondition:定义应用扩展程序的条件。extensions:定义要应用的扩展程序。supportedEvents:指定调用扩展程序的事件。timeout:指定扩展程序的超时时间。googleAPIServiceName:指定扩展程序的服务名称。metadata:指定扩展程序的元数据,包括extensionPolicy和提示或响应清理设置。
将示例清单应用于集群:
export GATEWAY_NAME="your-gateway-name"
export MODEL="google/gemma-3-1b-it" # Or your specific model
envsubst < gcp-traffic-extension.yaml | kubectl apply -f -
配置 AI 安全检查并将其与网关集成后,Model Armor 会根据定义的规则自动过滤提示和回答。
配置 Apigee 以进行身份验证和 API 管理
GKE 推理网关与 Apigee 集成,可为推理工作负载提供身份验证、授权和 API 管理功能。如需详细了解使用 Apigee 的优势,请参阅使用 Apigee 的主要优势。
您可以将 GKE 推理网关与 Apigee 集成,以增强 GKE 推理网关的功能,例如 API 安全性、速率限制、配额、分析和创收。
前提条件
在开始之前,请确保您具备以下条件:
- 运行 1.34.* 版或更高版本的 GKE 集群。
- 已部署 GKE 推理网关的 GKE 集群。
- 在 GKE 集群所在的区域中创建的 Apigee 实例。
- Apigee APIM Operator 及其 CRD 已安装在您的 GKE 集群中。如需查看相关说明,请参阅安装 Apigee APIM Operator。
- 配置为连接到您的 GKE 集群的
kubectl。 Google Cloud CLI已安装并经过身份验证。
创建 ApigeeBackendService
首先,创建 ApigeeBackendService 资源。GKE 推理网关使用此对象创建 Apigee Extension Processor。
将以下清单保存为
my-apigee-backend-service.yaml:apiVersion: apim.googleapis.com/v1 kind: ApigeeBackendService metadata: name: my-apigee-backend-service spec: apigeeEnv: "APIGEE_ENVIRONMENT_NAME" # optional field defaultSecurityEnabled: true # optional field locations: name: "LOCATION" network: "CLUSTER_NETWORK" subnetwork: "CLUSTER_SUBNETWORK"替换以下内容:
APIGEE_ENVIRONMENT_NAME:您的 Apigee 环境的名称。 注意:如果使用generateEnv=TRUE标志安装了apigee-apim-operator,则无需设置此字段。如果还没有,请按照创建环境中的说明创建 Apigee 环境。LOCATION:Apigee 实例的位置。CLUSTER_NETWORK:GKE 集群的网络。CLUSTER_SUBNETWORK:GKE 集群的子网。
将清单应用到您的集群:
kubectl apply -f my-apigee-backend-service.yaml验证状态是否已变为
CREATED:kubectl wait --for=jsonpath='{.status.currentState}'="CREATED" -f my-apigee-backend-service.yaml --timeout=5m
配置 GKE 推理网关
配置 GKE 推理网关,以将 Apigee Extension Processor 作为负载均衡器流量扩展程序启用。
将以下清单保存为
my-apigee-traffic-extension.yaml:kind: GCPTrafficExtension apiVersion: networking.gke.io/v1 metadata: name: my-apigee-traffic-extension spec: targetRefs: - group: "gateway.networking.k8s.io" kind: Gateway name: GATEWAY_NAME extensionChains: - name: my-traffic-extension-chain matchCondition: celExpressions: - celMatcher: request.path.startsWith("/") extensions: - name: my-apigee-extension metadata: # The value for `apigee-extension-processor` must match the name of the `ApigeeBackendService` resource that was applied earlier. apigee-extension-processor: my-apigee-backend-service failOpen: false timeout: 1s supportedEvents: - RequestHeaders - ResponseHeaders - ResponseBody backendRef: group: apim.googleapis.com kind: ApigeeBackendService name: my-apigee-backend-service port: 443将
GATEWAY_NAME替换为您的网关名称。将清单应用到您的集群:
kubectl apply -f my-apigee-traffic-extension.yaml等待
GCPTrafficExtension状态变为Programmed:kubectl wait --for=jsonpath='{.status.ancestors[0].conditions[?(@.type=="Programmed")].status}'=True -f my-apigee-traffic-extension.yaml --timeout=5m
使用 API 密钥发送已通过身份验证的请求
如需查找 GKE 推理网关的 IP 地址,请检查网关状态:
GW_IP=$(kubectl get gateway/GATEWAY_NAME -o jsonpath='{.status.addresses[0].value}')将
GATEWAY_NAME替换为您的网关名称。测试不带身份验证的请求。此请求应被拒绝:
curl -i ${GW_IP}/v1/completions -H 'Content-Type: application/json' -d '{
"model": "food-review",
"prompt": "Write as if you were a critic: San Francisco",
"max_tokens": 100,
"temperature": 0
}'
您会看到类似于以下内容的响应,表明 Apigee 扩展程序正在运行:
{"fault":{"faultstring":"Raising fault. Fault name : RF-insufficient-request-raise-fault","detail":{"errorcode":"steps.raisefault.RaiseFault"}}}访问 Apigee 界面并创建 API 密钥。如需查看相关说明,请参阅创建 API 密钥。
在 HTTP 请求标头中发送 API 密钥:
curl -i ${GW_IP}/v1/completions -H 'Content-Type: application/json' -H 'x-api-key: API_KEY' -d '{
"model": "food-review",
"prompt": "Write as if you were a critic: San Francisco",
"max_tokens": 100,
"temperature": 0
}'
将
API_KEY替换为您的 API 密钥。
如需详细了解如何配置 Apigee 政策,请参阅将 API 管理政策与 Apigee APIM Operator for Kubernetes 搭配使用。
配置可观测性
GKE 推理网关可用于深入了解推理工作负载的健康状况、性能和行为。这有助于您发现和解决问题、优化资源利用率,并确保应用的可靠性。
Google Cloud 提供以下 Cloud Monitoring 信息中心,可为 GKE 推理网关提供推理可观测性:
- GKE 推理网关信息中心:提供 LLM 服务的黄金指标,例如
InferencePool的请求和 token 吞吐量、延迟时间、错误和缓存利用率。如需查看可用的 GKE 推理网关指标的完整列表,请参阅公开的指标。 - AI/ML 可观测性信息中心:提供用于显示基础设施使用情况、DCGM 指标和 vLLM 模型性能指标的信息中心。
- 模型服务器信息中心:提供模型服务器黄金信号的信息中心。这样一来,您就可以监控模型服务器(例如
KVCache Utilization和Queue length)的负载和性能。 - 负载均衡器信息中心:报告来自负载均衡器的指标,例如每秒请求数、端到端请求服务延迟时间和请求-响应状态代码。这些指标有助于您了解端到端请求服务的性能并识别错误。
- 数据中心 GPU 管理器 (DCGM) 指标:提供 DCGM 指标,例如 NVIDIA GPU 的性能和利用率。您可以在 Cloud Monitoring 中配置 DCGM 指标。如需了解详情,请参阅收集和查看 DCGM 指标。
查看 GKE 推理网关信息中心
如需查看 GKE 推理网关信息中心,请执行以下步骤:
在 Google Cloud 控制台中,前往 Monitoring 页面。
在导航窗格中,选择信息中心。
在集成部分中,选择 GMP。
在 Cloud Monitoring 信息中心模板页面中,搜索“网关”。
查看 GKE 推理网关信息中心。
或者,您也可以按照监控信息中心中的说明操作。
查看 AI/机器学习模型可观测性信息中心
如需查看已部署的模型以及模型可观测性指标的信息中心,请按以下步骤操作:
在 Google Cloud 控制台中,前往已部署的模型页面。
如需查看特定部署的详细信息(包括其指标、日志和信息中心),请点击列表中相应模型的名称。
在模型详情页面中,点击可观测性标签页以查看以下信息中心。如果系统提示,请点击启用以启用信息中心。
- 基础设施使用情况信息中心会显示利用率指标。
- DCGM 信息中心会显示 DCGM 指标。
- 如果您使用的是 vLLM,则可以使用模型性能信息中心,该信息中心会显示 vLLM 模型性能的指标。
配置模型服务器可观测性信息中心
如需从每个模型服务器收集黄金信号并了解有助于提升 GKE 推理网关性能的各种因素,您可以为模型服务器配置自动监控。这包括如下模型服务器:
如需查看集成信息中心,请先确保您正在从模型服务器收集指标。然后,执行以下步骤:
在 Google Cloud 控制台中,前往 Monitoring 页面。
在导航窗格中,选择信息中心。
在集成下方,选择 GMP。系统会显示相应的集成信息中心。
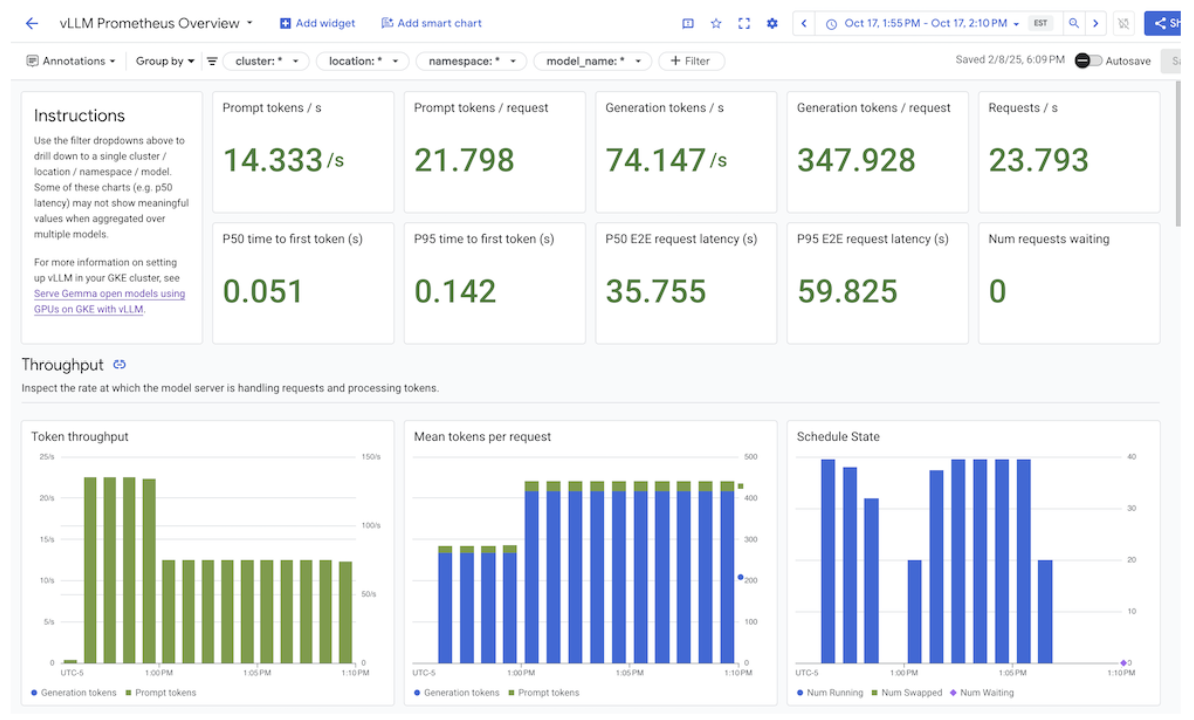
图:集成信息中心
如需了解详情,请参阅自定义应用监控。
配置 Cloud Monitoring 提醒
如需为 GKE 推理网关配置 Cloud Monitoring 提醒,请执行以下步骤:
将以下示例清单保存为
alerts.yaml,并根据需要修改阈值:groups: - name: gateway-api-inference-extension rules: - alert: HighInferenceRequestLatencyP99 annotations: title: 'High latency (P99) for model {{ $labels.model_name }}' description: 'The 99th percentile request duration for model {{ $labels.model_name }} and target model {{ $labels.target_model_name }} has been consistently above 10.0 seconds for 5 minutes.' expr: histogram_quantile(0.99, rate(inference_model_request_duration_seconds_bucket[5m])) > 10.0 for: 5m labels: severity: 'warning' - alert: HighInferenceErrorRate annotations: title: 'High error rate for model {{ $labels.model_name }}' description: 'The error rate for model {{ $labels.model_name }} and target model {{ $labels.target_model_name }} has been consistently above 5% for 5 minutes.' expr: sum by (model_name) (rate(inference_model_request_error_total[5m])) / sum by (model_name) (rate(inference_model_request_total[5m])) > 0.05 for: 5m labels: severity: 'critical' impact: 'availability' - alert: HighInferencePoolAvgQueueSize annotations: title: 'High average queue size for inference pool {{ $labels.name }}' description: 'The average number of requests pending in the queue for inference pool {{ $labels.name }} has been consistently above 50 for 5 minutes.' expr: inference_pool_average_queue_size > 50 for: 5m labels: severity: 'critical' impact: 'performance' - alert: HighInferencePoolAvgKVCacheUtilization annotations: title: 'High KV cache utilization for inference pool {{ $labels.name }}' description: 'The average KV cache utilization for inference pool {{ $labels.name }} has been consistently above 90% for 5 minutes, indicating potential resource exhaustion.' expr: inference_pool_average_kv_cache_utilization > 0.9 for: 5m labels: severity: 'critical' impact: 'resource_exhaustion'如需创建提醒政策,请运行以下命令:
gcloud alpha monitoring policies migrate --policies-from-prometheus-alert-rules-yaml=alerts.yaml您会在“提醒”页面中看到新的提醒政策。
修改提醒
您可以在 kubernetes-sigs/gateway-api-inference-extension GitHub 仓库中找到最新可用指标的完整列表,并且可以使用其他指标向清单中附加新提醒。
如需修改示例提醒,请参考以下示例:
  - alert: HighInferenceRequestLatencyP99
    annotations:
      title: 'High latency (P99) for model {{ $labels.model_name }}'
      description: 'The 99th percentile request duration for model {{ $labels.model_name }} and target model {{ $labels.target_model_name }} has been consistently above 10.0 seconds for 5 minutes.'
    expr: histogram_quantile(0.99, rate(inference_model_request_duration_seconds_bucket[5m])) > 10.0
    for: 5m
    labels:
      severity: 'warning'
如果 5 分钟内请求时长的第 99 百分位超过 10 秒,则会触发此提醒。您可以修改提醒的 expr 部分,以根据自己的需求调整阈值。
为 GKE 推理网关配置日志记录
为 GKE 推理网关配置日志记录可提供有关请求和响应的详细信息,这有助于进行问题排查、审核和性能分析。HTTP 访问日志会记录每个请求和响应,包括标头、状态代码和时间戳。此级别的详细信息可帮助您发现问题、发现错误以及了解推理工作负载的行为。
如需为 GKE 推理网关配置日志记录,请为每个 InferencePool 对象启用 HTTP 访问日志记录。
将以下示例清单保存为
logging-backend-policy.yaml:apiVersion: networking.gke.io/v1 kind: GCPBackendPolicy metadata: name: logging-backend-policy namespace: NAMESPACE_NAME spec: default: logging: enabled: true sampleRate: 500000 targetRef: group: inference.networking.x-k8s.io kind: InferencePool name: INFERENCE_POOL_NAME替换以下内容:
NAMESPACE_NAME:部署InferencePool的命名空间的名称。INFERENCE_POOL_NAME:InferencePool的名称。
将示例清单应用于集群:
kubectl apply -f logging-backend-policy.yaml
应用此清单后,GKE 推理网关会为指定的 InferencePool 启用 HTTP 访问日志。您可以在 Cloud Logging 中查看这些日志。日志包含有关每项请求和响应的详细信息,例如请求网址、标头、响应状态代码和延迟时间。
创建基于日志的指标以查看错误详情
您可以使用基于日志的指标来分析负载均衡日志并提取错误详情。每个 GKE 网关类(例如 gke-l7-global-external-managed 和 gke-l7-regional-internal-managed 网关类)都由不同的负载平衡器提供支持。如需了解详情,请参阅 GatewayClass 功能。
每个负载平衡器都有不同的受监控资源,您在创建基于日志的指标时必须使用该资源。如需详细了解每种负载平衡器的受监控资源,请参阅以下内容:
- 对于区域级外部负载平衡器:外部 HTTP(S) 负载平衡器的基于日志的指标
- 对于内部负载平衡器:内部 HTTP(S) 负载平衡器的基于日志的指标
如需创建基于日志的指标以查看错误详情,请执行以下操作:
创建一个名为
error_detail_metric.json且包含以下LogMetric定义的 JSON 文件。此配置会创建一个指标,用于从负载平衡器日志中提取proxyStatus字段。{ "description": "Metric to extract error details from load balancer logs.", "filter": "resource.type=\"MONITORED_RESOURCE\"", "metricDescriptor": { "metricKind": "DELTA", "valueType": "INT64", "labels": [ { "key": "error_detail", "valueType": "STRING", "description": "The detailed error string from the load balancer." } ] }, "labelExtractors": { "error_detail": "EXTRACT(jsonPayload.proxyStatus)" } }将
MONITORED_RESOURCE替换为负载平衡器的受监控资源。打开 Cloud Shell 或安装了 gcloud CLI 的本地终端。
如需创建指标,请运行
gcloud logging metrics create命令并使用--config-from-file标志:gcloud logging metrics create error_detail_metric \ --config-from-file=error_detail_metric.json
创建指标后,您可以在 Cloud Monitoring 中使用该指标来查看负载平衡器报告的错误分布情况。如需了解详情,请参阅创建基于日志的指标。
如需详细了解如何根据基于日志的指标创建提醒,请参阅创建关于计数器指标的提醒政策。
配置自动扩缩
自动扩缩功能会根据负载变化调整资源分配,根据需求动态添加或移除 Pod,以保持性能和资源效率。对于 GKE 推理网关,这涉及到横向自动扩缩每个 InferencePool 中的 Pod。GKE Pod 横向自动扩缩器 (HPA) 根据模型服务器指标(例如 KVCache Utilization)自动扩缩 Pod。这可确保推理服务在高效管理资源使用情况的同时,处理不同的工作负载和查询量。
如需配置 InferencePool 实例,使其根据 GKE 推理网关生成的指标自动扩缩,请执行以下步骤:
在集群中部署
PodMonitoring对象,以收集 GKE 推理网关生成的指标。如需了解详情,请参阅配置可观测性。部署自定义指标 Stackdriver 适配器,向 HPA 授予对指标的访问权限:
将以下示例清单保存为
adapter_new_resource_model.yaml:apiVersion: v1 kind: Namespace metadata: name: custom-metrics --- apiVersion: v1 kind: ServiceAccount metadata: name: custom-metrics-stackdriver-adapter namespace: custom-metrics --- apiVersion: rbac.authorization.k8s.io/v1 kind: ClusterRoleBinding metadata: name: custom-metrics:system:auth-delegator roleRef: apiGroup: rbac.authorization.k8s.io kind: ClusterRole name: system:auth-delegator subjects: - kind: ServiceAccount name: custom-metrics-stackdriver-adapter namespace: custom-metrics --- apiVersion: rbac.authorization.k8s.io/v1 kind: RoleBinding metadata: name: custom-metrics-auth-reader namespace: kube-system roleRef: apiGroup: rbac.authorization.k8s.io kind: Role name: extension-apiserver-authentication-reader subjects: - kind: ServiceAccount name: custom-metrics-stackdriver-adapter namespace: custom-metrics --- apiVersion: rbac.authorization.k8s.io/v1 kind: ClusterRole metadata: name: custom-metrics-resource-reader rules: - apiGroups: - "" resources: - pods - nodes - nodes/stats verbs: - get - list - watch --- apiVersion: rbac.authorization.k8s.io/v1 kind: ClusterRoleBinding metadata: name: custom-metrics-resource-reader roleRef: apiGroup: rbac.authorization.k8s.io kind: ClusterRole name: custom-metrics-resource-reader subjects: - kind: ServiceAccount name: custom-metrics-stackdriver-adapter namespace: custom-metrics --- apiVersion: apps/v1 kind: Deployment metadata: name: custom-metrics-stackdriver-adapter labels: run: custom-metrics-stackdriver-adapter k8s-app: custom-metrics-stackdriver-adapter spec: replicas: 1 selector: matchLabels: run: custom-metrics-stackdriver-adapter k8s-app: custom-metrics-stackdriver-adapter template: metadata: labels: run: custom-metrics-stackdriver-adapter k8s-app: custom-metrics-stackdriver-adapter kubernetes.io/cluster-service: "true" spec: serviceAccountName: custom-metrics-stackdriver-adapter containers: - image: gcr.io/gke-release/custom-metrics-stackdriver-adapter:v0.15.2-gke.1 imagePullPolicy: Always name: pod-custom-metrics-stackdriver-adapter command: - /adapter - --use-new-resource-model=true - --fallback-for-container-metrics=true resources: limits: cpu: 250m memory: 200Mi requests: cpu: 250m memory: 200Mi --- apiVersion: v1 kind: Service metadata: labels: run: custom-metrics-stackdriver-adapter k8s-app: custom-metrics-stackdriver-adapter kubernetes.io/cluster-service: 'true' kubernetes.io/name: Adapter name: custom-metrics-stackdriver-adapter namespace: custom-metrics spec: ports: - port: 443 protocol: TCP targetPort: 443 selector: run: custom-metrics-stackdriver-adapter k8s-app: custom-metrics-stackdriver-adapter type: ClusterIP --- apiVersion: apiregistration.k8s.io/v1 kind: APIService metadata: name: v1beta1.custom.metrics.k8s.io spec: insecureSkipTLSVerify: true group: custom.metrics.k8s.io groupPriorityMinimum: 100 versionPriority: 100 service: name: custom-metrics-stackdriver-adapter namespace: custom-metrics version: v1beta1 --- apiVersion: apiregistration.k8s.io/v1 kind: APIService metadata: name: v1beta2.custom.metrics.k8s.io spec: insecureSkipTLSVerify: true group: custom.metrics.k8s.io groupPriorityMinimum: 100 versionPriority: 200 service: name: custom-metrics-stackdriver-adapter namespace: custom-metrics version: v1beta2 --- apiVersion: apiregistration.k8s.io/v1 kind: APIService metadata: name: v1beta1.external.metrics.k8s.io spec: insecureSkipTLSVerify: true group: external.metrics.k8s.io groupPriorityMinimum: 100 versionPriority: 100 service: name: custom-metrics-stackdriver-adapter namespace: custom-metrics version: v1beta1 --- apiVersion: rbac.authorization.k8s.io/v1 kind: ClusterRole metadata: name: external-metrics-reader rules: - apiGroups: - "external.metrics.k8s.io" resources: - "*" verbs: - list - get - watch --- apiVersion: rbac.authorization.k8s.io/v1 kind: ClusterRoleBinding metadata: name: external-metrics-reader roleRef: apiGroup: rbac.authorization.k8s.io kind: ClusterRole name: external-metrics-reader subjects: - kind: ServiceAccount name: horizontal-pod-autoscaler namespace: kube-system将示例清单应用于集群:
kubectl apply -f adapter_new_resource_model.yaml
如需向适配器授予从项目读取指标的权限,请运行以下命令:
$ PROJECT_ID=PROJECT_ID
$ PROJECT_NUMBER=$(gcloud projects describe PROJECT_ID --format="value(projectNumber)")
$ gcloud projects add-iam-policy-binding projects/PROJECT_ID \
  --role roles/monitoring.viewer \
  --member=principal://iam.googleapis.com/projects/PROJECT_NUMBER/locations/global/workloadIdentityPools/$PROJECT_ID.svc.id.goog/subject/ns/custom-metrics/sa/custom-metrics-stackdriver-adapter
请将
PROJECT_ID替换为您的 Google Cloud 项目 ID。对于每个
InferencePool,部署一个如下所示的 HPA:apiVersion: autoscaling/v2 kind: HorizontalPodAutoscaler metadata: name: INFERENCE_POOL_NAME namespace: INFERENCE_POOL_NAMESPACE spec: scaleTargetRef: apiVersion: apps/v1 kind: Deployment name: INFERENCE_POOL_NAME minReplicas: MIN_REPLICAS maxReplicas: MAX_REPLICAS metrics: - type: External external: metric: name: prometheus.googleapis.com|inference_pool_average_kv_cache_utilization|gauge selector: matchLabels: metric.labels.name: INFERENCE_POOL_NAME resource.labels.cluster: CLUSTER_NAME resource.labels.namespace: INFERENCE_POOL_NAMESPACE target: type: AverageValue averageValue: TARGET_VALUE替换以下内容:
INFERENCE_POOL_NAME:InferencePool的名称。INFERENCE_POOL_NAMESPACE:InferencePool的命名空间。CLUSTER_NAME:集群的名称。MIN_REPLICAS:InferencePool的最小可用性(基准容量)。当使用率低于 HPA 目标阈值时,HPA 会保持此副本数。高可用性工作负载必须将其设置为高于1的值,以确保在 Pod 中断期间继续保持可用性。MAX_REPLICAS:用于限制必须分配给InferencePool中托管的工作负载的加速器数量的值。HPA 不会将副本数量增加到超出此值。在高峰流量期间,请监控副本的数量,确保MAX_REPLICAS字段的值提供了足够的提升空间,以便工作负载可以纵向扩容以保持所选的工作负载性能特征。TARGET_VALUE:表示每个模型服务器所选目标KV-Cache Utilization的值。这是一个 0-100 之间的数字,与模型服务器、模型、加速器和传入流量的特征密切相关。您可以通过负载测试并绘制吞吐量与延迟时间对比图,通过实验确定此目标值。从图表中选择所选的吞吐量和延迟时间组合,并使用相应的KV-Cache Utilization值作为 HPA 目标。您必须调整并密切监控此值,才能实现所选的性价比结果。您可以使用 GKE 推理快速入门自动确定此值。