Google Distributed Cloud(GDC)エアギャップ アプライアンス プロジェクトでアラート ルールを作成すると、プロジェクトのシステム モニタリング インスタンスまたは GDC Observability HTTP API からアラートをクエリしたりできます。
ダッシュボードでアラートをクエリして表示する
アラートは、platform-obs プロジェクトの
platform-obs プロジェクトのシステム モニタリング インスタンス。
システム モニタリング インスタンスには、ネットワーク モニタリングやサーバー モニタリングなどのモニタリング プロセスを実行するためのプロジェクト レベルの指標、ログ、アラートが含まれています。
始める前に
ダッシュボードでアラートをクエリして表示する前に、システム モニタリング インスタンスへのアクセス権を取得する必要があります。詳細については、ダッシュボードへのアクセス権を取得するをご覧ください。
アラートにログインして可視化するには、プロジェクト IAM 管理者にプロジェクト Grafana 閲覧者(project-grafana-viewer)ロールの付与を依頼してください。このロールベースのアクセス制御プロセスにより、データ可視化に安全にアクセスできます。
システム モニタリング インスタンス エンドポイント
アプリケーション オペレーター(AO)の場合:
次の URL を開いて、プロジェクトのエンドポイントにアクセスします。
https://GDC_URL/PROJECT_NAMESPACE/grafana
次のように置き換えます。
- GDC_URL: GDC 内の組織の URL。
- PROJECT_NAMESPACE: プロジェクトの Namespace。
プロジェクトの UI には、アラートに関する情報を含む アラート - 概要ダッシュボードなどのデフォルトのダッシュボードが含まれています。UI からアラートをクエリすると、プロジェクトからアラート情報を視覚的に取得し、リソースの統合ビューを取得して、問題を認識し、迅速に解決できます。
プラットフォーム管理者(PA)の場合:
次の URL を開いて、platform-obs プロジェクトのエンドポイントにアクセスします。
https://GDC_URL/platform-obs/grafana
GDC_URL は、GDC の組織の URL に置き換えます。
システム モニタリング インスタンスのユーザー インターフェース(UI)には、データ オブザーバビリティのアラートに関する情報を含む Alerts - Overview ダッシュボードなどのデフォルトのダッシュボードが含まれています。UI からアラートをクエリすると、プロジェクトからアラート情報を視覚的に取得し、リソースの統合ビューを取得して、問題を認識し、迅速に解決できます。
![[アラート - 概要] ダッシュボードには、特定のデータソースのアラート数と、アラート履歴の折れ線グラフが表示されます。このグラフには、データソースで 1 時間あたりに開いているアラートの数が表示されます。](https://cloud.google.com/static/distributed-cloud/hosted/docs/latest/appliance/admin/images/alerts-overview-dashboard.png?hl=ja)
図 1: Grafana UI の [Alerts - Overview] ダッシュボード。
Alertmanager
Alertmanager では、クライアント アプリケーションからのアラート通知をモニタリングできます。Alertmanager を使用してアラートを調べ、ミュートできます。また、アラートをフィルタリングまたはグループ化することもできます。
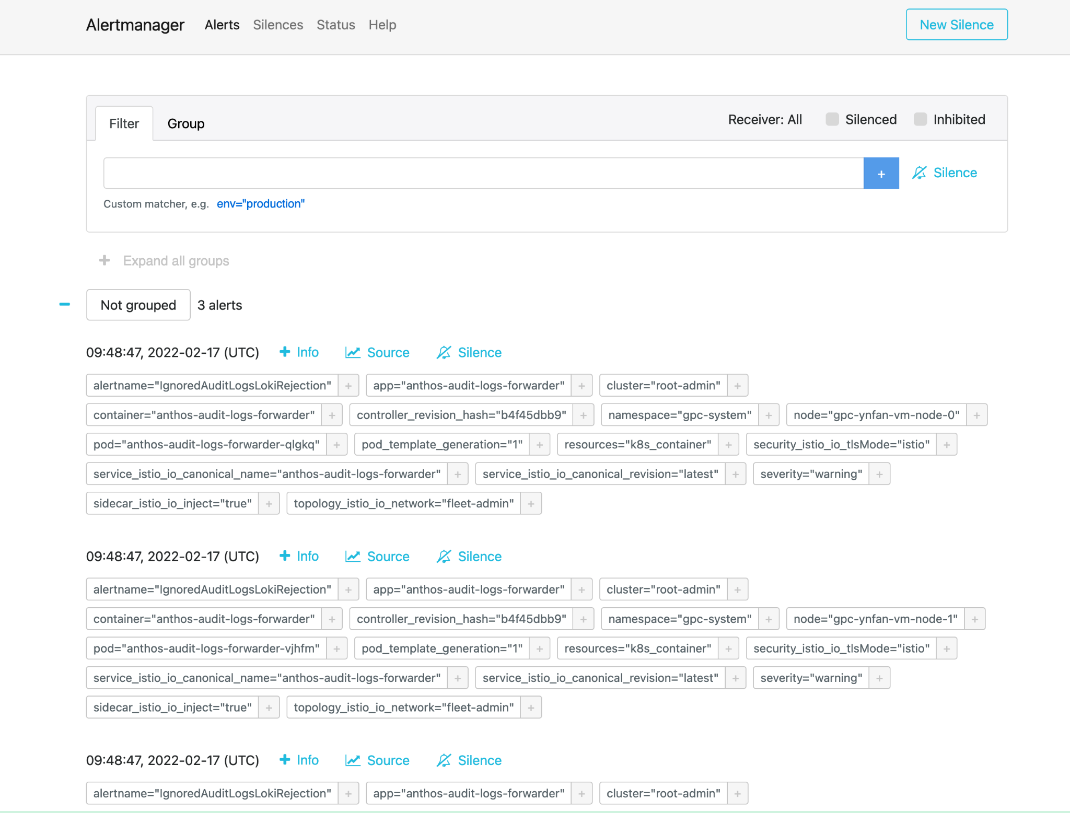
図 2. Alertmanager から監査ログをクエリするメニュー オプション。
事前定義されたアラート ポリシー
次の表に、Prometheus にプリインストールされているアラートルールを示します。
| 名前 | 説明 |
|---|---|
| KubeAPIDown(重大) | KubeAPI は Prometheus ターゲットの検出から 15 分間、表示されなくなりました。 |
| KubeClientErrors(警告) | Kubernetes API サーバー クライアント エラー率が 0.01 を 15 分間超えました。 |
| KubeClientErrors(重大) | Kubernetes API サーバー クライアント エラー率が 0.1 を 15 分間超えました。 |
| KubePodCrashLooping(警告) | Pod がクラッシュ ループ状態のまま 15 分以上経過しています。 |
| KubePodNotReady(警告) | Pod が 15 分以上準備されていない状態です。 |
| KubePersistentVolumeFillingUp(重大) | 要求された PersistentVolume のフリーバイトが 0.03 未満です。 |
| KubePersistentVolumeFillingUp(警告) | 要求された PersistentVolume のフリーバイトが 0.15 未満です。 |
| KubePersistentVolumeErrors(重大) | 永続ボリュームが 5 分間、失敗または保留フェーズにあります。 |
| KubeNodeNotReady(警告) | ノードが 15 分以上準備できていません。 |
| KubeNodeCPUUsageHigh(重大) | ノードの CPU 使用率が 80% を超えています。 |
| KubeNodeMemoryUsageHigh(重大) | ノードのメモリ使用量が 80% を超えています。 |
| NodeFilesystemSpaceFillingUp(警告) | ノードのファイル システムの使用量が 60% を超えています。 |
| NodeFilesystemSpaceFillingUp(重大) | ノードファイル システムの使用量が 85% を超えています。 |
| CertManagerCertExpirySoon(警告) | 証明書の有効期限が 21 日後に切れます。 |
| CertManagerCertNotReady(重大) | 10 分後にトラフィックを処理するための証明書が準備ができていません。 |
| CertManagerHittingRateLimits(重大) | 5 分間にわたり、証明書の作成と更新のレート制限に達しました。 |
| DeploymentNotReady(重大)。 | 組織管理クラスタの Deployment が 15 分以上準備されていない状態です。 |
alertmanagerConfigurationConfigmaps のサンプル
alertmanagerConfigurationConfigmaps にリストされている ConfigMap の構成の構文は、https://prometheus.io/docs/alerting/latest/configuration/ に従う必要があります。
apiVersion: observability.gdc.goog/v1alpha1
kind: ObservabilityPipeline
metadata:
  # Choose namespace that matches the project's namespace
  namespace: kube-system
  name: observability-config
# Configure Alertmanager
 alerting:
  # Storage size for alerting data within organization
  # Permission: PA
  localStorageSize: 1Gi

  # Permission: PA & AO
  # alertmanager config must be under the key "alertmanager.yml" in the configMap
  alertmanagerConfig: <configmap-for-alertmanager-config>

  # Permission: PA
  volumes:
    - <volume referenced in volumeMounts>

  # Permission: PA
  volumeMounts:
    - <volumeMount referenced in alertmanagerConfig>
ルール設定の例
# Configures either an alert or a target record for precomputation
apiVersion: monitoring.gdc.goog/v1alpha1
kind: MonitoringRule
metadata:
  # Choose namespace that contains the metrics that rules are based on
  # Note: alert/record will be produced in the same namespace
  namespace: g-fleetns-a
  name: alerting-config
spec:
  # Rule evaluation interval
  interval: <duration>

  # Configure limit for number of alerts (0: no limit)
  # Optional, Default: 0 (no limit)
  limit: <int>

  # Configure record rules
  recordRules:
    # Define which timeseries to write to (must be a valid metric name)
  - record: <string>

    # Define PromQL expression to evaluate for this rule
    expr: <string>

    # Define labels to add or overwrite
    # Optional, Map of {key, value} pairs
    labels:
      <labelname>: <labelvalue>

  # Configure alert rules
  alertRules:
    # Define alert name
  - alert: <string>

    # Define PromQL expression to evaluate for this rule
    # https://prometheus.io/docs/prometheus/latest/configuration/alerting_rules/
    expr: <string>

    # Define when an active alert moves from pending to firing
    # Optional, Default: 0s
    for: <duration>

    # Define labels to add or overwrite
    # Required, Map of {key, value} pairs
    # Required labels:
    #     severity: [error, critical, warning, info]
    #     code:
    #     resource: component/service/hardware related to alert
    #     additional labels are optional
    labels:
      severity: <enum: [error, critical, warning, info]>
      code:
      resource: <Short name of the related operable component>
      <labelname>: <tmpl_string>

    # Define annotations to add
    # Optional, Map of {key, value} pairs
    # Recommended annotations:
    #     message: value of Message field in UI
    #     expression: value of Rule field in UI
    #     runbookurl: URL for link in Actions to take field in UI
    annotations:
      <labelname>: <tmpl_string>
# Configures either an alert or a target record for precomputation
apiVersion: logging.gdc.goog/v1alpha1
kind: LoggingRule
metadata:
  # Choose namespace that contains the logs that rules are based on
  # Note: alert/record will be produced in the same namespace
  namespace: g-fleetns-a
  name: alerting-config
spec:
  # Choose which log source to base alerts on (Operational/Audit/Security Logs)
  # Optional, Default: Operational
  source: <string>

  # Rule evaluation interval
  interval: <duration>

  # Configure limit for number of alerts (0: no limit)
  # Optional, Default: 0 (no limit)
  limit: <int>

  # Configure record rules
  recordRules:
    # Define which timeseries to write to (must be a valid metric name)
  - record: <string>

    # Define LogQL expression to evaluate for this rule
    # https://grafana.com/docs/loki/latest/rules/
    expr: <string>

    # Define labels to add or overwrite
    # Optional, Map of {key, value} pairs
    labels:
      <labelname>: <labelvalue>

  # Configure alert rules
  alertRules:
    # Define alert name
  - alert: <string>

    # Define LogQL expression to evaluate for this rule
    expr: <string>

    # Define when an active alert moves from pending to firing
    # Optional, Default: 0s
    for: <duration>

    # Define labels to add or overwrite
    # Required, Map of {key, value} pairs
    # Required labels:
    #     severity: [error, critical, warning, info]
    #     code:
    #     resource: component/service/hardware related to alert
    #     additional labels are optional
    labels:
      severity: <enum: [error, critical, warning, info]>
      code:
      resource: <Short name of the related operable component>
      <labelname>: <tmpl_string>

    # Define annotations to add
    # Optional, Map of {key, value} pairs
    # Recommended annotations:
    #     message: value of Message field in UI
    #     expression: value of Rule field in UI
    #     runbookurl: URL for link in Actions to take field in UI
    annotations:
      <labelname>: <tmpl_string>
HTTP API からアラートをクエリする
オブザーバビリティ プラットフォームは、システム モニタリング用にプロジェクトから指標、アラート、その他の時系列データをクエリして読み取るための HTTP API エンドポイントを公開します。Observability HTTP API から直接クエリ アラートを取得して、ユースケースに応じて自動タスクを設定し、レスポンスを調整し、インテグレーションを構築します。たとえば、出力を別のコマンドに挿入したり、詳細をテキスト ファイル形式にエクスポートしたり、Linux cron ジョブを構成したりします。コマンドライン インターフェース(CLI)またはウェブブラウザから Observability HTTP API を呼び出し、結果を JSON 形式で取得できます。
このセクションでは、API 仕様を使用して、CLI から Observability HTTP API エンドポイントを呼び出してアラートをクエリする方法について説明します。
Observability HTTP API から直接クエリ アラートを取得して、ユースケースに応じて自動タスクを設定し、レスポンスを調整し、インテグレーションを構築します。たとえば、出力を別のコマンドに挿入したり、詳細をテキスト ファイル形式にエクスポートしたり、Linux cron ジョブを構成したりします。コマンドライン インターフェース(CLI)またはウェブブラウザから Observability HTTP API を呼び出し、結果を JSON 形式で取得できます。
このセクションでは、Alertmanager API 仕様を使用して指標をクエリするために、CLI から Observability HTTP API エンドポイントを呼び出す方法について説明します。
始める前に
オブザーバビリティ HTTP API エンドポイントにアクセスするために必要な権限を取得するには、プロジェクトの IAM 管理者に、プロジェクトの Namespace で Project Cortex Alertmanager 閲覧者(project-cortex-alertmanager-viewer)ロールを付与するよう依頼してください。
プロジェクト IAM 管理者は、ロール バインディングを作成してアクセス権を付与できます。
a. インフラストラクチャ オペレーター(IO)ルート管理者 - Project Cortex Alertmanager Viewer:
kubectl --kubeconfig $HOME/root-admin-kubeconfig create rolebinding
io-cortex-alertmanager-viewer-binding -n infra-obs
--user=fop-infrastructure-operator@example.com
--role=project-cortex-alertmanager-viewer
b. Platform-Admin(PA)Root-Admin - Project Cortex Alertmanager Viewer:
kubectl --kubeconfig $HOME/root-admin-kubeconfig create rolebinding
pa-cortex-alertmanager-viewer-binding -n platform-obs
--user=fop-platform-admin@example.com
--role=project-cortex-alertmanager-viewer
c. アプリケーション オペレーター(AO)ルート管理者 - Project Cortex Alertmanager 閲覧者: プロジェクト: $AO_PROJECT AO ユーザー名: $AO_USER
kubectl --kubeconfig $HOME/root-admin-kubeconfig create rolebinding
project-cortex-alertmanager-viewer-binding -n $AO_PROJECT
--user=$AO_USER
--role=project-cortex-alertmanager-viewer
ロール バインディングを作成すると、ログイン ユーザー名で対応する Alertmanager にアクセスできます。
ロール バインディングを確認する
kubectl --kubeconfig $HOME/org-1-admin-kubeconfig get rolebinding -n platform-obs
GDC コンソールからロール バインディングを設定する方法については、リソースへのアクセス権を付与するをご覧ください。
Cortex エンドポイント
次の URL は、アラートにアクセスするための Cortex エンドポイントです。
https://GDC_URL/PROJECT_NAME/cortex/alertmanager/
次のように置き換えます。
- GDC_URL: GDC 内の組織の URL。
- PROJECT_NAME: プロジェクトの名前。
API エンドポイントを呼び出す
CLI から Cortex API エンドポイントにアクセスしてアラートをクエリする手順は次のとおりです。
- 前提条件を満たしていることを確認します。
- CLI を開きます。
curlツールを使用して Cortex エンドポイント URL を呼び出し、標準の https://prometheus.io/docs/prometheus/latest/querying/api/#alertmanagers を使用して URL を拡張し、アラートをクエリします。次に例を示します。curl https://console.org-1.zone1.google.gdch.test/alice/cortex/alertmanager/api/v1/alertmanagers
コマンドの後に CLI で出力が取得されます。API レスポンスの形式は JSON です。