Cloud Deploy shows metrics for how many deployments occur for a given delivery pipeline, over time, and how many of those deployments succeed.
About Cloud Deploy metrics
All deployment metrics in Cloud Deploy have the following characteristics:
All metrics are measured per delivery pipeline.
All metrics are for deployments to your production target.
The final target in your delivery pipeline progression is considered to be the production target.
All metrics are measured for a rolling 30-day period.
For example, the Deployments metric counts the number of successful and failed deployments over the last 30 days.
Metrics consider successful deployments, and some also report failed deployments.
A successful deployment is one for which the pod or pods report a ready state. The Deployment failure rate metric counts failures as a percentage of all deployment attempts.
Cloud Deploy makes the following deployment metrics available in Google Cloud console:
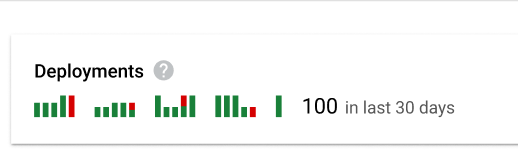
The Deployments metric
The Deployments metric shows the number of successful and failed deployments from the selected delivery pipeline to your production cluster.
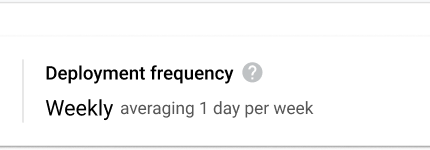
The Deployment frequency metric
The Deployment frequency metric shows how often the delivery pipeline successfully deploys to the production target per day. This is one of the four key metrics defined by the DevOps Research and Assessment (DORA) research program.
How Deployment frequency is calculated
Deployment frequency is calculated based on the number of deployment days, not the number of deployments. That is, if the delivery pipeline generates four deployments to production on a given day, that's counted as one deployment day.
This metric is expressed per day, per week, or per month, depending on how many deployments there are:
If the median number of deployment days per week is greater than or equal to 3, then the frequency is expressed as daily:
".8 times per day."
Otherwise, if more than 2 weeks have more than 0 deployment days then it's expressed as weekly:
"2 days per week."
Otherwise, if there's at least one deployment day per month, then it's expressed as monthly:
"2 days per month."
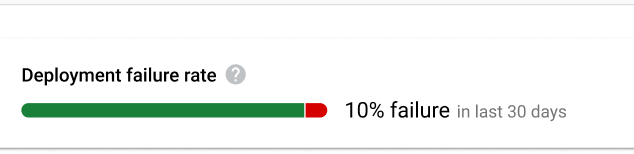
The Deployment failure rate metric
The Deployment failure rate metric shows the percentage of deployments that have failed.