本頁提供 Key Visualizer 診斷工具的總覽,適用於 Datastore 模式的 Firestore。
何謂 Key Visualizer?
Key Visualizer 是一項工具,可協助您分析 Datastore 模式的使用模式。這項工具會依據您存取的實體,或在實體修改時寫入或刪除的索引項目,產生詳細分析使用情形的圖表型報表。
Key Visualizer 可提供大規模使用模式的深入分析。 Key Visualizer 的用途包括:
- 排解效能問題。Key Visualizer 可協助您找出資料庫中因連續實體或索引鍵的熱點,或流量突然增加而導致的效能問題。
- 進一步瞭解如何存取 Datastore 模式中儲存的資料。
- 反覆設計資料模型,或改善現有資料模型的設計。在每次疊代中,您都可以查看 Key Visualizer,找出資料模型造成的問題。
為達成這些目標,Key Visualizer 可協助您完成下列工作:
- 檢查讀取或寫入作業是否會在特定實體範圍內建立熱點。
- 瞭解流量突然增加對延遲時間的影響。
- 查看資料庫的存取模式是否平衡。
- 檢查索引鍵的結構,找出導致索引載入問題的索引定義。
- 使用索引鍵視覺化功能,更準確地預測工作負載模式。
掃描資格
每次 Key Visualizer 掃描都會涵蓋兩小時的時間範圍。如果資料庫在特定時段內,任何一分鐘的流量超過 3000 項文件作業,即可掃描該時段的資料庫。
掃描資格完全取決於資料庫活動。這項作業不會受到資料庫中的資料量或資料類型影響。
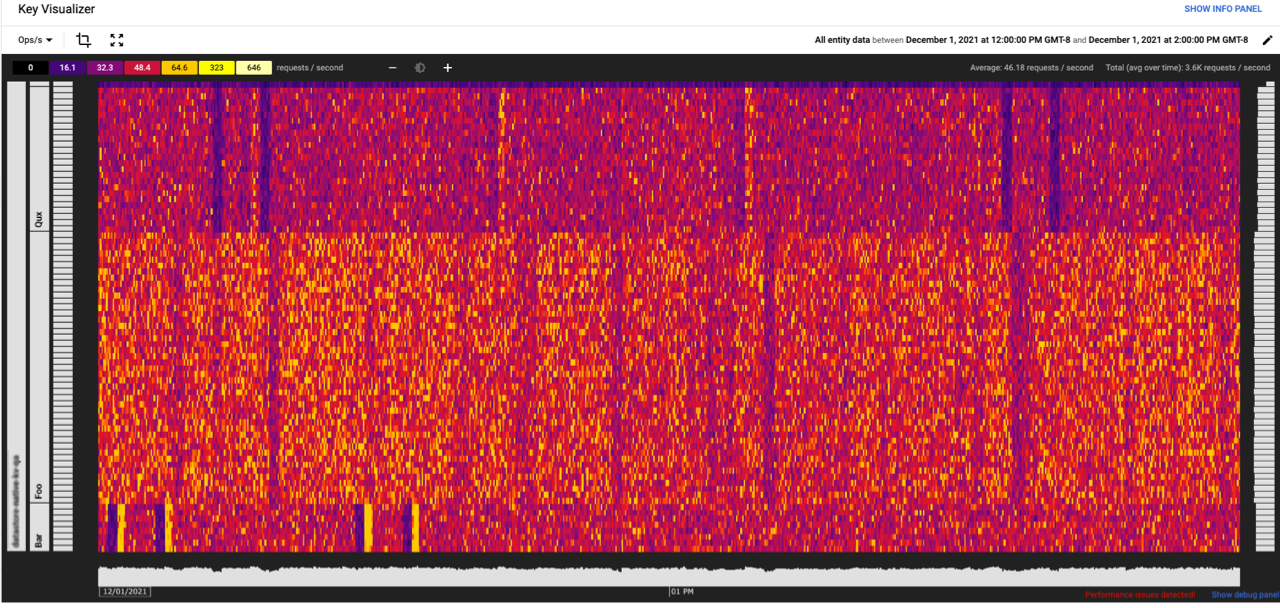
Key Visualizer 掃描
下圖顯示了 Key Visualizer 掃描。每次掃描都會產生熱度圖,顯示一段時間內一組實體鍵或索引鍵的存取模式或效能指標。
分享掃描網址
您可以分享或將 Key Visualizer 掃描的網址加入書籤。網址會開啟相同的 Key Visualizer 掃描,並選取相同的指標。這個網址在掃描資料期限到期前都有效。
熱視圖
Key Visualizer 掃描的核心是熱視圖,可顯示一段時間內的指標值,最多可細分為 1000 個連續的鍵值區間。
如果是實體鍵熱視圖,熱視圖的 x 軸代表時間,y 軸代表實體鍵;如果是索引鍵熱視圖,熱視圖的 x 軸代表時間,y 軸代表索引鍵。
Datastore 模式的 Firestore 每次 Key Visualizer 掃描作業,都會涵蓋兩小時的活動,並分成 10 秒的區段。
指標值偏低會視為「冷」,並以深色顯示。 值越高就越「熱」,並以亮色顯示。最高值會以白色顯示。
不同類型的使用狀況會讓熱視圖中有不同的視覺模式,您可以一目了然地診斷問題。如需一些常見模式的範例,請參閱「實體鍵的熱視圖模式」或「索引鍵的熱視圖模式」。
Key Visualizer 提供多種工具,協助您瞭解每次掃描的資料。 請參閱「開始使用 Key Visualizer」和「探索熱視圖」。
鍵值容器
Key Visualizer 會將資料庫中的所有鍵分成最多 1,000 個連續範圍,每個範圍的鍵數和每秒作業數 (Ops/s) 大致相同。這些範圍稱為「索引鍵值區」。
Key Visualizer 會使用資料庫的總 Ops/s 分割索引鍵值區,讓每個區塊擷取大致相同的 Ops/s 數量,且每個索引鍵值區的預期大小至少為 50 Ops/s。如果資料庫的總 Ops/s 較高,每個主要值區可擷取超過 50 Ops/s。如果資料庫的每秒作業數少於 50,掃描結果會顯示單一金鑰特徵分塊。
Key Visualizer 會將大多數的指標回報為每個索引鍵值區的平均值或每個索引鍵值區內的最大值。
指標
Key Visualizer 掃描結果中的實體鍵可使用下列指標:
| 指標 | 說明 |
|---|---|
| 活動指標 | |
| 作業數/秒 | 每秒的平均實體作業數。約等於每秒寫入、查閱和查詢次數的總和。這項指標可以說明哪些索引鍵是熱鍵。 |
| 每秒寫入作業數 | 寫入和刪除作業每秒的平均實體作業數。 |
| 每秒查詢次數 | 每秒的平均實體作業數 (適用於查詢)。 |
| 每秒查詢作業數 | 查詢每秒的平均實體作業數。 |
| 成效指標 | |
| 寫入作業的平均延遲時間 | bucket 中已處理資料的寫入和刪除作業平均延遲時間。 |
| 平均查詢延遲時間 | 在值區中處理的資料內進行查閱的平均延遲時間。 |
| 平均查詢延遲時間 | 值區中處理資料的查詢平均延遲時間。 |
| 寫入尾部延遲 | 在 bucket 中處理的資料內,觀察到的寫入或刪除作業延遲時間上限。 |
| 查詢尾延遲 | 儲存區中處理的資料內,觀察到的最大查閱延遲時間。 |
| 查詢尾延遲 | 在 bucket 中處理的資料內,觀察到的查詢延遲時間上限。 |
Key Visualizer 掃描結果中的索引鍵可提供下列指標:
| 指標 | 說明 |
|---|---|
| 索引寫入作業數/秒 | 每秒平均索引寫入次數。 |
平均成效
平均延遲時間指標會計算索引鍵值區中索引鍵的平均值。 由於這項指標是在儲存層測量,因此這裡回報的延遲時間可能低於 API 呼叫的總延遲時間。
限制
雖然 Key Visualizer 會顯示各種指標,但不會顯示所有可能影響 Datastore 模式效能的指標。例如:
- 應用程式與 Google Cloud 之間的網路問題可能不會顯示。在 Key Visualizer 中,這些問題可能會顯示為橫跨所有按鍵的垂直帶狀,但只能提供問題發生「時間」的提示。
資料時間長度
Key Visualizer 收集的 Firestore (Datastore 模式) 資料會在 14 天後刪除。
Key Visualizer 資料的效期為資料產生後的 14 天內。舉例來說,如果您在 12 月 19 日下午 12:45 啟動 Key Visualizer,則可選擇的最早開始時間為 12 月 5 日下午 1:00,時間範圍為 2 小時。
這也表示,如果您為 Key Visualizer 掃描結果加上書籤或分享網址,該網址的有效期限最長為 14 天。
後續步驟
- 瞭解如何開始使用 Key Visualizer。
- 瞭解您在 Key Visualizer 熱視圖中可能會看到的實體鍵模式或索引鍵模式。
- 瞭解如何深入探索熱視圖。