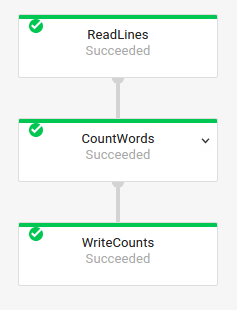
// Read the lines of the input text.p.apply("ReadLines",TextIO.read().from(options.getInputFile()))// Count the words..apply(newCountWords())// Write the formatted word counts to output..apply("WriteCounts",TextIO.write().to(options.getOutput()));
Python
(pipeline# Read the lines of the input text.|'ReadLines' >> beam.io.ReadFromText(args.input_file)# Count the words.|CountWords()# Write the formatted word counts to output.|'WriteCounts' >> beam.io.WriteToText(args.output_path))
Go
// Create the pipeline.p:=beam.NewPipeline()s:=p.Root()// Read the lines of the input text.lines:=textio.Read(s,*input)// Count the words.counted:=beam.ParDo(s,CountWords,lines)// Write the formatted word counts to output.textio.Write(s,*output,formatted)
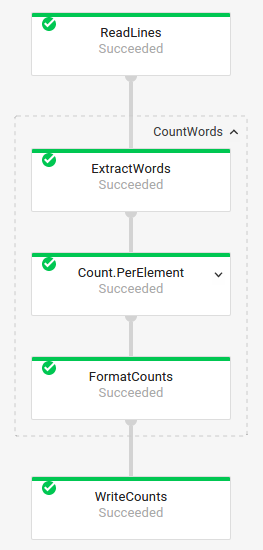
// The CountWords Composite Transform// inside the WordCount pipeline.publicstaticclassCountWordsextendsPTransform<PCollection<String>,PCollection<String>>{@OverridepublicPCollection<String>apply(PCollection<String>lines){// Convert lines of text into individual words.PCollection<String>words=lines.apply(ParDo.of(newExtractWordsFn()));// Count the number of times each word occurs.PCollection<KV<String,Long>>wordCounts=words.apply(Count.<String>perElement());returnwordCounts;}}
Python
# The CountWords Composite Transform inside the WordCount pipeline.@beam.ptransform_fndefCountWords(pcoll):return(pcoll# Convert lines of text into individual words.|'ExtractWords' >> beam.ParDo(ExtractWordsFn())# Count the number of times each word occurs.|beam.combiners.Count.PerElement()# Format each word and count into a printable string.|'FormatCounts' >> beam.ParDo(FormatCountsFn()))
Go
// The CountWords Composite Transform inside the WordCount pipeline.funcCountWords(sbeam.Scope,linesbeam.PCollection)beam.PCollection{s=s.Scope("CountWords")// Convert lines of text into individual words.col:=beam.ParDo(s,&extractFn{SmallWordLength:*smallWordLength},lines)// Count the number of times each word occurs.returnstats.Count(s,col)}
[[["容易理解","easyToUnderstand","thumb-up"],["確實解決了我的問題","solvedMyProblem","thumb-up"],["其他","otherUp","thumb-up"]],[["難以理解","hardToUnderstand","thumb-down"],["資訊或程式碼範例有誤","incorrectInformationOrSampleCode","thumb-down"],["缺少我需要的資訊/範例","missingTheInformationSamplesINeed","thumb-down"],["翻譯問題","translationIssue","thumb-down"],["其他","otherDown","thumb-down"]],["上次更新時間:2025-09-04 (世界標準時間)。"],[[["\u003cp\u003eThe Dataflow monitoring interface uses a job graph to visually represent each job, including a job summary, job log, and pipeline step information.\u003c/p\u003e\n"],["\u003cp\u003eJob graph steps are represented as boxes, each indicating the transform name and current status, such as Running, Queued, Succeeded, Stopped, Unknown, or Failed.\u003c/p\u003e\n"],["\u003cp\u003eThe job graph can be viewed in either "Graph view" or "Table view," with the latter being particularly useful for jobs with many stages or when sorting steps by specific properties.\u003c/p\u003e\n"],["\u003cp\u003eComposite transforms, which contain nested sub-transforms, are expandable in the job graph, allowing users to view their sub-transforms by clicking an arrow.\u003c/p\u003e\n"],["\u003cp\u003eThe "Wall time" metric displayed for each step in the job graph provides an estimate of the total time spent across all threads and can help identify slow steps in the pipeline.\u003c/p\u003e\n"],["\u003cp\u003eSide input metrics display how the side input access patterns affect pipeline performance and include: Time spent writing, Bytes written, Time & bytes read from side input, and side input collection name.\u003c/p\u003e\n"]]],[],null,["# Dataflow job graphs\n\nThe Dataflow monitoring interface provides a graphical representation\nof each job: the *job graph*. The job graph also provides a job summary, a\njob log, and information about each step in the pipeline.\n\nTo view the job graph for a job, perform the following steps:\n\n1. In the Google Cloud console, go to the **Dataflow**\n \\\u003e **Jobs** page.\n\n [Go to Jobs](https://console.cloud.google.com/dataflow/jobs)\n2. Select a job.\n\n3. Click the **Job graph** tab.\n\nBy default, the job graph page displays the **Graph view** . To view your job\ngraph as a table, in **Job steps view** , select **Table view**. The table view\ncontains the same information in a different format. The table view is\nhelpful in the following scenarios:\n\n- Your job has many stages, making the job graph difficult to navigate.\n- You want to sort the job steps by a specific property. For example, you can sort the table by [wall time](/dataflow/docs/guides/step-info-panel#wall-time) to identify slow steps.\n\nGraph view\n----------\n\nThe job graph represents each transform in the pipeline as a box. The following\nimage shows a job graph with three transforms: `Read PubSub Events`,\n`5m Window`, and `Write File(s)`.\n\nEach box contains the following information:\n\n- [Transform name](#transform-names)\n\n- Status; one of the following:\n\n - **Running**: the step is running\n - **Queued** : the step in a [FlexRS job](/dataflow/docs/guides/flexrs#delayed_scheduling) is queued\n - **Succeeded**: the step finished successfully\n - **Stopped**: the step stopped because the job stopped\n - **Unknown**: the step failed to report status\n - **Failed**: the step failed to complete\n- [Data lag](/dataflow/docs/guides/step-info-panel#data-watermark)\n\n- [Wall time](/dataflow/docs/guides/step-info-panel#wall-time)\n\n- [Maximum operation latency](/dataflow/docs/guides/step-info-panel#operation-latency)\n\n- The number of job stages that execute this step\n\nIf a step represents a\n[composite transform](https://beam.apache.org/documentation/programming-guide/#composite-transforms),\nyou can expand the step to view the sub-transforms. To expand the step, click\nthe expand_more **Expand node** arrow.\n\nTransform names\n---------------\n\nDataflow has a few different ways to obtain the transform name\nthat's shown in the monitoring job graph. Transform names are used in publicly-visible places, including the\nDataflow monitoring interface, log files, and debugging tools.\nDon't use transform names that include personally identifiable information,\nsuch as usernames or organization names. \n\n### Java\n\n- **Dataflow can use a name that you assign** when you apply your transform. The first argument you supply to the `apply` method is your transform name.\n- **Dataflow can infer the transform name** , either from the class name, if you build a custom transform, or the name of your `DoFn` function object, if you use a core transform such as `ParDo`.\n\n### Python\n\n- **Dataflow can use a name that you assign** when you apply your transform. You can set the transform name by specifying the transform's `label` argument.\n- **Dataflow can infer the transform name** , either from the class name, if you build a custom transform, or the name of your `DoFn` function object, if you use a core transform such as `ParDo`.\n\n### Go\n\n- **Dataflow can use a name that you assign** when you apply your transform. You can set the transform name by specifying the `Scope`.\n- **Dataflow can infer the transform name** , either from the struct name if you're using a structural `DoFn` or from the function name if you're using a functional `DoFn`.\n\nView step information\n---------------------\n\nWhen you click a step in the job graph, the **Step Info** panel shows more\ndetails about the step. For more information, see\n[Job step information](/dataflow/docs/guides/step-info-panel).\n\nBottlenecks\n-----------\n\nIf Dataflow detects a bottleneck, the job graph shows an\nwarning alert symbol on the affected steps.\nTo see the cause of the bottleneck, click the step to open the\n[**Step Info** panel](/dataflow/docs/guides/step-info-panel). For more\ninformation, see\n[Troubleshoot bottlenecks](/dataflow/docs/guides/troubleshoot-bottlenecks).\n\nExample job graphs\n------------------\n\nThis section shows some example pipeline code and the corresponding job graphs.\n\n### Basic job graph\n\nFigure 1: The pipeline code for a WordCount pipeline shown with the resulting execution graph in the Dataflow monitoring interface.\n\n### Job graph with composite transforms\n\n[Composite transforms](https://beam.apache.org/documentation/programming-guide/#composite-transforms)\nare transforms that contain multiple nested sub-transforms. In the job graph,\ncomposite transforms are expandable. To expand the transform and view the\nsub-transforms, click the arrow.\n\nFigure 2: The pipeline code for the sub-steps of the CountWords transform. Shown with the job graph expanded for the entire pipeline.\n\nIn your pipeline code, you might use the following code to invoke your composite transform: \n\n```\nresult = transform.apply(input);\n```\n\nComposite transforms invoked in this manner omit the expected nesting and might\nappear expanded in the Dataflow monitoring\ninterface. Your pipeline might also generate warnings or errors about stable\nunique names at pipeline execution time.\n\nTo avoid these issues, invoke your transforms by using the\n[recommended format](/dataflow/model/transforms):\n\n`result = input.apply(transform);`\n\nWhat's next\n-----------\n\n- [View detailed job step information](/dataflow/docs/guides/step-info-panel)\n- [View job stages in the **Execution details** tab](/dataflow/docs/concepts/execution-details)\n- [Troubleshoot your pipeline](/dataflow/docs/guides/troubleshooting-your-pipeline)"]]