Cette page explique comment surveiller les instances AlloyDB à l'aide des méthodes suivantes :
- Surveillez une instance à l'aide du tableau de bord des insights système AlloyDB.
- Surveillez une instance à l'aide du tableau de bord Cloud Monitoring.
- Affichez les métriques sur la page de présentation du cluster AlloyDB.
Vous pouvez utiliser Gemini Cloud Assist pour vous aider à surveiller et à résoudre les problèmes liés à vos ressources AlloyDB. Pour en savoir plus, consultez Surveiller et résoudre les problèmes avec l'aide de Gemini.
Avant de commencer
Pour accéder au tableau de bord "Insights système", activez l'accès à AlloyDB pour PostgreSQL dans votre projet Google Cloud .
Rôles requis
Pour utiliser les insights sur le système AlloyDB, vous devez disposer des autorisations suivantes :
- Pour accéder aux insights système, vous devez disposer des autorisations nécessaires pour accéder au tableau de bord des insights système AlloyDB.
- Pour modifier les insights système, vous devez disposer des autorisations nécessaires pour mettre à jour les instances AlloyDB.
Pour obtenir ces autorisations, demandez à votre administrateur de vous attribuer l'un des rôles suivants :
- Lecteur de base (
roles/viewer) - Lecteur Database Insights (
roles/databaseinsights.eventsViewer)
Pour en savoir plus sur l'attribution de rôles, consultez la section Gérer les accès.
Surveiller une instance à l'aide du tableau de bord des insights système AlloyDB
Le tableau de bord "Insights système" d'AlloyDB affiche les métriques des ressources que vous utilisez et vous permet de les surveiller.
En plus du tableau de bord prédéfini généré par Insights système, vous pouvez créer un tableau de bord personnalisé avec les personnalisations suivantes :
- Ajouter ou supprimer des métriques AlloyDB
- Intégrez des métriques provenant d'autres produits Google Cloud , tels que GKE Enterprise, pour obtenir une vue plus globale de votre système.
- Réorganiser la mise en page du tableau de bord
Pour afficher le tableau de bord des insights système AlloyDB :
Dans la console Google Cloud , ouvrez la page AlloyDB.
Cliquez sur le nom d'un cluster pour ouvrir sa page Présentation.
Sélectionnez l'onglet Insights système.
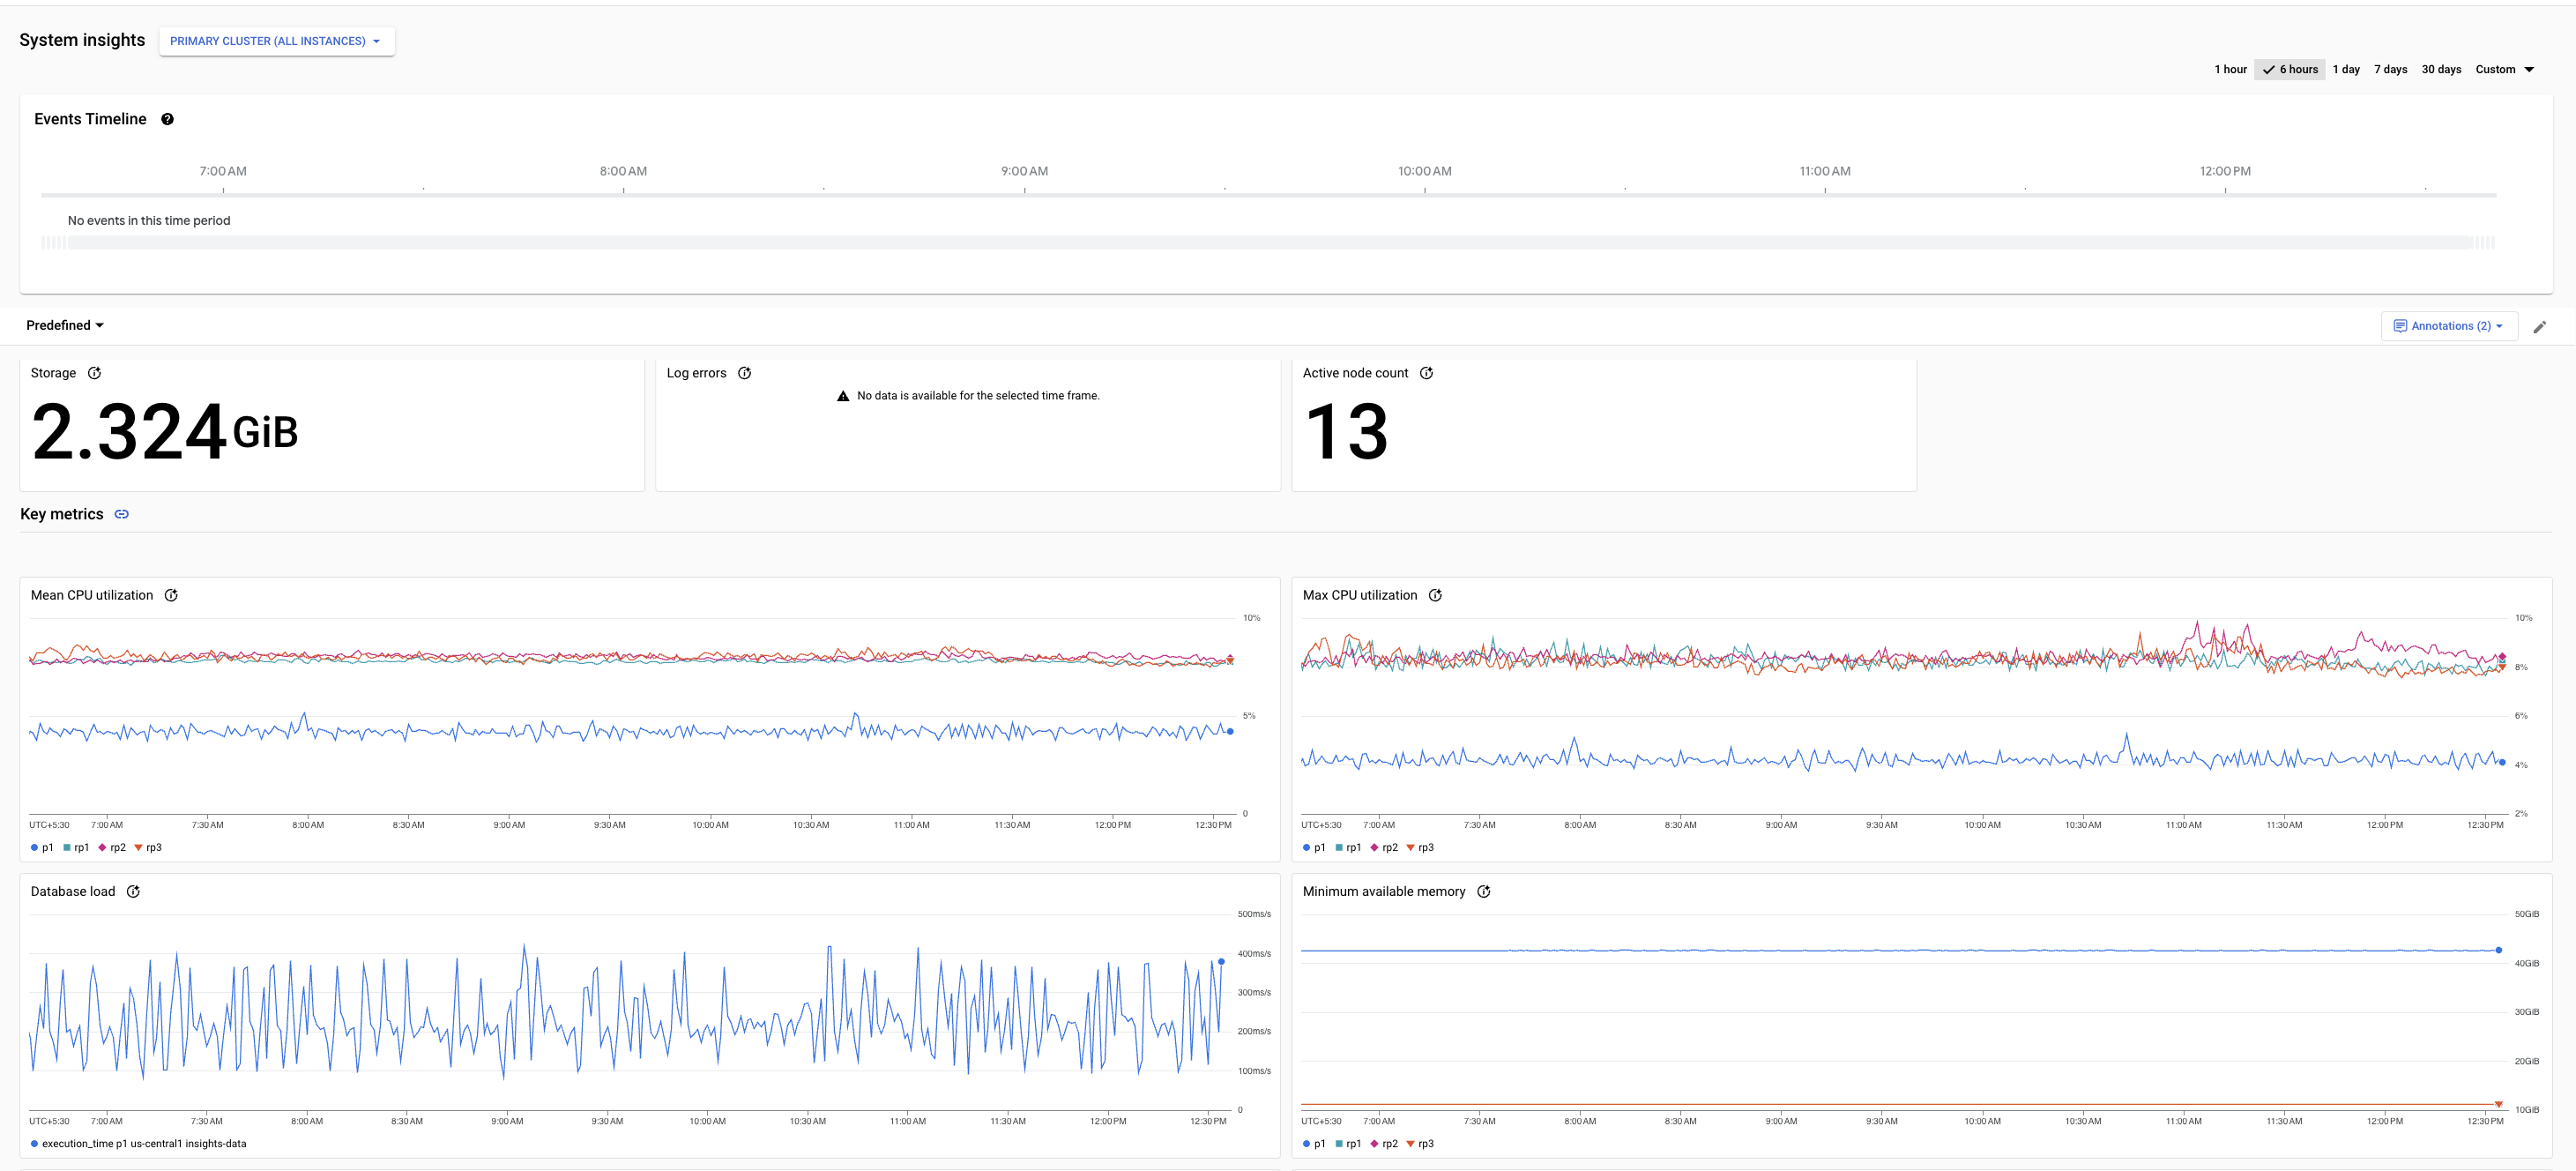
Le tableau de bord "Insights sur le système AlloyDB" s'ouvre. Il présente des détails sur le cluster en haut, suivis des graphiques des métriques clés.
Les tableaux de bord prédéfinis et personnalisés incluent les fonctionnalités suivantes :
Par défaut, la vue Cluster (toutes les instances) est sélectionnée. Vous pouvez choisir d'afficher les métriques de l'instance principale ou celles des instances du pool de lecture.
Le sélecteur de temps affiche
1 daysélectionnée par défaut. Pour modifier la période, sélectionnez l'une des autres périodes prédéfinies ou cliquez sur Personnalisée, puis définissez une heure de début et une heure de fin. Les données disponibles portent sur les 30 derniers jours.
Chaque tableau de bord comprend les sections suivantes :
Les fiches récapitulatives affichent les valeurs les plus récentes ou agrégées pour certaines métriques, et offrent un aperçu de l'état et des performances de la base de données au cours de la période sélectionnée.
Les graphiques de métriques affichent des informations sur les métriques importantes qui vous aident à obtenir des insights sur l'utilisation des ressources (processeur, mémoire, connexions, réplication et stockage, par exemple) et à réagir de manière proactive à mesure que les besoins de votre application changent.
Les événements système affichent des informations qui vous aident à évaluer l'impact des événements système sur l'état et les performances de l'instance.
Fiches récapitulatives
Le tableau suivant décrit les fiches récapitulatives affichées dans le tableau de bord des insights système AlloyDB. Ces fiches présentent l'état et les performances de la base de données au cours de la période sélectionnée.
| Fiches récapitulatives | Description | Disponibilité des tableaux de bord |
|---|---|---|
| Stockage | Espace de stockage total utilisé par le cluster AlloyDB au cours de la période sélectionnée. | Tableau de bord du cluster |
| Nombre de nœuds actifs | Dernier nombre de nœuds actifs pouvant diffuser le trafic utilisateur dans le cluster au cours de la période sélectionnée. |
|
| Utilisation du processeur | Valeurs des 99e et 50e centiles de l'utilisation du processeur au cours de la période sélectionnée. |
|
| Pic de connexions | Ratio entre le pic de connexions et le nombre maximal de connexions sur tous les nœuds de diffusion de l'instance au cours de la période sélectionnée. Cela inclut les connexions actives et inactives. |
|
| Consigner les erreurs | Nombre total de journaux d'erreurs générés au cours de la période sélectionnée. |
|
| Utilisation des ID de transaction | Dernière valeur d'utilisation de l'ID de transaction pour la période sélectionnée. |
|
| Délai de réplication | Valeur moyenne du délai maximal de réplication au cours de la période sélectionnée. |
|
Graphiques des métriques
Le tableau de bord "Insights système" fournit des métriques aux niveaux suivants :
- Cluster principal (toutes les instances)
- Instance principale
- Instances de pool de lecture individuelles
Pour afficher les métriques d'un niveau spécifique, cliquez sur le menu déroulant Cluster principal (toutes les instances) et sélectionnez le tableau de bord correspondant.
Pour en savoir plus sur les métriques de chaque niveau, consultez Documentation de référence sur les métriques des insights système.
Une fiche de graphique pour un exemple de métrique s'affiche comme suit.
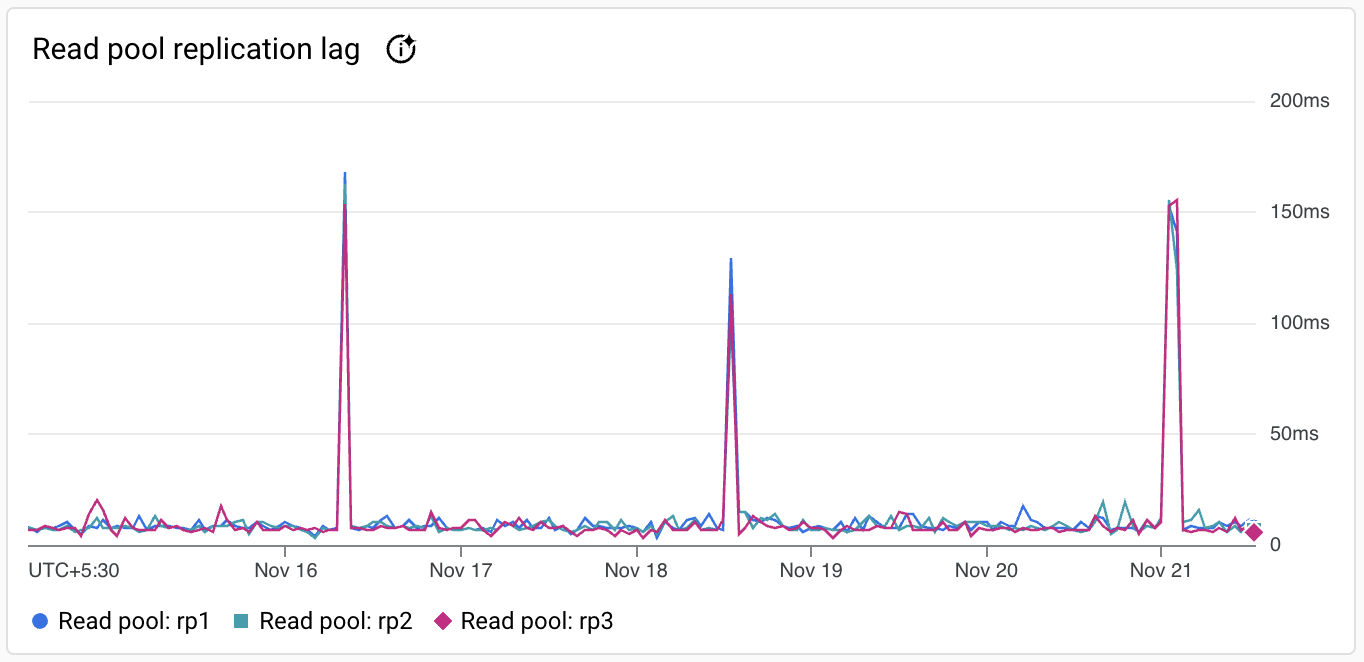
La barre d'outils de chaque fiche de graphique fournit les options standards suivantes :
Pour masquer ou afficher la légende, cliquez sur Plus d'options du graphique, puis sur Développer la légende du graphique.
Pour afficher les valeurs de métrique à un moment spécifique dans la période sélectionnée, déplacez le curseur sur le graphique.
Pour afficher un graphique en mode plein écran, cliquez sur Plus d'options du graphique, puis sur Afficher en plein écran.
Pour zoomer sur un graphique, cliquez sur Explorer les données.
Pour afficher d'autres options, cliquez sur more_vert. La plupart des graphiques offrent les options suivantes :
- Télécharger une image PNG
- Téléchargez un fichier CSV.
- Afficher dans l'Explorateur de métriques. Affichez la métrique dans l'Explorateur de métriques. Vous pouvez afficher d'autres métriques AlloyDB dans l'explorateur de métriques en sélectionnant le type de ressource Instance AlloyDB.
Chronologie des événements
Le tableau de bord fournit des informations sur les événements suivants. Les événements système s'affichent dans la chronologie des événements environ cinq minutes après leur survenue.
| Nom de l'événement | Description | Type d'opération |
|---|---|---|
Instance create |
Crée une instance AlloyDB. | INSTANCE_CREATE |
Instance update |
Met à jour une instance AlloyDB. | INSTANCE_UPDATE |
Instance restart |
Redémarre l'instance AlloyDB. | INSTANCE_RESTART |
Instance failover |
Démarre un basculement manuel d'une instance principale à disponibilité élevée vers une instance de secours, qui devient l'instance principale. | INSTANCE_FAILOVER |
Cluster maintenance |
Indique que le cluster est en maintenance et que les instances deviennent indisponibles pendant quelques minutes. | MAINTENANCE |
Backup create |
Crée une sauvegarde d'une instance AlloyDB. | BACKUP_CREATE |
Backup update |
Met à jour une sauvegarde d'une instance AlloyDB. | BACKUP_UPDATE |
Cluster create |
Crée un cluster AlloyDB. | CLUSTER_CREATE |
Cluster update |
mettre à jour un cluster AlloyDB ; | CLUSTER_UPDATE |
Cluster promote |
Promeut un cluster secondaire en cluster principal. | CLUSTER_PROMOTE |
User create |
Crée un utilisateur. | USER_CREATE |
User update |
Mettez à jour un utilisateur. | USER_UPDATE |
User delete |
Supprime un utilisateur. | USER_DELETE |
Créer un tableau de bord personnalisé
Le tableau de bord Prédéfini inclut un ensemble de métriques par défaut. Vous pouvez créer des widgets supplémentaires pour ajouter d'autres métriques pour AlloyDB ou d'autres produits Google Cloud , et obtenir une vue de surveillance unifiée depuis AlloyDB. Par exemple, si vous utilisez AlloyDB avec l'édition Enterprise de Google Kubernetes Engine (GKE Enterprise), vous pouvez personnaliser le tableau de bord prédéfini. En plus des métriques AlloyDB, vous pouvez ajouter les métriques GKE Enterprise requises, telles que les métriques liées aux pods ou aux nœuds.
Vous pouvez créer un tableau de bord personnalisé en plus du tableau de bord prédéfini.
Pour créer un tableau de bord personnalisé, procédez comme suit :
Dans la console Google Cloud , ouvrez la page AlloyDB.
Cliquez sur le nom d'un cluster pour ouvrir sa page Présentation.
Sélectionnez l'onglet Insights système.
Cliquez sur Prédéfini, puis sur Personnaliser le tableau de bord.
Pour ajouter une métrique au tableau de bord, procédez comme suit :
- Dans Nom de la vue personnalisée, saisissez un nom pour le tableau de bord (par exemple,
my-custom-dashboard). Cliquez sur Ajouter un widget, puis sélectionnez un type de widget pour ajouter une métrique au tableau de bord.
Un volet de configuration s'ouvre. Par exemple, vous pouvez sélectionner le widget Métrique comme données, puis définir la Visualisation sur Barres empilées. Vous pouvez également sélectionner le widget Barres empilées, puis sélectionner la métrique.
Configurez le widget.
Pour enregistrer votre tableau de bord personnalisé, cliquez sur Appliquer dans la barre d'outils.
- Dans Nom de la vue personnalisée, saisissez un nom pour le tableau de bord (par exemple,
Modifier un tableau de bord personnalisé
- Pointez sur le tableau de bord, puis cliquez sur Modifier pour passer en mode édition.
- Pour repositionner un widget, cliquez sur son en-tête et faites-le glisser vers un nouvel emplacement.
- Pour modifier un widget, placez le pointeur sur le tableau de bord, puis cliquez sur Modifier. Pour appliquer vos modifications au tableau de bord, cliquez sur Appliquer dans la barre d'outils. Pour supprimer vos modifications, cliquez sur Annuler.
- Pour supprimer un widget, pointez dessus, cliquez sur Plus d'options pour le graphique, puis sur Supprimer le widget. Pour appliquer vos modifications au tableau de bord, cliquez sur Appliquer dans la barre d'outils. Pour supprimer vos modifications, cliquez sur Annuler.
- Pour enregistrer votre tableau de bord modifié, cliquez sur Enregistrer dans la barre d'outils.
Vous verrez my-custom-dashboard dans la liste des tableaux de bord. Pour supprimer un tableau de bord, placez le pointeur sur le widget, puis cliquez sur Supprimer.
Surveiller une instance à l'aide du tableau de bord Cloud Monitoring
Cloud Monitoring propose des tableaux de bord prédéfinis pour plusieurs produits Google Cloud . Vous pouvez également créer vos propres tableaux de bord personnalisés pour afficher les données qui vous intéressent et surveiller l'état général de vos instances principales et de pool de lecture.
Configurer des alertes
Vous pouvez utiliser Cloud Monitoring pour configurer des alertes pour un projet ou une instance spécifiée.
Par exemple, vous pouvez configurer l'envoi d'une alerte à des ID d'e-mails spécifiques lorsque la métrique d'utilisation de la mémoire d'une instance AlloyDB dépasse le seuil de 80 %.
Afficher les métriques du cluster sur la page "Présentation" du cluster AlloyDB
Sur la page "Vue d'ensemble" du cluster, les métriques associées s'affichent en haut de la page.

Sélectionnez une autre métrique dans la liste déroulante Graphique. Le graphique affiche les données de la métrique sélectionnée.
Étapes suivantes
- Consultez la liste des métriques AlloyDB.
- Consultez la documentation de référence sur les insights système.
- Utilisez Query Insights pour améliorer les performances des requêtes.
- Apprenez-en plus sur Cloud Logging et Cloud Monitoring.
- Surveillez les requêtes actives pour identifier les causes de la latence du système et de l'utilisation élevée du processeur.