A partire dal 29 aprile 2025, i modelli Gemini 1.5 Pro e Gemini 1.5 Flash non sono disponibili nei progetti che non li hanno mai utilizzati, inclusi i nuovi progetti. Per maggiori dettagli, vedi Versioni e ciclo di vita dei modelli.
Mantieni tutto organizzato con le raccolte
Salva e classifica i contenuti in base alle tue preferenze.
Questa pagina mostra come attivare Cloud Trace sul tuo agente
e visualizzare le tracce per analizzare i tempi di risposta alle query e le operazioni eseguite.
Una traccia
è una sequenza temporale di richieste mentre l'agente risponde a ogni query. Ad esempio, il seguente grafico Gantt mostra una traccia di esempio di un LangchainAgent:
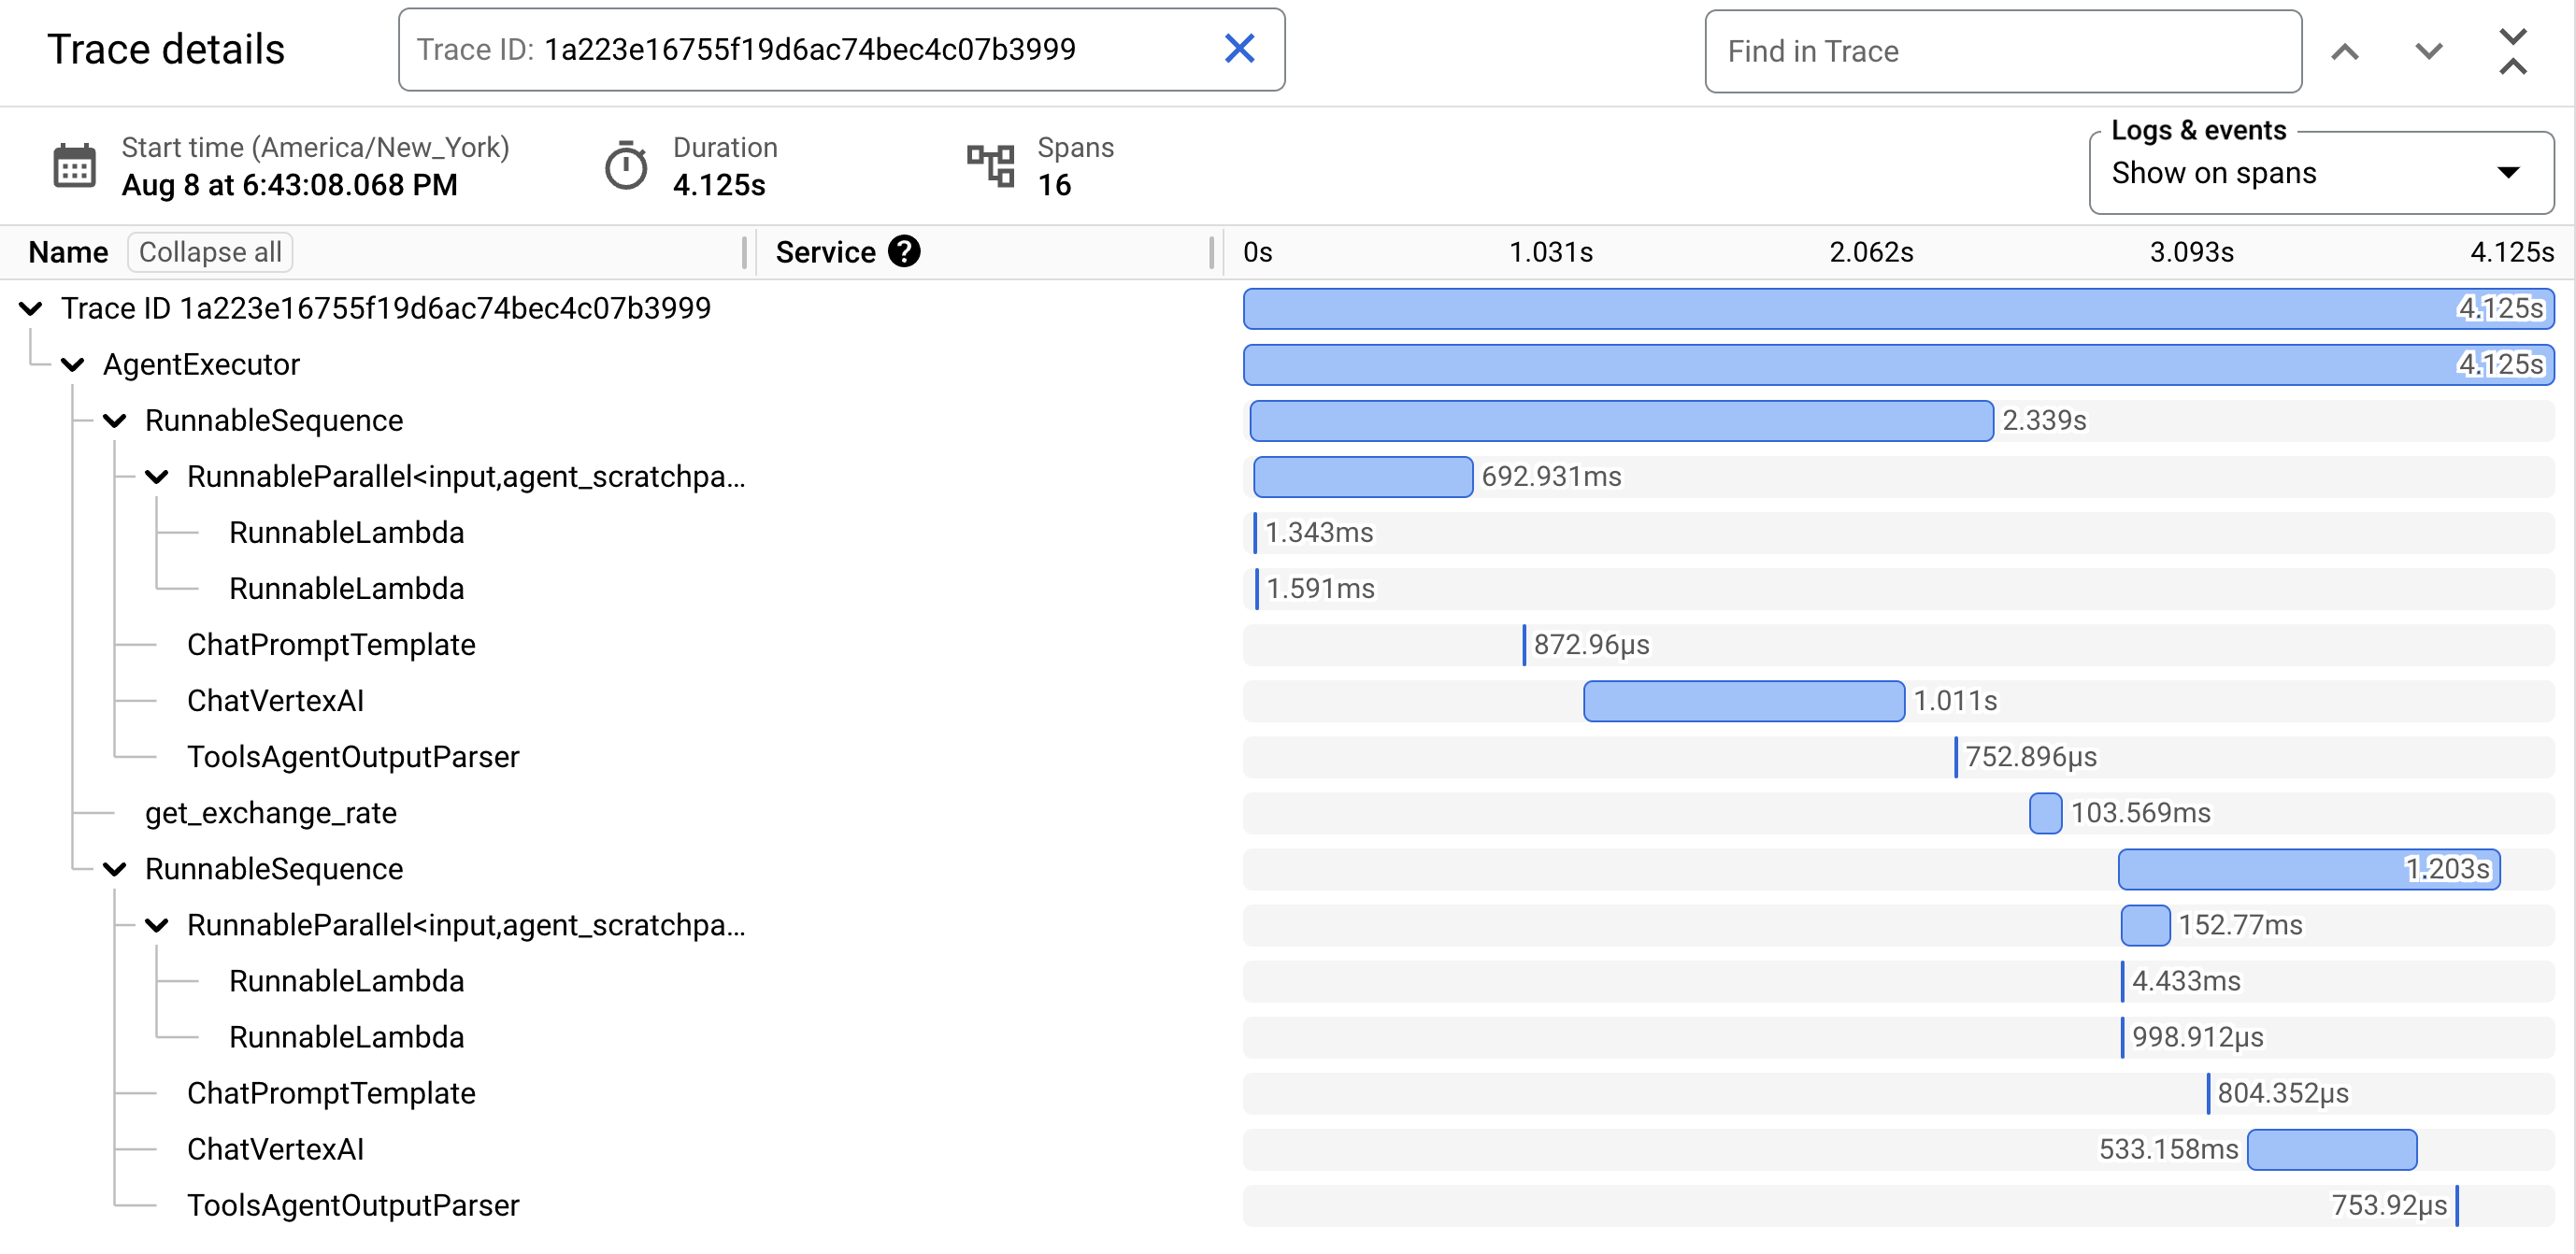
La prima riga del grafico di Gantt è per la traccia. Una traccia è
composta da singoli span, che
rappresentano una singola unità di lavoro, come una chiamata di funzione o un'interazione con un
LLM, con il primo span che rappresenta la richiesta
complessiva. Ogni intervallo fornisce dettagli su un'operazione specifica, ad esempio il nome, l'ora di inizio e di fine e gli attributi pertinenti all'interno della richiesta. Ad esempio, il seguente JSON mostra un singolo span che rappresenta
una chiamata a un modello linguistico di grandi dimensioni (LLM):
{"name":"llm","context":{"trace_id":"ed7b336d-e71a-46f0-a334-5f2e87cb6cfc","span_id":"ad67332a-38bd-428e-9f62-538ba2fa90d4"},"span_kind":"LLM","parent_id":"f89ebb7c-10f6-4bf8-8a74-57324d2556ef","start_time":"2023-09-07T12:54:47.597121-06:00","end_time":"2023-09-07T12:54:49.321811-06:00","status_code":"OK","status_message":"","attributes":{"llm.input_messages":[{"message.role":"system","message.content":"You are an expert Q&A system that is trusted around the world.\nAlways answer the query using the provided context information, and not prior knowledge.\nSome rules to follow:\n1. Never directly reference the given context in your answer.\n2. Avoid statements like 'Based on the context, ...' or 'The context information ...' or anything along those lines."},{"message.role":"user","message.content":"Hello?"}],"output.value":"assistant: Yes I am here","output.mime_type":"text/plain"},"events":[],}
Puoi visualizzare le tue tracce utilizzando Esplora tracce:
Per ottenere le autorizzazioni per visualizzare i dati di traccia nella console Google Cloud o
selezionare un ambito di traccia, chiedi all'amministratore di concederti il ruolo IAM
Utente Cloud Trace
(roles/cloudtrace.user) nel progetto.
Alcuni valori degli attributi potrebbero essere troncati quando raggiungono i limiti di quota. Per
maggiori informazioni, consulta Quota di Cloud Trace.
Prezzi
Cloud Trace ha un livello gratuito. Per maggiori informazioni, consulta la pagina
Prezzi di Cloud Trace.
[[["Facile da capire","easyToUnderstand","thumb-up"],["Il problema è stato risolto","solvedMyProblem","thumb-up"],["Altra","otherUp","thumb-up"]],[["Difficile da capire","hardToUnderstand","thumb-down"],["Informazioni o codice di esempio errati","incorrectInformationOrSampleCode","thumb-down"],["Mancano le informazioni o gli esempi di cui ho bisogno","missingTheInformationSamplesINeed","thumb-down"],["Problema di traduzione","translationIssue","thumb-down"],["Altra","otherDown","thumb-down"]],["Ultimo aggiornamento 2025-09-04 UTC."],[],[],null,["This page shows you how to enable [Cloud Trace](/trace/docs/overview) on your agent\nand view traces to analyze query response times and executed operations.\n\nA [**trace**](https://opentelemetry.io/docs/concepts/signals/traces/)\nis a timeline of requests as your agent responds to each query. For example, the following Gantt chart shows a sample trace from a `LangchainAgent`:\n\n\u003cbr /\u003e\n\nThe first row in the Gantt chart is for the trace. A trace is\ncomposed of individual [**spans**](https://opentelemetry.io/docs/concepts/signals/traces/#spans), which\nrepresent a single unit of work, like a function call or an interaction with an\nLLM, with the first span representing the overall\nrequest. Each span provides details about a specific operation, such as the operation's name, start and end times,\nand any relevant [attributes](https://opentelemetry.io/docs/concepts/signals/traces/#attributes), within the request. For example, the following JSON shows a single span that represents\na call to a large language model (LLM): \n\n {\n \"name\": \"llm\",\n \"context\": {\n \"trace_id\": \"ed7b336d-e71a-46f0-a334-5f2e87cb6cfc\",\n \"span_id\": \"ad67332a-38bd-428e-9f62-538ba2fa90d4\"\n },\n \"span_kind\": \"LLM\",\n \"parent_id\": \"f89ebb7c-10f6-4bf8-8a74-57324d2556ef\",\n \"start_time\": \"2023-09-07T12:54:47.597121-06:00\",\n \"end_time\": \"2023-09-07T12:54:49.321811-06:00\",\n \"status_code\": \"OK\",\n \"status_message\": \"\",\n \"attributes\": {\n \"llm.input_messages\": [\n {\n \"message.role\": \"system\",\n \"message.content\": \"You are an expert Q&A system that is trusted around the world.\\nAlways answer the query using the provided context information, and not prior knowledge.\\nSome rules to follow:\\n1. Never directly reference the given context in your answer.\\n2. Avoid statements like 'Based on the context, ...' or 'The context information ...' or anything along those lines.\"\n },\n {\n \"message.role\": \"user\",\n \"message.content\": \"Hello?\"\n }\n ],\n \"output.value\": \"assistant: Yes I am here\",\n \"output.mime_type\": \"text/plain\"\n },\n \"events\": [],\n }\n\n| **Note:** The format of the trace(s) and span(s) depends on the instrumentation option you go with. The example span is experimental and subject to change so you shouldn't rely on the format to be stable for now. For details, see the [Semantic Conventions for Generative AI systems](https://opentelemetry.io/docs/specs/semconv/gen-ai/) being developed in OpenTelemetry.\n\nFor details, see the Cloud Trace documentation on\n[Traces and spans](/trace/docs/traces-and-spans) and\n[Trace context](/trace/docs/trace-context).\n\nWrite traces for an agent\n\nTo write traces for an agent: \n\nADK\n\nTo enable tracing for `AdkApp`, specify `enable_tracing=True` when you\n[develop an Agent Development Kit agent](/vertex-ai/generative-ai/docs/agent-engine/develop/adk).\nFor example: \n\n from vertexai.preview.reasoning_engines import AdkApp\n from google.adk.agents import Agent\n\n agent = Agent(\n model=model,\n name=agent_name,\n tools=[get_exchange_rate],\n )\n\n app = AdkApp(\n agent=agent, # Required.\n enable_tracing=True, # Optional.\n )\n\nLangchainAgent\n\nTo enable tracing for `LangchainAgent`, specify `enable_tracing=True` when you\n[develop a LangChain agent](/vertex-ai/generative-ai/docs/agent-engine/develop/langchain).\nFor example: \n\n from vertexai.preview.reasoning_engines import LangchainAgent\n\n agent = LangchainAgent(\n model=model, # Required.\n tools=[get_exchange_rate], # Optional.\n enable_tracing=True, # [New] Optional.\n )\n\nLanggraphAgent\n\nTo enable tracing for `LanggraphAgent`, specify `enable_tracing=True` when you\n[develop a LangGraph agent](/vertex-ai/generative-ai/docs/agent-engine/develop/langgraph).\nFor example: \n\n from vertexai.preview.reasoning_engines import LanggraphAgent\n\n agent = LanggraphAgent(\n model=model, # Required.\n tools=[get_exchange_rate], # Optional.\n enable_tracing=True, # [New] Optional.\n )\n\nLlamaIndex\n\n\n| **Preview**\n|\n|\n| This feature is subject to the \"Pre-GA Offerings Terms\" in the General Service Terms section\n| of the [Service Specific Terms](/terms/service-terms#1).\n|\n| Pre-GA features are available \"as is\" and might have limited support.\n|\n| For more information, see the\n| [launch stage descriptions](/products#product-launch-stages).\n\n\u003cbr /\u003e\n\nTo enable tracing for `LlamaIndexQueryPipelineAgent`, specify `enable_tracing=True` when you\n[develop a LlamaIndex agent](/vertex-ai/generative-ai/docs/agent-engine/develop/llama-index/query-pipeline).\nFor example: \n\n from vertexai.preview import reasoning_engines\n\n def runnable_with_tools_builder(model, runnable_kwargs=None, **kwargs):\n from llama_index.core.query_pipeline import QueryPipeline\n from llama_index.core.tools import FunctionTool\n from llama_index.core.agent import ReActAgent\n\n llama_index_tools = []\n for tool in runnable_kwargs.get(\"tools\"):\n llama_index_tools.append(FunctionTool.from_defaults(tool))\n agent = ReActAgent.from_tools(llama_index_tools, llm=model, verbose=True)\n return QueryPipeline(modules = {\"agent\": agent})\n\n agent = reasoning_engines.LlamaIndexQueryPipelineAgent(\n model=\"gemini-2.0-flash\",\n runnable_kwargs={\"tools\": [get_exchange_rate]},\n runnable_builder=runnable_with_tools_builder,\n enable_tracing=True, # Optional\n )\n\nCustom\n\nTo enable tracing for [custom agents](/vertex-ai/generative-ai/docs/agent-engine/develop/custom),\nvisit [Tracing using OpenTelemetry](/vertex-ai/generative-ai/docs/agent-engine/develop/custom#tracing)\nfor details.\n\nThis will export traces to Cloud Trace under the project in\n[Set up your Google Cloud project](/vertex-ai/generative-ai/docs/agent-engine/set-up#project).\n\nView traces for an agent\n\nYou can view your traces using the [Trace Explorer](/trace/docs/finding-traces):\n\n1. To get the permissions to view trace data in the Google Cloud console or\n select a trace scope, ask your administrator to grant you the\n [Cloud Trace User](/iam/docs/understanding-roles#cloudtrace.user)\n (`roles/cloudtrace.user`) IAM role on your project.\n\n2. Go to **Trace Explorer** in the Google Cloud console:\n\n [Go to the Trace Explorer](https://console.cloud.google.com/traces/list)\n3. Select your Google Cloud project (corresponding to \u003cvar translate=\"no\"\u003ePROJECT_ID\u003c/var\u003e)\n at the top of the page.\n\nTo learn more, see the [Cloud Trace documentation](/trace/docs/finding-traces).\n\nQuotas and limits\n\nSome attribute values might get truncated when they reach quota limits. For\nmore information, see [Cloud Trace Quota](/trace/docs/quotas).\n\nPricing\n\nCloud Trace has a free tier. For more information, see\n[Cloud Trace Pricing](/trace#pricing)."]]