This page shows you how to enable Cloud Trace on your agent and view traces to analyze query response times and executed operations.
A trace
is a timeline of requests as your agent responds to each query. For example, the following Gantt chart shows a sample trace from a LangchainAgent:
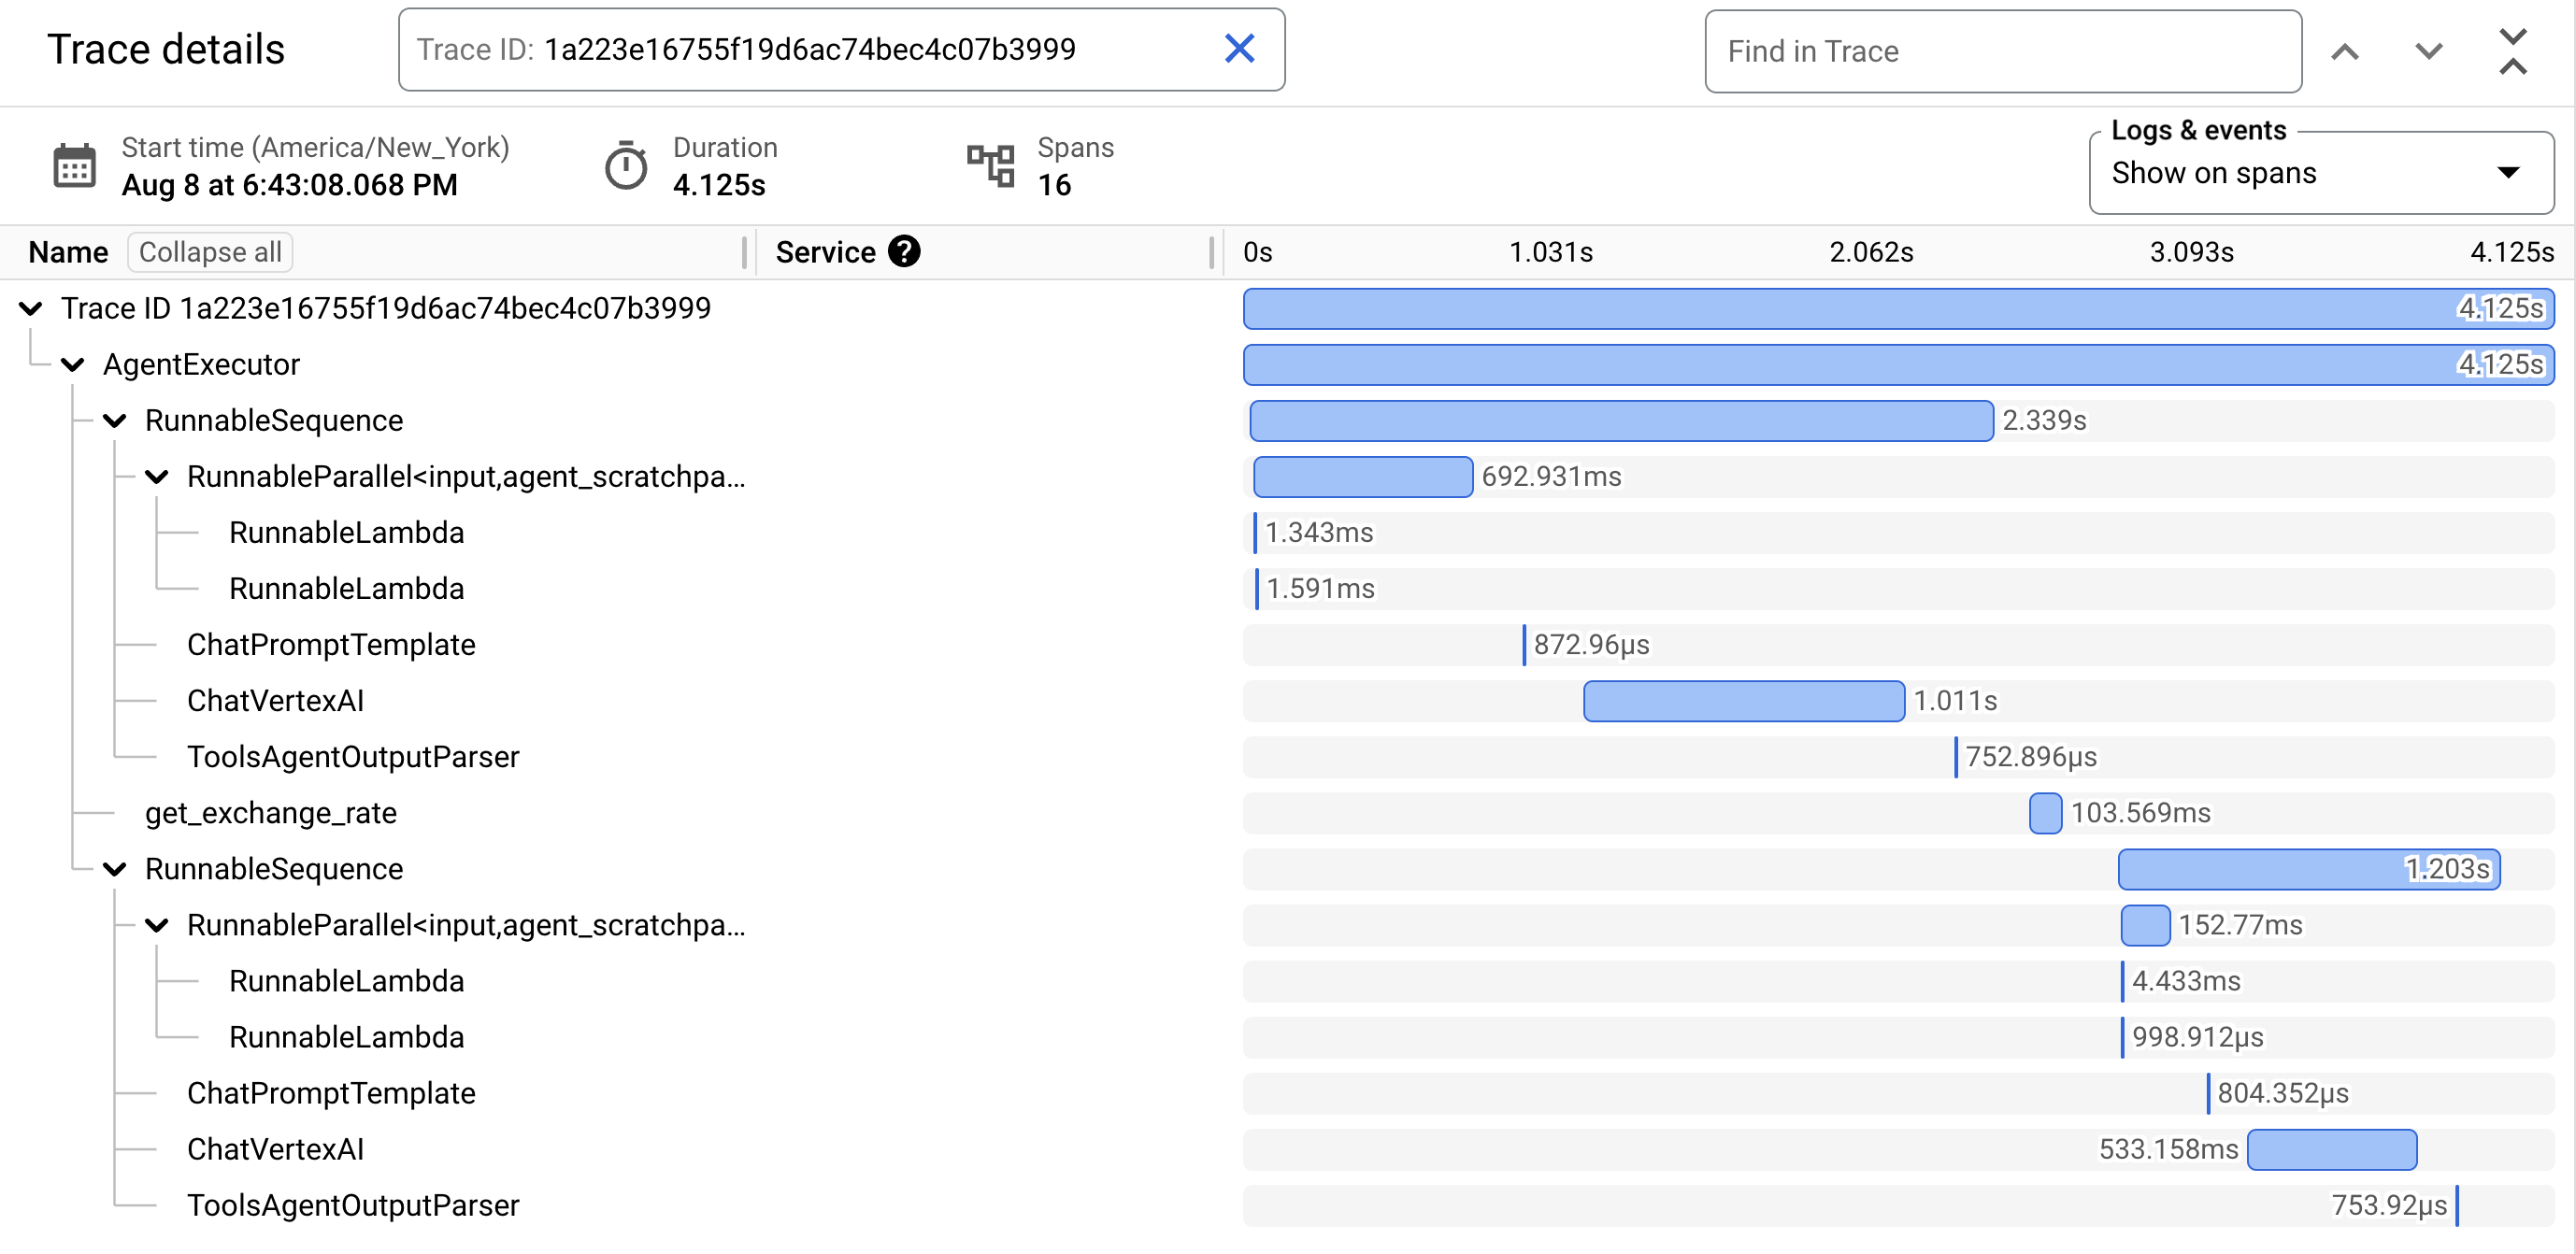
The first row in the Gantt chart is for the trace. A trace is composed of individual spans, which represent a single unit of work, like a function call or an interaction with an LLM, with the first span representing the overall request. Each span provides details about a specific operation, such as the operation's name, start and end times, and any relevant attributes, within the request. For example, the following JSON shows a single span that represents a call to a large language model (LLM):
  {
    "name": "llm",
    "context": {
        "trace_id": "ed7b336d-e71a-46f0-a334-5f2e87cb6cfc",
        "span_id": "ad67332a-38bd-428e-9f62-538ba2fa90d4"
    },
    "span_kind": "LLM",
    "parent_id": "f89ebb7c-10f6-4bf8-8a74-57324d2556ef",
    "start_time": "2023-09-07T12:54:47.597121-06:00",
    "end_time": "2023-09-07T12:54:49.321811-06:00",
    "status_code": "OK",
    "status_message": "",
    "attributes": {
        "llm.input_messages": [
            {
                "message.role": "system",
                "message.content": "You are an expert Q&A system that is trusted around the world.\nAlways answer the query using the provided context information, and not prior knowledge.\nSome rules to follow:\n1. Never directly reference the given context in your answer.\n2. Avoid statements like 'Based on the context, ...' or 'The context information ...' or anything along those lines."
            },
            {
                "message.role": "user",
                "message.content": "Hello?"
            }
        ],
        "output.value": "assistant: Yes I am here",
        "output.mime_type": "text/plain"
    },
    "events": [],
  }
For details, see the Cloud Trace documentation on Traces and spans and Trace context.
Write traces for an agent
To write traces for an agent:
ADK
To enable tracing for AdkApp, specify enable_tracing=True when you
develop an Agent Development Kit agent.
For example:
  from vertexai.agent_engines import AdkApp
  from google.adk.agents import Agent

  agent = Agent(
      model=model,
      name=agent_name,
      tools=[get_exchange_rate],
  )

  app = AdkApp(
      agent=agent,          # Required.
      enable_tracing=True,  # Optional.
  )
LangchainAgent
To enable tracing for LangchainAgent, specify enable_tracing=True when you
develop a LangChain agent.
For example:
from vertexai.agent_engines import LangchainAgent

agent = LangchainAgent(
    model=model,                # Required.
    tools=[get_exchange_rate],  # Optional.
    enable_tracing=True,        # [New] Optional.
)
LanggraphAgent
To enable tracing for LanggraphAgent, specify enable_tracing=True when you
develop a LangGraph agent.
For example:
from vertexai.agent_engines import LanggraphAgent

agent = LanggraphAgent(
    model=model,                # Required.
    tools=[get_exchange_rate],  # Optional.
    enable_tracing=True,        # [New] Optional.
)
LlamaIndex
To enable tracing for LlamaIndexQueryPipelineAgent, specify enable_tracing=True when you
develop a LlamaIndex agent.
For example:
from vertexai.preview import reasoning_engines

  def runnable_with_tools_builder(model, runnable_kwargs=None, **kwargs):
      from llama_index.core.query_pipeline import QueryPipeline
      from llama_index.core.tools import FunctionTool
      from llama_index.core.agent import ReActAgent

      llama_index_tools = []
      for tool in runnable_kwargs.get("tools"):
          llama_index_tools.append(FunctionTool.from_defaults(tool))
      agent = ReActAgent.from_tools(llama_index_tools, llm=model, verbose=True)
      return QueryPipeline(modules = {"agent": agent})

  agent = reasoning_engines.LlamaIndexQueryPipelineAgent(
      model="gemini-2.0-flash",
      runnable_kwargs={"tools": [get_exchange_rate]},
      runnable_builder=runnable_with_tools_builder,
      enable_tracing=True,        # Optional
  )
Custom
To enable tracing for custom agents, visit Tracing using OpenTelemetry for details.
This will export traces to Cloud Trace under the project in Set up your Google Cloud project.
View traces for an agent
You can view your traces using the Trace Explorer:
To get the permissions to view trace data in the Google Cloud console or select a trace scope, ask your administrator to grant you the Cloud Trace User (
roles/cloudtrace.user) IAM role on your project.Go to Trace Explorer in the Google Cloud console:
Select your Google Cloud project (corresponding to
PROJECT_ID) at the top of the page.
To learn more, see the Cloud Trace documentation.
Quotas and limits
Some attribute values might get truncated when they reach quota limits. For more information, see Cloud Trace Quota.
Pricing
Cloud Trace has a free tier. For more information, see Cloud Trace Pricing.