This document explains how to monitor the behavior, health, and performance of your fully-managed models in Vertex AI. It describes how to use the prebuilt model observability dashboard to gain insights into model usage, identify latency issues, and troubleshoot errors.
You learn how to do the following:
- Access and interpret the model observability dashboard.
- View available monitoring metrics.
- Monitor model endpoint traffic using Metrics Explorer.
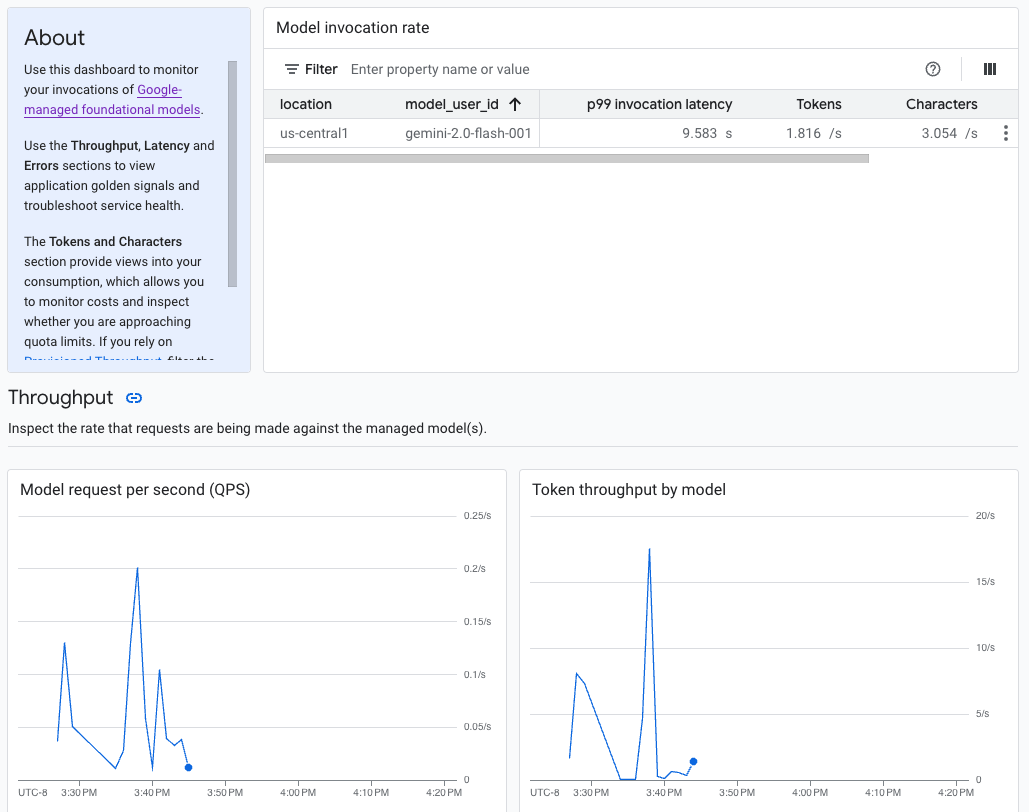
Access and interpret the model observability dashboard
Generative AI on Vertex AI provides a prebuilt model observability dashboard to view the behavior, health, and performance of fully-managed models. Fully-managed models, also known as Model as a Service (MaaS), are provided by Google and include Google's Gemini models and partner models with managed endpoints. Metrics from self-hosted models aren't included in the dashboard.
Generative AI on Vertex AI automatically collects and reports activity from MaaS models to help you quickly troubleshoot latency issues and monitor capacity.
Use case
As an application developer, you can view how your users are interacting with the models that you've exposed. For example, you can view how model usage (model requests per second) and the compute intensity of user prompts (model invocation latencies) are trending over time. Consequently, because these metrics are related to model usage, you can also estimate costs for running each model.
When an issue arises, you can quickly troubleshoot from the dashboard. You can check if models are responding reliably and in a timely manner by viewing API error rates, first token latencies, and token throughput.
Available monitoring metrics
The model observability dashboard displays a subset of metrics that are collected by Cloud Monitoring, such as model request per second (QPS), token throughput, and first token latencies. View the dashboard to see all the available metrics.
Limitations
Vertex AI captures dashboard metrics only for API calls to a model's endpoint. Google Cloud console usage, such as metrics from Vertex AI Studio, aren't added to the dashboard.
View the dashboard
- In the Vertex AI section of the Google Cloud console, go to the Dashboard page.
Go to Vertex AI 1. In the dashboard, under Model observability, click Show all metrics to view the model observability dashboard in the Google Cloud Observability console.
To view metrics for a specific model or in a particular location, set one or more filters at the top of the dashboard page.
For descriptions of each metric, see the "
aiplatform" section on the Google Cloud metrics page.
Monitor model endpoint traffic
Use the following instructions to monitor traffic to your endpoint in the Metrics Explorer.
In the Google Cloud console, go to the Metrics Explorer page.
Select the project you want to view metrics for.
From the Metric drop-down menu, click Select a metric.
In the Filter by resource or metric name search bar, enter
Vertex AI Endpoint.Select the Vertex AI Endpoint > Prediction metric category. Under Active metrics, select any of the following metrics:
prediction/online/error_countprediction/online/prediction_countprediction/online/prediction_latenciesprediction/online/response_count
Click Apply. To add more than one metric, click Add query.
You can filter or aggregate your metrics using the following drop-down menus:
To select and view a subset of your data based on specified criteria, use the Filter drop-down menu. For example, to filter for the model
gemini-2.0-flash-001, useendpoint_id = gemini-2p0-flash-001(note that the.in the model version is replaced with ap).To combine multiple data points into a single value and see a summarized view of your metrics, use the Aggregation drop-down menu. For example, you can aggregate the Sum of
response_code.
Optionally, you can set up alerts for your endpoint. For more information, see Manage alerting policies.
To view the metrics you add to your project using a dashboard, see Dashboards overview.
What's next
- To learn how to create alerts for your dashboard, see Alerting overview.
- To learn about metrics data retention, see the Monitoring quotas and limits.
- To learn about data at rest, see Protecting data at rest.
- To view a list of all metrics that Cloud Monitoring collects, see the
"
aiplatform" section on the Google Cloud metrics page.