This page describes how you can use the Cloud SQL System insights dashboard. The System insights dashboard displays metrics for the resources that your instance uses and helps you detect and analyze system performance problems.
You can use Gemini in Databases assistance to help you observe and troubleshoot your Cloud SQL for MySQL resources. For more information, see Observe and troubleshoot with Gemini assistance.View the System insights dashboard
To view the System insights dashboard, do the following:
-
In the Google Cloud console, go to the Cloud SQL Instances page.
- Click the name of an instance.
Select the System insights tab from the SQL navigation panel on the left.
The System insights dashboard opens.
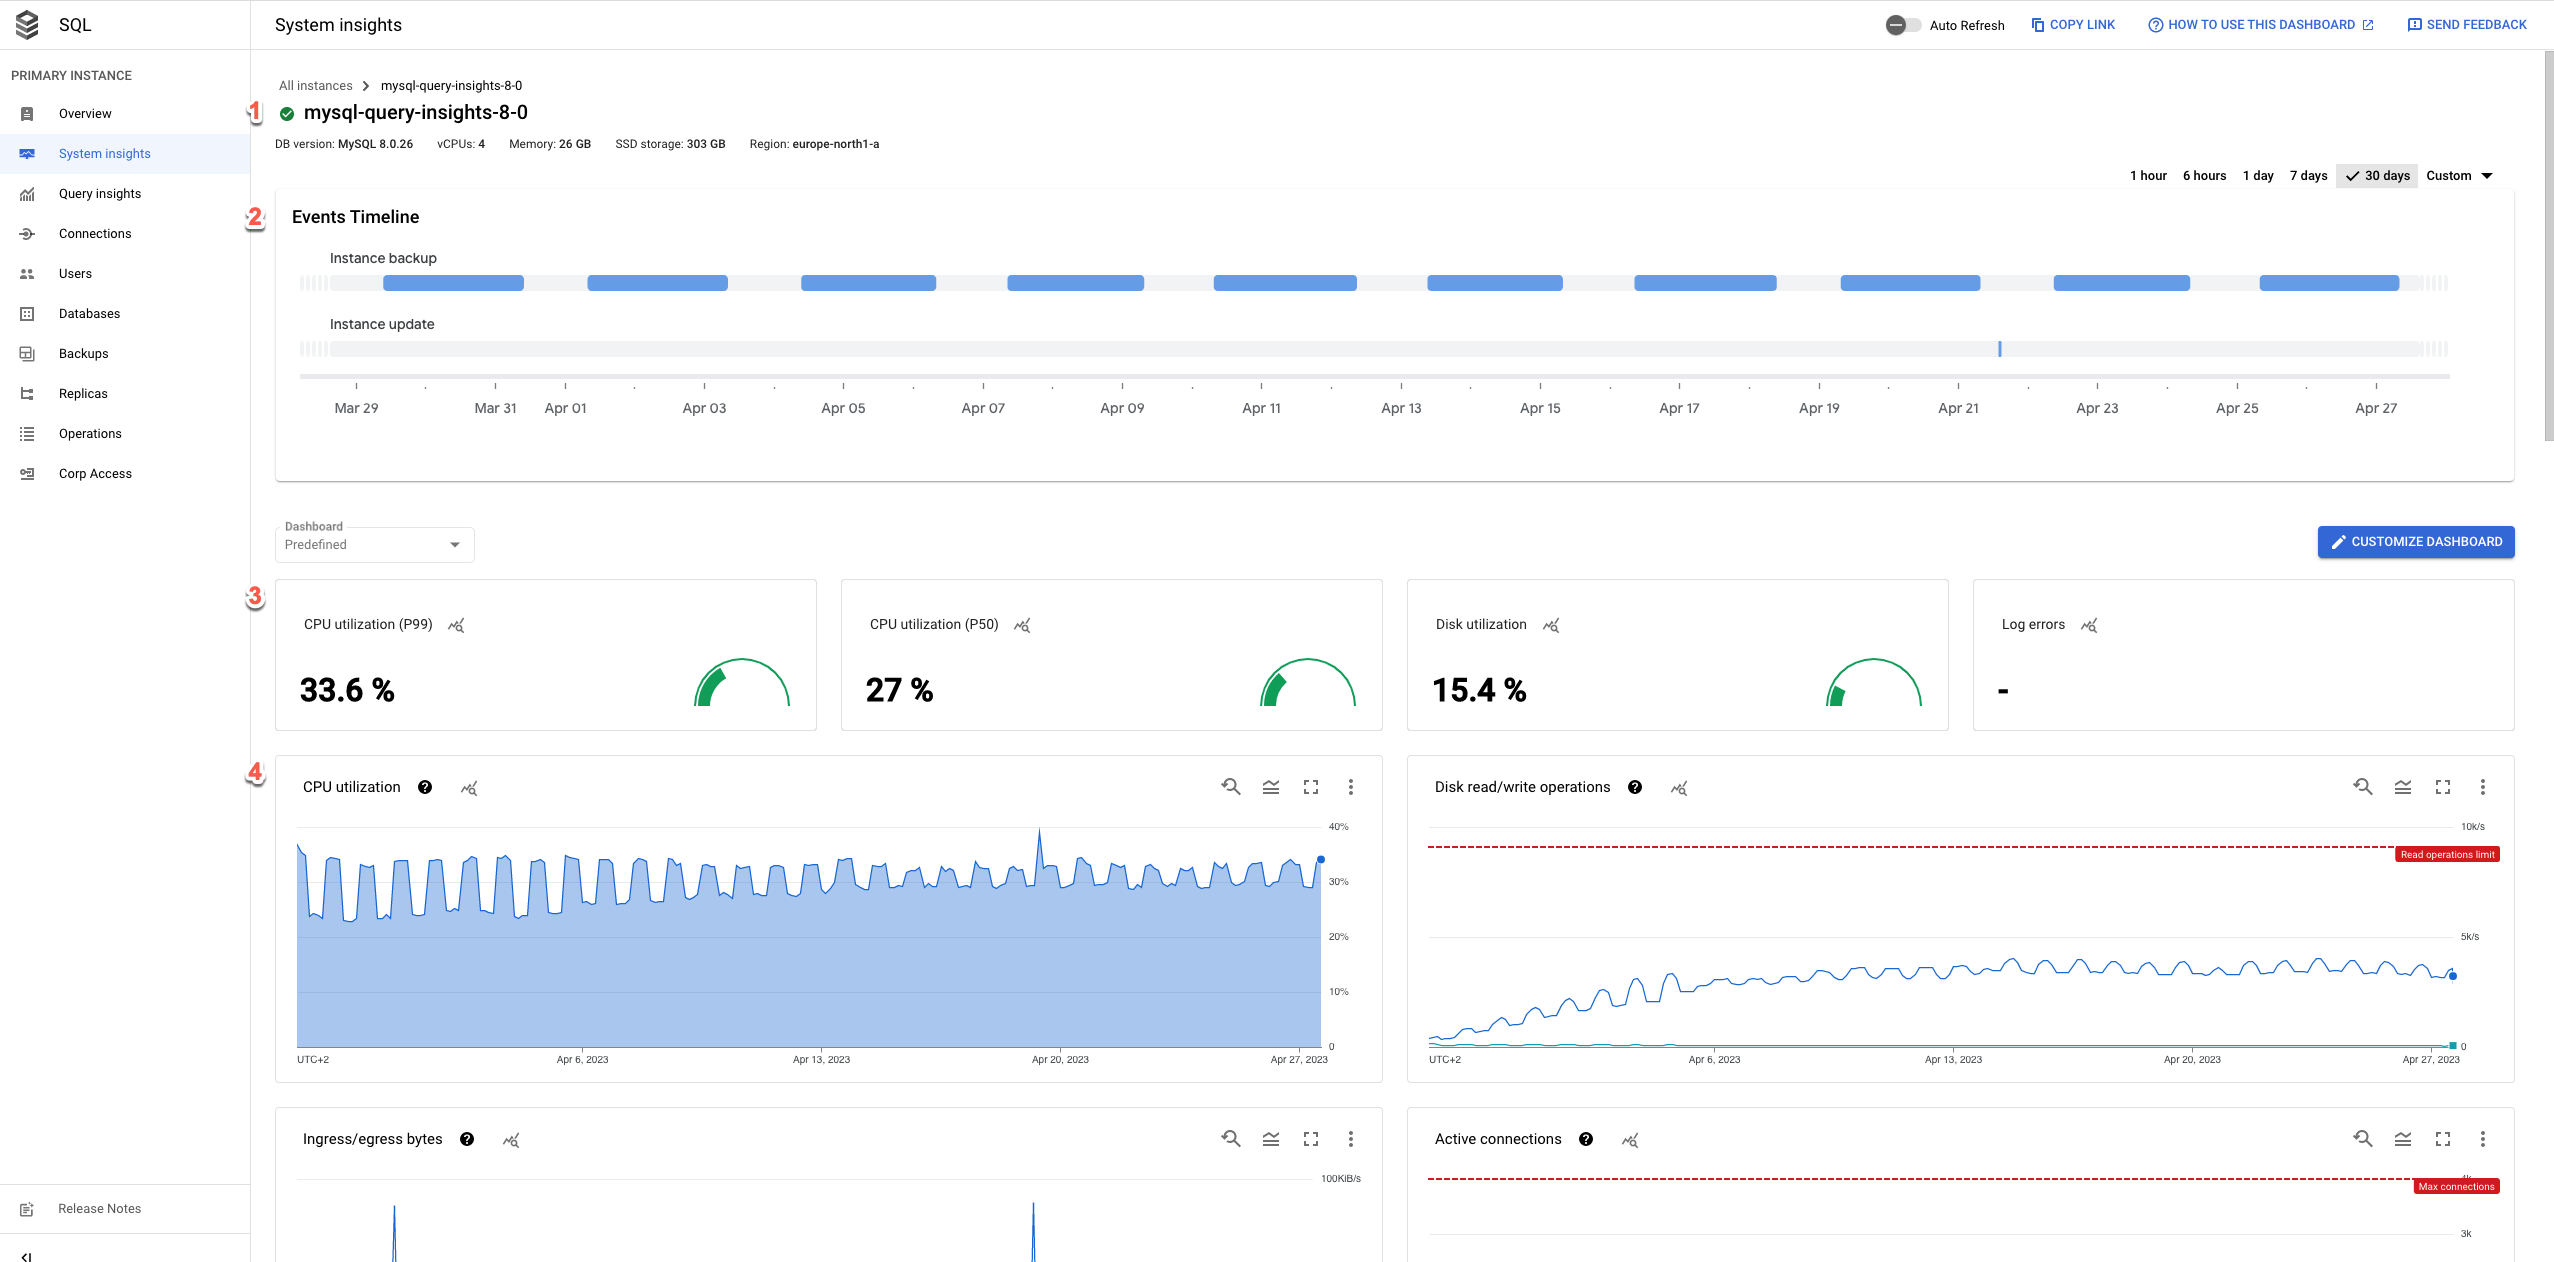
The System insights dashboard shows the following information:
Your instance details
Events timeline: shows the system events, in a chronological order. This information helps you evaluate the impact of system events on the health and performance of the instance.
Summary cards: provide an overview of the instance health and performance by displaying the latest and aggregated values for the CPU utilization, disk utilization, and log errors metrics.
Metrics charts: show the information about the operating system and database metrics that help you gain insight into several issues, such as throughput, latency, and cost.
The dashboard offers the following high-level options:
- To create a customized dashboard, click Customize dashboard.
To keep the dashboard up to date, enable the
 Auto Refresh option. When you enable Auto Refresh, the dashboard data
updates every minute. This feature isn't compatible with customized time
periods.
Auto Refresh option. When you enable Auto Refresh, the dashboard data
updates every minute. This feature isn't compatible with customized time
periods.The time selector shows
1 dayselected by default. To change the period, select one of the other predefined periods or click Custom and define a start and end time. Data is available for the last 30 days.To create an absolute link to the dashboard, click the Copy Link button. You can share this link with other Cloud SQL users who have the same permissions.
To create an alert for a specific event, click Notification.
To display specific alerts, click Annotations.
Summary cards
The following table describes the summary cards displayed at the top of the System Insights dashboard. These cards provide a brief overview of the instance's health and performance during the chosen time period.
| Summary card | Description |
|---|---|
| CPU utilization - P50 | The P50 CPU utilization values. |
| CPU utilization - P99 | The P99 CPU utilization values. |
| Disk utilization | The latest disk utilization value. |
| Log errors | The number of errors that were logged. |
Metrics charts
The toolbar on each chart card provides the following set of standard options:
To view metric values for a specific moment in the selected period, move the cursor over the chart.
To zoom in on a chart, click the chart and drag horizontally along the x-axis or vertically along the y-axis. To revert the zoom operation, click Reset zoom. Or, click one of the predefined time periods at the top of the dashboard. Zoom operations apply at the same time to all charts on a dashboard.
To view additional options, click more_vert More chart options. Most charts offer these options:
To view a chart in full-screen mode, click View in full screen. To exit full-screen mode, click Cancel.
Hide or collapse the legend.
Download a PNG or CSV file of the chart.
View in Metrics Explorer. View the metric in Metrics Explorer. You can view other Cloud SQL metrics in the Metrics Explorer after selecting the Cloud SQL Database resource type.
To create a custom dashboard, click edit Customize dashboard and give it a name. Or, expand the Predefined menu and select an existing custom dashboard.
To view a metric chart's data in detail, click query_stats Explore data. Here, you can filter specific metrics and choose how the chart displays:

To save this customized view as a metric chart, click Save to dashboard.
Default metrics
The following table describes the Cloud SQL metrics that appear by default on the Cloud SQL System insights dashboard.
| Metric name and type | Description |
|---|---|
Query latencydbinsights.googleapis.com/ |
The aggregated query latency distribution by P99, P95, and P50 per user and database. Only available for instances with query insights enabled. |
Database load per database/user/client addressdbinsights.googleapis.com/ |
The accumulated query execution time per database, user, or client address. This is the sum of CPU time, I/O wait time, lock wait time, process context switch, and scheduling for all processes involved in query execution. Only available for instances with query insights enabled. |
CPU utilizationcloudsql.googleapis.com/ |
The current CPU utilization represented as a percentage of the reserved CPU that's currently in use. |
MySQL connectionscloudsql.googleapis.com/ |
The number of connections held by the database instance. |
Ingress/egress bytescloudsql.googleapis.com/cloudsql.googleapis.com/ |
The network traffic in terms of the number of ingress bytes (bytes received) and egress bytes (bytes sent) to and from the instance, respectively. |
| Memory components
|
The memory components available to the database as usage, cache, and free memory. The value for each memory component is calculated as the percentage of the total memory available to the database. |
MySQL queriescloudsql.googleapis.com/
|
The number of statements executed by the server. This includes statements executed within stored programs, such as stored procedures and functions. |
MySQL questionscloudsql.googleapis.com/
|
The number of statements executed by the server. This includes only the statements sent to the server by the clients and not the statements executed within stored programs. |
MySQL network trafficcloudsql.googleapis.com/cloudsql.googleapis.com/
|
The number of bytes received from and sent to the clients. |
InnoDB pages
|
The number of dirty, free, and total pages in the InnoDB buffer pool. A dirty page in the InnoDB buffer pool is a page that's modified in the memory but isn't written back to the disk. A free page in InnoDB buffer pool is a page that doesn't contain any data and is unused. |
| InnoDB fsync calls
|
The number of InnoDB fsync operations. |
| InnoDB log fsync calls
|
The number of fsync operations performed on the InnoDB redo log files. |
InnoDB pages read/writtencloudsql.googleapis.com/cloudsql.googleapis.com/
|
The number of InnoDB pages read and written. |
MySQL table open cachecloudsql.googleapis.com/cloudsql.googleapis.com/
|
open_tables is the number of tables currently open. opened_table_count is the number of tables that the database has opened since the last sample.If the value of opened_table_count is consistently high, we recommend that you
increase the value of table_open_cache.
|
MySQL table definition cachecloudsql.googleapis.com/database/cloudsql.googleapis.com/database/
|
open_table_definitions is the number of table definitions that are currently open.
opened_table_definitions_count is the number of times the database has opened
a table definition since the last sample. If the value of opened_table_definitions_count
is consistently high, we recommend that you increase the value of table_definition_cache.
|
| InnoDB data dictionary memory usage
|
Memory usage for the InnoDB data dictionary cache. InnoDB has its own cache for
storing information about database objects such as tables, columns, indexes, and foreign keys.
table_definition_cache sets a soft limit on the number of tables
in this cache. However, tables with foreign key relationships are kept in cache
until the database shuts down or restarts. This cache can consume a significant amount of memory
if your instance has many tables with foreign key relationships.
|
Disk storage by typecloudsql.googleapis.com/
|
The breakdown of instance disk usage by data types, such as data, binlog, and tmp_data.
This metric helps you understand your storage costs. For more information about
storage usage charges, see
Storage and networking pricing.Point-in-time recovery (PITR) uses binary logs. Cloud SQL generates new logs regularly and these logs use storage space. Cloud SQL automatically deletes the binary logs and their associated automatic backups. This generally happens after the retention value set for transactionLogRetentionDays is met.
transactionLogRetentionDays is the number of days for which
Cloud SQL retains the transaction logs. Its value ranges from 1 to 7.To avoid unexpected storage issues while using PITR, we recommend that you enable automatic storage increases. |
Disk read/write opscloudsql.googleapis.com/cloudsql.googleapis.com/
|
read_ops_count indicates the delta count of disk read I/O operations.
You can use this metric to
understand whether your instance is correctly sized for your environment.
If required, you can switch to a larger machine type to serve more
requests from cache and reduce latency.write_ops_count indicates the
delta count of disk write I/O operations. Cloud SQL instances, barring replicas, write to a system
table, approximately, every second.
|
Cloud Logginglogging.googleapis.com/
|
Shows the total number of log entries for errors and warnings. |
For more information, see Cloud SQL metrics.
Events timeline
The dashboard provides the details of the following events:
| Event name | Description | Operation type |
|---|---|---|
Instance restart |
Restarts the Cloud SQL instance | RESTART |
Instance failover |
Initiates a manual failover of a high availability (HA) primary instance to a standby instance, which becomes the primary instance. | FAILOVER |
Instance maintenance |
Indicates that the instance is currently in maintenance. Maintenance typically causes the instance to be unavailable for 1 to 3 minutes. | MAINTENANCE |
Instance backup |
Performs an instance backup. | BACKUP_VOLUME |
Instance update |
Updates the settings of a Cloud SQL instance. | UPDATE |
Promote replica |
Promotes a Cloud SQL replica instance. | PROMOTE_REPLICA |
Start replica |
Starts replication on a Cloud SQL read replica instance. | START_REPLICA |
Stop replica |
Stops replication on a Cloud SQL read replica instance. | STOP_REPLICA |
Recreate replica |
Recreates resources for a Cloud SQL replica instance. | RECREATE_REPLICA |
Create replica |
Creates a Cloud SQL replica instance. | CREATE_REPLICA |
Data import |
Imports data into a Cloud SQL instance. | IMPORT |
Instance export |
Exports data from a Cloud SQL instance to a Cloud Storage bucket. | EXPORT |
Restore backup |
Restores a backup of a Cloud SQL instance. This operation might cause your instance to restart. | RESTORE_VOLUME |