Observe hierarchical workloads
Hierarchy Controller gives you better observability into your workloads by using both the hierarchical and abstract namespaces in your cluster. It achieves this by propagating your cluster's tree labels to your Pods, making them available to any system that can ingest Kubernetes labels, including:
- Native Kubernetes queries for Pods
- Cloud Logging
- GKE usage metering
For example, consider a workload running in a namespace from the namespace inheritance example repository. The namespace inheritance example repository has the following architecture:
├── namespaces # Namespace directory
│   ├── eng # Namespace directory
│   │   ├── analytics # Abstract namespace directory
│   │   └── gamestore # Abstract namespace directory
│   ├── rnd # Namespace directory
│   │   ├── incubator-1 # Abstract namespace directory
│   │   └── incubator-2 # Abstract namespace directory
|   |── network-policy-default-deny-all.yaml
|   |── viewers-rolebinding.yaml
Hierarchy Controller lets you select Pods, logs, or usage metering generated
by any workload that is a descendant of eng, rnd, or any
other abstract namespace. This includes not only the workloads in namespaces
located in the Git repository such as gamestore, but also any
Hierarchy Controller child namespace that you might create as a descendant
of those namespaces.
Enable hierarchical observability
Hierarchical observability is provided by Hierarchy Controller. To enable hierarchical observability, do the following:
In the configuration file for the ConfigManagement Operator, in the
spec.hierarchyControllerobject, set the value ofenablePodTreeLabelstotrue:# config-management.yaml apiVersion: configmanagement.gke.io/v1 kind: ConfigManagement metadata: name: config-management spec: hierarchyController: enabled: true # Set to true to enable hierarchical observability: enablePodTreeLabels: true # ...other fields...Apply the configuration:
kubectl apply -f config-management.yamlAfter about a minute, Hierarchy Controller and hierarchical observability become usable on your cluster.
When hierarchical observability is enabled, Hierarchy Controller installs a mutating admission webhook to add the tree labels onto the Pods. To verify that this webhook is working correctly:
Start a workload in any namespace, such as the following:
kubectl run websvr --image=nginx --namespace default --generator=run-pod/v1Inspect the Pod and verify that it contains the
default.tree.hnc.x-k8s.io/depthlabel:kubectl describe pod --namespace default websvrOutput:
Name:         websvr
Namespace:    default
# ...other fields...
Labels:       default.tree.hnc.x-k8s.io/depth=0 # This is the Pod tree label
              # ...other labels...
# ...other fields...
Clean up the workload:
kubectl delete pod --namespace default websvr
Existing Pods do not receive the Pod tree labels; these labels are only added to new Pods. For more information, see Limitations, later in this document.
Use hierarchical workload observability
After Pod tree labels are enabled, they can be used to improve hierarchical workload observability both inside clusters and in other Google Cloud products.
Query Pods by hierarchy
Any Kubernetes operation that includes a label selector can be used to query Pod
tree labels. For example, to view all Pods in all namespaces that are running in
a descendant of the default namespace, use the following query:
kubectl get pods --all-namespaces -l default.tree.hnc.x-k8s.io/depth
Output based on the sample workload that we created to verify the installation:
NAMESPACE   NAME     READY   STATUS    RESTARTS   AGE
default     websvr   1/1     Running   0          70s
Query Cloud Logging by hierarchy
Cloud Logging supports a slightly different format for labels than
Kubernetes. For example, to search for any workload running in a descendant of
the default namespace, instead of searching for the Kubernetes label
default.tree.hnc.x-k8s.io/depth, Cloud Logging expects a
query similar to the following in
the Google Cloud console:
resource.type="k8s_container" labels.k8s-pod/default_tree_hnc_x-k8s_io/depth!=""
Alternatively, you can use a similar filter in the Google Cloud CLI:
gcloud logging read "resource.type=k8s_container AND labels.k8s-pod/default_tree_hnc_x-k8s_io/depth!=''"
Query GKE usage metering by hierarchy
You can use Pod tree labels to attribute requests and usages from GKE usage metering to namespace trees. To enable hierarchical usage metering:
Enable regular GKE usage metering on your cluster.
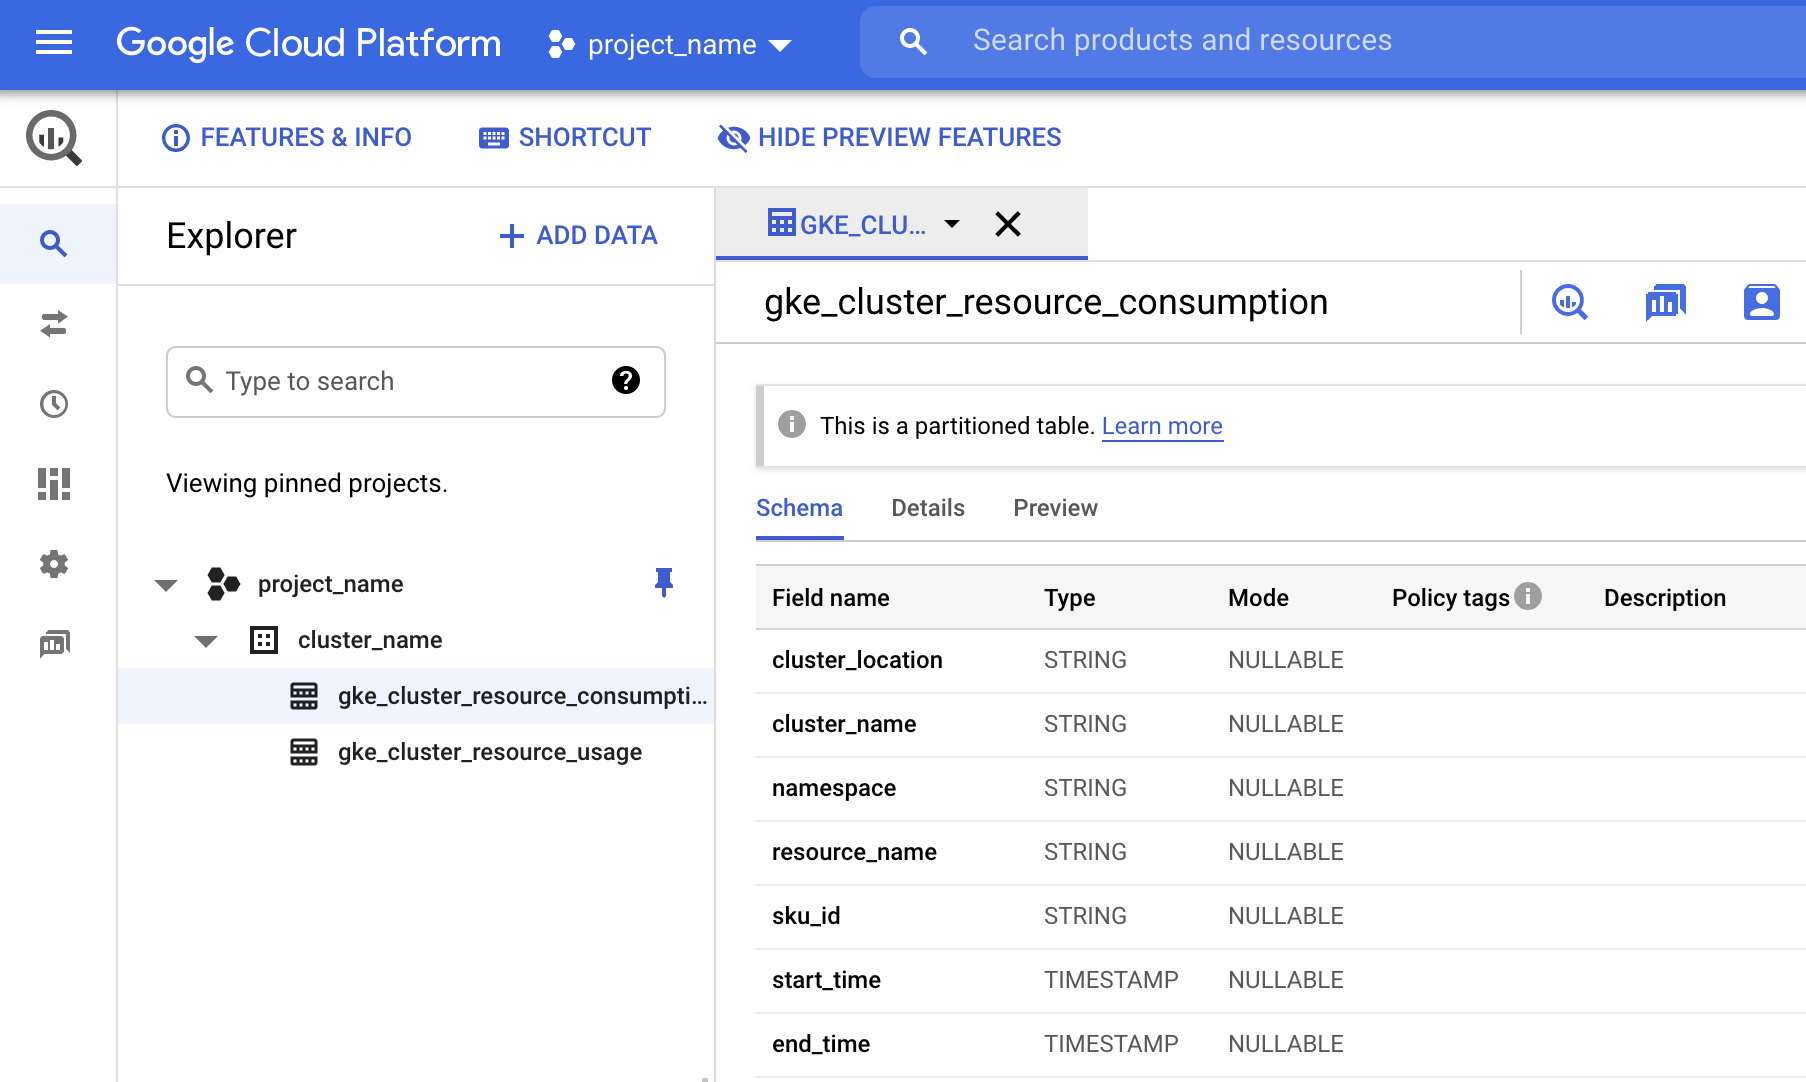
Confirm that the data is being ingested to BigQuery. In the Google Cloud console, go to BigQuery.
Look for
gke_cluster_resource_consumption.Follow the prerequisites for enabling GKE cluster usage metering section to enable visualization for GKE usage metering.
Open Looker Studio, click Blank Report, and then select BigQuery as the data source.
Select Custom query and search for your project ID. In the text box on the right, enter your customized query. For examples of the custom queries, see the following sections.
Example: total usage of every subtree
This query returns the usage for every regular, abstract, and hierarchical namespace in the cluster, including all their descendants:
SELECT
  REGEXP_EXTRACT(label.key, r"^[a-zA-Z0-9\-]+") as subtree,
  resource_name,
  usage.unit,
  SUM(usage.amount) AS usage_amount
FROM
  `PROJECT_NAME.DATASET_NAME.TABLE_NAME`,
  UNNEST(labels) AS label
WHERE
  regexp_contains(label.key, "tree.hnc.x-k8s.io/depth")
GROUP BY
  subtree,
  resource_name,
  usage.unit
ORDER BY
  resource_name ASC,
  subtree ASC
Partial sample output:
| subtree | resource_name | unit | usage_amount |
|---|---|---|---|
| a | cpu | seconds | 0.09 |
| a1 | cpu | seconds | 0.09 |
| a2 | cpu | seconds | 0 |
| a | memory | byte-seconds | 6,315,303,690,240 |
| a1 | memory | byte-seconds | 1,355,268,587,520 |
| a2 | memory | byte-seconds | 4,960,035,102,720 |
In this example, the usage attributed to namespace a includes the usage of
its descendant namespaces a1 and a2, which are also shown.
Example: usage of a single subtree
This query displays the total amount of usage under namespace a and all its
descendant namespaces:
SELECT
  resource_name,
  usage.unit,
  SUM(usage.amount) AS usage_amount
FROM
  `PROJECT_NAME.DATASET_NAME.TABLE_NAME`,
  UNNEST(labels) AS label
WHERE
  label.key="SUBTREE_NAME.tree.hnc.x-k8s.io/depth"
GROUP BY
  resource_name,
  usage.unit
Sample output for namespace a:
| resource_name | unit | usage_amount |
|---|---|---|
| cpu | seconds | 0.09 |
| memory | byte-seconds | 6,315,303,690,240 |
Example: usage of all namespaces in a subtree
This query displays the individual usage of every namespace in a given subtree:
SELECT
  namespace,
  resource_name,
  SUM(usage.amount) AS usage_amount
FROM
  `PROJECT_NAME.DATASET_NAME.TABLE_NAME`,
  UNNEST(labels) AS label
WHERE
  label.key="SUBTREE_NAME.tree.hnc.x-k8s.io/depth"
GROUP BY
  namespace,
  resource_name
Sample output for namespace a:
| namespace | resource_name | usage_amount |
|---|---|---|
| a2 | memory | 4,960,035,102,720 |
| a1 | memory | 1,355,268,587,520 |
| a2 | cpu | 0 |
| a1 | cpu | 0.09 |
Namespace a itself contains no usage, so it is not listed in the results of
this query.
Limitations of hierarchical monitoring
The following are limitations of hierarchical monitoring.
Changes to the hierarchy are ignored
Pod tree labels are added to Pods when they are created and are not modified after the Pod starts running. This means that Pods that were started before hierarchical monitoring was enabled do not receive Pod tree labels.
In addition, any Pod whose hierarchy changes after the Pod was started—for example, by using Hierarchy Controller to change the parent of a namespace—does not have its labels updated. While hierarchy modifications are typically quite rare, if this situation occurs and is causing a problem, ensure that you restart all affected Pods after modifying the hierarchy.
Pods are still created even if labels cannot be applied
Hierarchical monitoring does not apply to Pods running in key system namespaces
such as kube-system or hnc-system. However, the webhook configuration itself
has no way to exclude these namespaces. Therefore, if Hierarchy Controller
encounters a problem, Pod creation in all namespaces could be impacted.
As a result, rather than risk a cluster-wide outage, if Hierarchy Controller
cannot process a Pod within two seconds, the webhook fails and allows the Pod to
be created without the labels. Such webhook failures can be monitored via the
Kubernetes API server
by looking for failures of the
podlabel.hierarchycontroller.configmanagement.gke.io mutating admission
webhook.
What's next
Learn more about common tasks that you might want to use HNC to accomplish in the HNC User Guide: How-to.