Stay organized with collections Save and categorize content based on your preferences.

Monitor Config Sync with metrics

The page describes how you can monitor your Config Sync resources using metrics. If you want an overview of the health of your Config Sync resources and installation status, use the Config Sync dashboard or View Config Sync status with the Google Cloud CLI.

When you enable the RootSync and RepoSync APIs, Config Sync uses OpenCensus to create and record metrics and OpenTelemetry to export its metrics to Prometheus and Cloud Monitoring. You can also use OpenTelemetry to export metrics to a custom monitoring system. This process provides you with three ways to monitor your resources:

  1. Cloud Monitoring
  2. Custom monitoring system
  3. Prometheus

If you don't enable the RootSync and RepoSync APIs, you can only Monitor resources with Prometheus.

Available OpenTelemetry metrics

When you have the RootSync and RepoSync APIs enabled, Config Sync and the Resource Group Controller collect the following metrics with Opencensus and make them available through OpenTelemetry collector. The Tags column lists Config Sync specific tags that are applicable to each metric. Metrics with tags represent multiple measurements, one for each combination of tag values.

Config Sync metrics

The following metrics are available from Anthos Config Management versions 1.10.1 and later.

Name Type Tags Description
api_duration_seconds Distribution operation, status The latency distribution of API server calls
apply_duration_seconds Distribution status The latency distribution of applier resource sync events
apply_operations_total Count operation, status, controller The total number of operations that have been performed to sync resources to source of truth
declared_resources Last Value reconciler The number of declared resources parsed from Git
internal_errors_total Count reconciler, source The total number of internal errors triggered by Config Sync
last_sync_timestamp Last Value reconciler The timestamp of the most recent sync from Git
parser_duration_seconds Distribution reconciler, status, trigger, source The latency distribution of the parse-apply-watch loop
pipeline_error_observed Last Value name, reconciler, component The status of RootSync and RepoSync custom resources. A value of 1 indicates a failure.
reconcile_duration_seconds Distribution status The latency distribution of reconcile events handled by the reconciler manager.
reconciler_errors Last Value reconciler, component The number of errors in the RootSync and RepoSync reconcilers
remediate_duration_seconds Distribution status The latency distribution of remediator reconciliation events
resource_conflicts_total Count reconciler The total number of resource conflicts resulting from a mismatch between the cached resources and cluster resources
resource_fights_total Count reconciler The total number of resources that are being synced too frequently. Any result higher than zero indicates a problem. For more information, see KNV2005: ResourceFightWarning.

The following metrics are available between Anthos Config Management versions 1.10.1 and 1.13.1. If you're using a version later than 1.13.1, Config Sync no longer generates these metrics and you won't be able to use them.

Name Type Tags Description
rendering_count_total Count reconciler The count of sync executions that used Kustomize or Helm chart rendering on the resources.
skip_rendering_count_total Count reconciler The count of sync executions that did not use Kustomize or Helm charts rendering on the resources.
resource_override_count_total Count reconciler, container, resource The count of resource overrides specified in resource patch
git_sync_depth_override_count_total Count - The count of Root/RepoSync objects where the spec.override.gitSyncDepth override is set. Git depth can be used to improve performance when syncing from large repos.
no_ssl_verify_count_total Count - The count of Root/RepoSync objects with .spec.git.noSSLVerify override set.

Resource Group Controller metrics

The Resource Group Controller is a component in Config Sync that keeps track of the managed resources and checks if each individual resource is ready or reconciled. The following metrics are available.

Name Type Tags Description
reconcile_duration_seconds Distribution stallreason The distribution of time taken to reconcile a ResourceGroup CR
resource_group_total Last Value The current number of ResourceGroup CRs
resource_count_total Sum The total number of resources tracked by all ResourceGroup CRs in the cluster
resource_count Last Value resourcegroup The total number of resources tracked by a ResourceGroup
ready_resource_count_total Sum The total number of resources ready across all ResourceGroup CRs in the cluster
ready_resource_count Last Value resourcegroup The total number of ready resources in a ResourceGroup
resource_ns_count Last Value resourcegorup The number of namespaces used by resources in a ResourceGroup
cluster_scoped_resource_count Last Value resourcegroup The number of cluster scoped resources in a ResourceGroup
crd_count Last Value resourcegroup The number of CRDs in a ResourceGroup
kcc_resource_count_total Sum The total number of Config Connector resources across all ResourceGroup CRs in the cluster
kcc_resource_count Gauge resourcegroup The total number of KCC resources in a ResourceGroup
pipeline_error_observed Last Value name, reconciler, component The status of RootSync and RepoSync custom resources. A value of 1 indicates a failure.

Config Sync Metric Labels

Metric labels can be used to aggregate metric data in Cloud Monitoring and Prometheus. They are selectable from the "Group By" dropdown list in the Monitoring Console.

For more information about Cloud Monitoring label and Prometheus metric label, see the Components of the metric model and Prometheus data model.

Metric Labels

The following labels are used by Config Sync and Resource Group Controller metrics.

Name Values Description
operation create, patch, update, delete The type of operation performed
status success, error The execution status of an operation
reconciler rootsync, reposync The type of the Reconciler
source parser, differ, remediator The source of the internal error
trigger retry, watchUpdate, managementConflict, resync, reimport The trigger of an reconciliation event
name The name of reconciler The name of the Reconciler
component parsing, source, sync, rendering, readiness The name of component / stage the reconciliation is currently at
container reconciler, git-sync The name of the container
resource cpu, memory The type of the resource
controller applier, remediator The name of the controller in a root or namespace reconciler

Resource Labels

Config Sync metrics sent to Prometheus and Cloud Monitoring have the following metric labels set to identify the source Pod:

Name Description
k8s.node.name The name of the Pod
k8s.pod.namespace The namespace of the Pod
k8s.pod.uid The UID of the Pod
k8s.pod.ip The IP of the Pod
k8s.node.name The name of the Node hosting the Pod
k8s.deployment.name The name of the Deployment that owns the Pod

Config Sync metrics sent to Prometheus and Cloud Monitoring from reconciler Pods also have the following metric labels set to identify the RootSync or RepoSync used to configure the reconciler:

Name Description
configsync.sync.kind The kind of resource that configures this reconciler: RootSync or RepoSync
configsync.sync.name The name of the RootSync or RepoSync that configures this reconciler
configsync.sync.namespace The namespace of the RootSync or RepoSync that configures this reconciler

Cloud Monitoring resource labels

Cloud Monitoring Resource labels are used for indexing metrics in storage, which means they have negligible effect on cardinality, unlike metric labels, where cardinality is a significant performance concern. See Monitored Resource Types for more information.

Starting from Config Sync version 1.14.0, Resource Group Controller metrics sent to Cloud Monitoring use the k8s_container resource type instead of the k8s_pod used in previous versions.

Starting from Config Sync version 1.14.1, Config Sync metrics sent to Cloud Monitoring use the k8s_container resource type instead of the k8s_pod used in previous versions.

The k8s_container resource type sets the following resource labels to identify the source Container:

Name Description
container_name The name of the Container
pod_name The name of the Pod
namespace_name The namespace of the Pod
location The region or zone of the cluster hosting the node
cluster_name The name of the cluster hosting the node
project The ID of the project hosting the cluster

Understand the pipeline_error_observed metric

The pipeline_error_observed metric is a metric that can help you quickly identify RepoSync or RootSync CRs that are not in sync or contain resources that are not reconciled to the desired state.

  • For a successful sync by a RootSync or RepoSync, the metrics with all components (rendering, source, sync, readiness) are observed with value 0.

    A screenshot of the pipeline_error_observed metric with all components observed with value 0

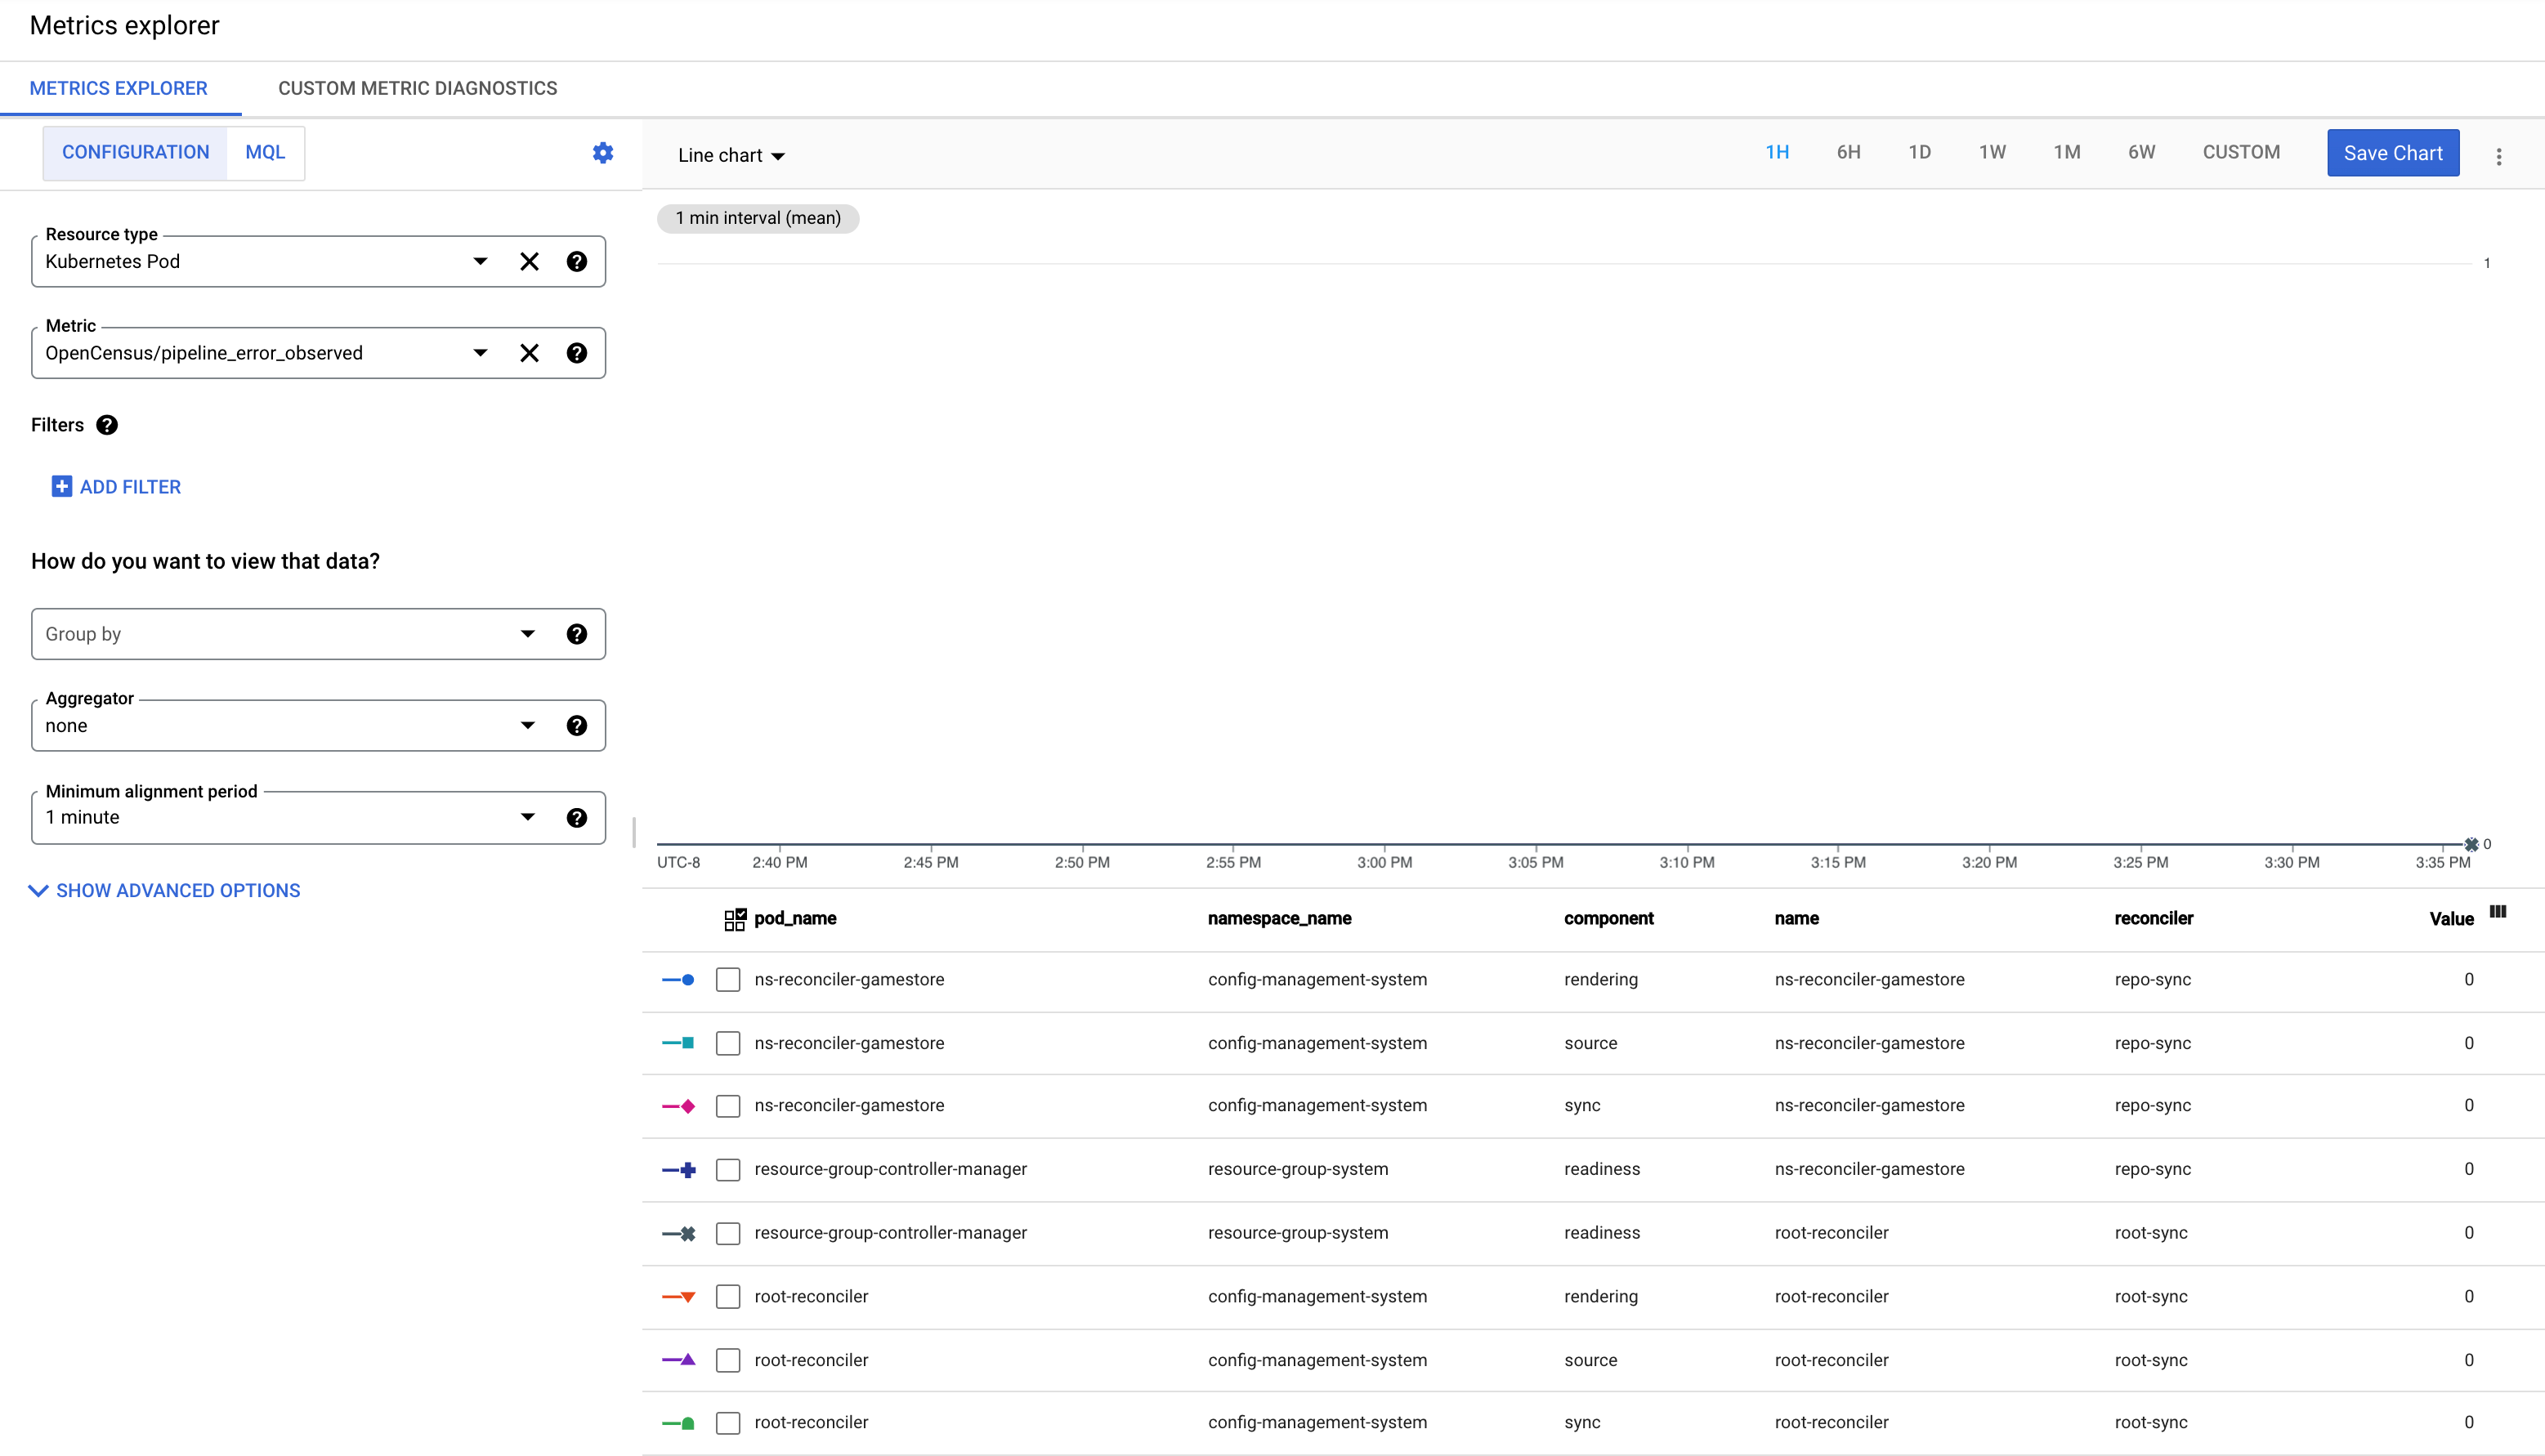
  • When the latest commit fails the automated rendering, the metric with the component rendering is observed with value 1.

  • When checking out the latest commit encounters error or the latest commit contains invalid configuration, the metric with the component source is observed with value 1.

  • When a resource fails to be applied to the cluster, the metric with the component sync is observed with value 1.

  • When a resource is applied, but fails to reach its desired state, the metric with the component readiness is observed with value 1. For example, a Deployment is applied to the cluster, but the corresponding Pods are not created successfully.

Monitor resources with Cloud Monitoring

If Config Sync is running inside a Google Cloud environment that has a default service account, Config Sync automatically exports metrics to Cloud Monitoring.

If Workload Identity is enabled, complete the following steps:

  1. Bind the Kubernetes ServiceAccount default in the namespace config-management-monitoring to a Google service account with the metric writer role:

    gcloud iam service-accounts add-iam-policy-binding \
        --role roles/iam.workloadIdentityUser \
        --member "serviceAccount:PROJECT_ID.svc.id.goog[config-management-monitoring/default]" \
        GSA_NAME@PROJECT_ID.iam.gserviceaccount.com
    

    Replace the following:

    • PROJECT_ID: your project ID
    • GSA_NAME: the Google service account with the Monitoring Metric Writer (roles/monitoring.metricWriter) IAM role. If you don't have a service account with this role, you can create one.

    This action requires iam.serviceAccounts.setIamPolicy permission on the project.

  2. Annotate the Kubernetes ServiceAccount using the email address of the Google service account:

    kubectl annotate serviceaccount \
        --namespace config-management-monitoring \
        default \
        iam.gke.io/gcp-service-account=GSA_NAME@PROJECT_ID.iam.gserviceaccount.com
    

For examples on how to view these metrics, see the following Example debugging procedures section and the OpenCensus metrics in Cloud Monitoring article.

Example debugging procedures for Cloud Monitoring

The following Cloud Monitoring examples illustrate some patterns for using OpenCensus metrics to detect and diagnose problems related to Config Sync when you are using the RootSync and RepoSync APIs.

Metric format

In Cloud Monitoring, metrics have the following format: custom.googleapis.com/opencensus/config_sync/METRIC.

This metric name is composed of the following components:

  • custom.googleapis.com: all custom metrics have this prefix
  • opencensus: this prefix is added because Config Sync uses the OpenCensus library
  • config_sync/: metrics that Config Sync exports to Cloud Monitoring have this prefix
  • METRIC: the name of the metric that you want to query

Query metrics by reconciler

RootSync and RepoSync objects are instrumented with high-level metrics that give you useful insight into how Config Sync is operating on the cluster. Almost all metrics are tagged by the reconciler name, so you can see if any errors have occurred and can set up alerts for them in Cloud Monitoring.

A reconciler is a Pod that is deployed as a Deployment. It syncs manifests from a source of truth to a cluster. When you create a RootSync object, Config Sync creates a reconciler called root-reconciler-ROOT_SYNC_NAME or root-reconciler if the name of RootSync is root-sync. When you create a RepoSync object, Config Sync creates a reconciler called ns-reconciler-NAMESPACE-REPO_SYNC_NAME-REPO_SYNC_NAME_LENGTH or ns-reconciler-NAMESPACE if the name of RepoSync is repo-sync, where NAMESPACE is the namespace you created your RepoSync object in.

The following diagram shows you how reconciler Pods function:

Reconciler flow

For example, to filter by the reconciler name when you are using Cloud Monitoring, complete the following tasks:

  1. In the Google Cloud console, go to Monitoring:

    Go to Monitoring

  2. In the Monitoring navigation pane, click Metrics explorer.

  3. In the Select a metric drop-down list, add: custom.googleapis.com/opencensus/config_sync/reconciler_errors.

  4. In the Filter dropdown list, select reconciler. A filter fields box appears.

  5. In the filter fields box, select = in the first field and the reconciler name (for example, root-reconciler) in the second.

  6. Click Apply.

You can now see metrics for your RootSync objects.

For more instructions on how to filter by a specific data type, see Filtering the data.

Query Config Sync operations by component and status

When you have enabled the RootSync and RepoSync APIs, importing and sourcing from a source of truth and syncing to a cluster is handled by the reconcilers. The reconciler_errors metric is labeled by component so you can see where any errors occurred.

For example, to filter by component when you are using Cloud Monitoring, complete the following tasks:

  1. In the Google Cloud console, go to Monitoring:

    Go to Monitoring

  2. In the Monitoring navigation pane, click Metrics explorer.

  3. In the Select a metric drop-down list, add custom.googleapis.com/opencensus/config_sync/reconciler_errors.

  4. In the Filter dropdown list, select component. A filter fields box appears.

  5. In the filter fields box, select = in the first box and source in the second.

  6. Click Apply.

You can now see errors that occurred when sourcing from a source of truth for your reconcilers.

You can also check the metrics for the source and sync processes themselves by querying the following metrics and filtering by the status tag:

custom.googleapis.com/opencensus/config_sync/parser_duration_seconds
custom.googleapis.com/opencensus/config_sync/apply_duration_seconds
custom.googleapis.com/opencensus/config_sync/remediate_duration_seconds

Configure a custom OpenTelemetry exporter

If you want to send your metrics to a different monitoring system, you can modify the OpenTelemetry configuration. For a list of supported monitoring systems, see OpenTelemetry Collector Exporters and OpenTelemetry Collector-Contrib Exporters.

OpenTelemetry monitoring resources are managed in a separate config-management-monitoring namespace. To configure a custom OpenTelemetry exporter for use with Config Sync, you need to create a ConfigMap with the name otel-collector-custom in that config-management-monitoring namespace. The ConfigMap should contain a otel-collector-config.yaml key and the value should be the file contents of the custom OpenTelemetry Collector configuration. For more information on the configuration options, see the OpenTelemetry Collector configuration documentation.

The following ConfigMap is an example of a ConfigMap with a custom logging exporter:

# otel-collector-custom-cm.yaml
apiVersion: v1
kind: ConfigMap
metadata:
  name: otel-collector-custom
  namespace: config-management-monitoring
  labels:
    app: opentelemetry
    component: otel-collector
data:
  otel-collector-config.yaml: |
    receivers:
      opencensus:
    exporters:
      logging:
        logLevel: debug
    processors:
      batch:
    extensions:
      health_check:
    service:
      extensions: [health_check]
      pipelines:
        metrics:
          receivers: [opencensus]
          processors: [batch]
          exporters: [logging]

All custom configurations must define an opencensus receiver and metrics pipeline. The rest of the fields are optional and configurable, but we recommend that you include a batch processor and health check extension like in the example.

After you have created the ConfigMap, use kubectl to create the resource:

kubectl apply -f otel-collector-custom-cm.yaml

The OpenTelemetry Collector Deployment picks up this ConfigMap and automatically restarts to apply the custom configuration.

Monitor resources with Prometheus

Config Sync uses Prometheus to collect and show metrics related to its processes.

You can also configure Cloud Monitoring to pull custom metrics from Prometheus. Then you can see custom metrics in both Prometheus and Monitoring. For more information, see Using Prometheus.

Scrape the metrics

All Prometheus metrics are available for scraping at port 8675. Before you can scrape metrics, you need to configure your cluster for Prometheus in one of two ways. Either:

  • Follow the Prometheus documentation to configure your cluster for scraping, or

  • Use the Prometheus Operator along with the following manifests, which scrape all Anthos Config Management metrics every 10 seconds.

    1. Create a temporary directory to hold the manifest files.

      mkdir acm-monitor
      cd acm-monitor
      
    2. Download the Prometheus Operator manifest from the CoreOS repository. repository, using the curl command:

      curl -o bundle.yaml https://raw.githubusercontent.com/coreos/prometheus-operator/master/bundle.yaml
      

      This manifest is configured to use the default namespace, which is not recommended. The next step modifies the configuration to use a namespace called monitoring instead. To use a different namespace, substitute it where you see monitoring in the remaining steps.

    3. Create a file to update the namespace of the ClusterRoleBinding in the bundle above.

      # patch-crb.yaml
      apiVersion: rbac.authorization.k8s.io/v1
      kind: ClusterRoleBinding
      metadata:
        name: prometheus-operator
      subjects:
      - kind: ServiceAccount
        name: prometheus-operator
        namespace: monitoring # we are patching from default namespace
      
    4. Create a kustomization.yaml file that applies the patch and modifies the namespace for other resources in the manifest.

      # kustomization.yaml
      resources:
      - bundle.yaml
      
      namespace: monitoring
      
      patchesStrategicMerge:
      - patch-crb.yaml
      
    5. Create the monitoring namespace if one does not exist. You can use a different name for the namespace, but if you do, also change the value of namespace in the YAML manifests from the previous steps.

      kubectl create namespace monitoring
      
    6. Apply the Kustomize manifest using the following commands:

      kubectl apply -k .
      
      until kubectl get customresourcedefinitions servicemonitors.monitoring.coreos.com ; \
      do date; sleep 1; echo ""; done

      The second command blocks until the CRDs are available on the cluster.

    7. Create the manifest for the resources necessary to configure a Prometheus server which scrapes metrics from Anthos Config Management.

      # acm.yaml
      apiVersion: v1
      kind: ServiceAccount
      metadata:
        name: prometheus-acm
        namespace: monitoring
      ---
      apiVersion: rbac.authorization.k8s.io/v1
      kind: ClusterRole
      metadata:
        name: prometheus-acm
      rules:
      - apiGroups: [""]
        resources:
        - nodes
        - services
        - endpoints
        - pods
        verbs: ["get", "list", "watch"]
      - apiGroups: [""]
        resources:
        - configmaps
        verbs: ["get"]
      - nonResourceURLs: ["/metrics"]
        verbs: ["get"]
      ---
      apiVersion: rbac.authorization.k8s.io/v1
      kind: ClusterRoleBinding
      metadata:
        name: prometheus-acm
      roleRef:
        apiGroup: rbac.authorization.k8s.io
        kind: ClusterRole
        name: prometheus-acm
      subjects:
      - kind: ServiceAccount
        name: prometheus-acm
        namespace: monitoring
      ---
      apiVersion: monitoring.coreos.com/v1
      kind: Prometheus
      metadata:
        name: acm
        namespace: monitoring
        labels:
          prometheus: acm
      spec:
        replicas: 2
        serviceAccountName: prometheus-acm
        serviceMonitorSelector:
          matchLabels:
            prometheus: config-management
        podMonitorSelector:
          matchLabels:
            prometheus: config-management
        alerting:
          alertmanagers:
          - namespace: default
            name: alertmanager
            port: web
        resources:
          requests:
            memory: 400Mi
      ---
      apiVersion: v1
      kind: Service
      metadata:
        name: prometheus-acm
        namespace: monitoring
        labels:
          prometheus: acm
      spec:
        type: NodePort
        ports:
        - name: web
          nodePort: 31900
          port: 9190
          protocol: TCP
          targetPort: web
        selector:
          prometheus: acm
      --- 
      apiVersion: monitoring.coreos.com/v1
      kind: ServiceMonitor
      metadata:
        name: acm-service
        namespace: monitoring
        labels:
          prometheus: config-management
      spec:
        selector:
          matchLabels:
            monitored: "true"
        namespaceSelector:
          matchNames:
          # If you are using RootSync and RepoSync APIs, change
          # config-management-system to config-management-monitoring
          - config-management-system 
        endpoints:
        - port: metrics
          interval: 10s 
      --- 
      
    8. Apply the manifest using the following commands:

      kubectl apply -f acm.yaml
      
      until kubectl rollout status statefulset/prometheus-acm -n monitoring; \
      do sleep 1; done
      

      The second command blocks until the Pods are running.

    9. You can verify the installation by forwarding the web port of the Prometheus server to your local machine.

      kubectl -n monitoring port-forward svc/prometheus-acm 9190
      

      You can now access the Prometheus web UI at http://localhost:9190.

    10. Remove the temporary directory.

      cd ..
      rm -rf acm-monitor
      

Available Prometheus metrics

Config Sync collects the following metrics and makes them available to Prometheus. The Labels column lists all labels that are applicable to each metric. Metrics without labels represent a single measurement over time while metrics with labels represent multiple measurements, one for each combination of label values.

If this table becomes out of sync, you can filter metrics by prefix in the Prometheus user interface, and all of the metrics start with the prefix gkeconfig_.

Name Type Labels Description
gkeconfig_importer_cycle_duration_seconds_bucket Histogram status Number of cycles that the importer has attempted to import configs to the cluster (distributed into buckets by duration of each cycle)
gkeconfig_importer_cycle_duration_seconds_count Histogram status Number of cycles that the importer has attempted to import configs to the cluster (ignoring duration)
gkeconfig_importer_cycle_duration_seconds_sum Histogram status Sum of the durations of all cycles that the importer has attempted to import configs to the cluster
gkeconfig_importer_namespace_configs Gauge Number of namespace configs in current state
gkeconfig_monitor_errors Gauge component Number of errors in the config repo grouped by the component where they occurred
gkeconfig_monitor_configs Gauge state Number of configs (cluster and namespace) grouped by their sync status
gkeconfig_monitor_last_import_timestamp Gauge Timestamp of the most recent import
gkeconfig_monitor_last_sync_timestamp Gauge Timestamp of the most recent sync
gkeconfig_monitor_sync_latency_seconds_bucket Histogram Number of import-to-sync measurements taken (distributed into buckets by latency between the two)
gkeconfig_monitor_sync_latency_seconds_count Histogram Number of import-to-sync measurements taken (ignoring latency between the two)
gkeconfig_monitor_sync_latency_seconds_sum Histogram Sum of the latencies of all import-to-sync measurements taken
gkeconfig_syncer_api_duration_seconds_bucket Histogram operation, type, status Number of calls made by the syncer to the API server (distributed into buckets by duration of each call)
gkeconfig_syncer_api_duration_seconds_count Histogram operation, type, status Number of calls made by the importer to the API server (ignoring duration)
gkeconfig_syncer_api_duration_seconds_sum Histogram operation, type, status Sum of the durations of all calls made by the syncer to the API server
gkeconfig_syncer_controller_restarts_total Counter source Total number of restarts for the namespace and cluster config controllers
gkeconfig_syncer_operations_total Counter operation, type, status Total number of operations that have been performed to sync resources to configs
gkeconfig_syncer_reconcile_duration_seconds_bucket Histogram type, status Number of reconcile events processed by the syncer (distributed into buckets by duration)
gkeconfig_syncer_reconcile_duration_seconds_count Histogram type, status Number of reconcile events processed by the syncer (ignoring duration)
gkeconfig_syncer_reconcile_duration_seconds_sum Histogram type, status Sum of the durations of all reconcile events processed by the syncer
gkeconfig_syncer_reconcile_event_timestamps Gauge type Timestamps when syncer reconcile events occurred

Example debugging procedures for Prometheus

The following examples illustrate some patterns for using Prometheus metrics, object status fields, and object annotations to detect and diagnose problems related to Config Sync. These examples show how you can start with high level monitoring that detects a problem and then progressively refine your search to drill down and diagnose the root cause of the problem.

Query configs by status

The monitor process provides high-level metrics that give useful insight into an overall view of how Config Sync is operating on the cluster. You can see if any errors have occurred, and can even set up alerts for them.

gkeconfig_monitor_errors

Query metrics by reconciler

If you are using Config Sync RootSync and RepoSync APIs, then you can monitor the RootSync and RepoSync objects. The RootSync and RepoSync objects are instrumented with high-level metrics that give you useful insight into how Config Sync is operating on the cluster. Almost all metrics are tagged by the reconciler name, so you can see if any errors have occurred and can set up alerts for them in Prometheus.

A reconciler is a Pod that syncs manifests from a source of truth to a cluster. When you create a RootSync object, Config Sync creates a reconciler called root-reconciler. When you create a RepoSync object, Config Sync creates a reconciler called ns-reconciler-NAMESPACE, where NAMESPACE is the namespace you created your RepoSync object in.

In Prometheus, you can use the following filters for the reconcilers:

# Querying Root reconciler
config_sync_reconciler_errors{root_reconciler="root-reconciler"}

# Querying Namespace reconciler for a namespace called retail
config_sync_reconciler_errors{ns_reconciler_retail="ns-reconciler-retail"}

Use nomos status to display errors

In addition to using Prometheus metrics to monitor the status of Config Sync on your clusters, you can use the nomos status command which prints errors from all of your clusters on the command line.

Query import and sync operations by status

Config Sync uses a two-step process to apply configs from the repo to a cluster. The gkeconfig_monitor_errors metric is labeled by component so you can see where any errors occurred.

gkeconfig_monitor_errors{component="importer"}
gkeconfig_monitor_errors{component="syncer"}

You can also check the metrics for the importer and syncer processes themselves.

gkeconfig_importer_cycle_duration_seconds_count{status="error"}
gkeconfig_syncer_reconcile_duration_seconds_count{status="error"}

When you have enabled the RootSync and RepoSync APIs, importing and sourcing from a Git repository and syncing to a cluster is handled by the reconcilers. The reconciler_errors metric is labeled by component so you can see where any errors occurred.

In Prometheus, you could use the following queries:

# Check for errors that occurred when sourcing configs.
config_sync_reconciler_errors{component="source"}

# Check for errors that occurred when syncing configs to the cluster.
config_sync_reconciler_errors{component="sync"}

You can also check the metrics for the source and sync processes themselves:

config_sync_parse_duration_seconds{status="error"}
config_sync_apply_duration_seconds{status="error"}
config_sync_remediate_duration_seconds{status="error"}

Check a config's object status

Config Sync defines two custom Kubernetes objects: ClusterConfig and NamespaceConfig. These objects define a status field which contains information about the change that was last applied to the config and any errors that occurred. For instance, if there is an error in a namespace called shipping-dev, you can check the status of the corresponding NamespaceConfig.

kubectl get namespaceconfig shipping-dev -o yaml

Check an object's token annotation

You may want to know when a managed Kubernetes object was last updated by Config Sync. Each managed object is annotated with the hash of the Git commit when it was last modified, as well as the path to the config that contained the modification.

kubectl get clusterrolebinding namespace-readers
apiVersion: rbac.authorization.k8s.io/v1
kind: ClusterRoleBinding
metadata:
  annotations:
    configmanagement.gke.io/source-path: cluster/namespace-reader-clusterrolebinding.yaml
    configmanagement.gke.io/token: bbb6a1e2f3db692b17201da028daff0d38797771
  name: namespace-readers
...

For more information, see labels and annotations.

Monitor resources with Google Cloud Managed Service for Prometheus

Google Cloud Managed Service for Prometheus is Google Cloud's fully managed multi-cloud solution for Prometheus metrics. It supports two modes for data collection: managed data collection (the recommended mode) or self-deployed data collection. Complete the following steps to set up monitoring Config Sync with Google Cloud Managed Service for Prometheus in the managed data collection mode.

  1. Enable Managed Prometheus on your cluster by following the instructions on Set up managed collection.

  2. Save the following sample manifest as cluster-pod-monitoring-acm-monitoring.yaml. This manifest configures a ClusterPodMonitoring resource to scrape the Config Sync metrics on port 8675 of the otel-collector-* Pod under the config-management-monitoring namespace. The ClusterPodMonitoring resource uses a Kubernetes label selector to find the otel-collector-* Pod.

    apiVersion: monitoring.googleapis.com/v1
    kind: ClusterPodMonitoring
    metadata:
      name: acm-monitoring
    spec:
      selector:
        matchLabels:
          app: opentelemetry
          component: otel-collector
      endpoints:
      - port: 8675
        interval: 10s
    
  3. Apply the manifest to the cluster:

    kubectl apply -f cluster-pod-monitoring-acm-monitoring.yaml
    

  4. Verify that your Prometheus data is being exported using the Cloud Monitoring Metrics Explorer page in the Google Cloud console following the instructions on Managed Service for Prometheus data in Cloud Monitoring.

What's next