This page provides detailed instructions on how to query and visualize open
alerts using both the GDC console and the curl tool for the Cortex
endpoint to gain issue awareness and resolve problems.
After creating alert rules
based on logs and metrics from Google Distributed Cloud (GDC) air-gapped appliance environments, you
can start monitoring open alerts from your project. You can visualize and filter
alerts that your system events trigger on the GDC console or access
them directly from Cortex using the curl tool for flexible scripting and
automation.
You can access open alerts in one of the following two methods:
- GDC console: Visualize alerting data in integrated panels containing information like the number of alerts for a specific data source, the severity level, duration, status, message, and labels. The GDC console provides a user-friendly interface for filtering and analyzing alerts from your system components.
- Cortex Alertmanager endpoint: For more advanced use cases, query your
project's Cortex instance directly using the
curltool on a command line. Cortex stores your project's Alertmanager alerts and provides an HTTP endpoint for programmatic access. This access lets you export data, automate tasks, configure cron jobs, and build custom integrations.
Before you begin
To get the permissions that you need to query and visualize alerts, ask your Project IAM Admin to grant you one of the associated Project Cortex Alertmanager roles in your project namespace. Depending on the level of access and permissions you need, you might obtain editor or viewer roles for this resource in a project.
To get the permissions that you need to export logs, ask your Project IAM Admin to grant you the Project Grafana Viewer (project-grafana-viewer) role. This role-based access control process lets you access data visualizations safely. For more information about these roles, see Prepare IAM permissions.
Grafana endpoint
For Application Operator (AO):
Open the following URL to access the endpoint of your project:
https://GDC_URL/PROJECT_NAMESPACE/grafana
Replace the following:
- GDC_URL: The URL of your organization in GDC.
- PROJECT_NAMESPACE: The namespace of your project.
The project's UI contains default dashboards such as the Alerts - Overview dashboard with information about alerts. Querying alerts from the UI lets you visually retrieve alerting information from your project and get an integrated view of resources for awareness and quick resolution of problems.
For Platform Admin (PA):
Open the following URL to access the endpoint of your platform-obs project:
https://GDC_URL/platform-obs/grafana
Replace GDC_URL with the URL of your organization in GDC.
The user interface (UI) of the system monitoring instance contains default dashboards such as the Alerts - Overview dashboard with information about alerts for data observability. Querying alerts from the UI lets you visually retrieve alerting information from your project and get an integrated view of resources for awareness and quick resolution of problems.

Figure 1. The Alerts - Overview dashboard on the Grafana UI.
View and filter open alerts
Select one of the following methods to query and filter open alerts from your project namespace:
Console
View the open alerts in a project from the GDC console:
- Sign in to the GDC console.
- In the GDC console, select your project.
- In the navigation menu, select Operations > Alerting.
- Select the Alerts tab.
- View the list of alerts.
- On the Alerts opened section, click Filter to only display open alerts. You can also filter alerts by other property names or values.
- Click an alert name to view the alert details.
Cortex endpoint
This section describes how to access alerts using your Cortex Alertmanager endpoint.
Identify your Cortex endpoint
The following URL is the endpoint of the Cortex instance of your project:
https://GDC_URL/PROJECT_NAMESPACE/cortex/alertmanager/
Replace the following:
GDC_URL: the URL of your organization in GDC.PROJECT_NAMESPACE: your project namespace.For example, the Cortex endpoint for the
platform-obsproject in theorg-1organization ishttps://org-1/platform-obs/cortex/alertmanager/.
Authenticate the curl request
- Download and install the gdcloud CLI.
Set the gdcloud
core/organization_console_urlproperty:gdcloud config set core/organization_console_url https://GDC_URLSign in with the configured identity provider:
gdcloud auth loginUse your username and password to authenticate and sign in.
When the login is successful, you can use the authorization header in your cURL request through the
gdcloud auth print-identity-tokencommand. For more information, see gdcloud auth.
Call the Cortex endpoint
Complete the following steps to reach the Cortex endpoint using the curl
tool:
- Authenticate the
curlrequest. Use
curlto call the Cortex endpoint and extend the URL using the standard Alertmanager API specification (https://prometheus.io/docs/prometheus/latest/querying/api/#alertmanagers) to query alerts.The following is an example of a
curlrequest:curl https://GDC_URL/PROJECT_NAME/cortex/alertmanager/api/v1/alertmanagers \ -H "Authorization: Bearer $(gdcloud auth print-identity-token \ --audiences=https://GDC_URL)"You obtain the output following the command. The API response is in JSON format.
Alertmanager
Alertmanager lets you monitor alert notifications from client applications. You can inspect and silence alerts using Alertmanager, and filter or group alerts:
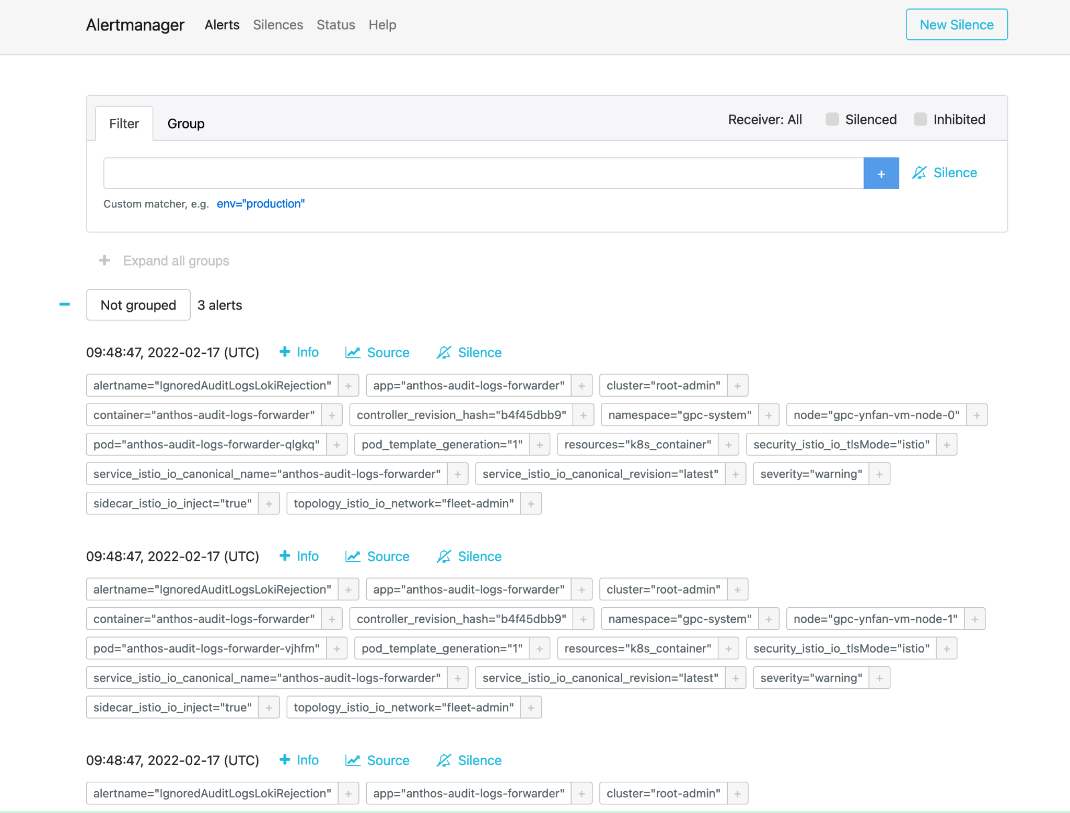
Figure 2. Menu option to query audit logs from the Alertmanager.
Predefined alerting policies
The following table lists the pre-installed alerting rules in Prometheus:
| Name | Description |
|---|---|
| KubeAPIDown (critical) | KubeAPI has disappeared from Prometheus target discovery for 15 minutes. |
| KubeClientErrors (warning) | Kubernetes API server client errors ratio > 0.01 for 15 minutes. |
| KubeClientErrors (critical) | Kubernetes API server client errors ratio > 0.1 for 15 minutes. |
| KubePodCrashLooping (warning) | Pod has been in a crash looping state for longer than 15 minutes. |
| KubePodNotReady (warning) | Pod has been in a non-ready state for longer than 15 minutes. |
| KubePersistentVolumeFillingUp (critical) | Free bytes of a claimed PersistentVolume < 0.03. |
| KubePersistentVolumeFillingUp (warning) | Free bytes of a claimed PersistentVolume < 0.15. |
| KubePersistentVolumeErrors (critical) | The persistent volume is in the Failed or Pending phase for five minutes. |
| KubeNodeNotReady (warning) | Node has been unready for more than 15 minutes. |
| KubeNodeCPUUsageHigh (critical) | Node CPU usage is > 80%. |
| KubeNodeMemoryUsageHigh (critical) | Node memory usage is > 80%. |
| NodeFilesystemSpaceFillingUp (warning) | Node file system usage is > 60%. |
| NodeFilesystemSpaceFillingUp (critical) | Node file system usage is > 85%. |
| CertManagerCertExpirySoon (warning) | A certificate is expiring in 21 days. |
| CertManagerCertNotReady (critical) | A certificate is not ready to serve traffic after 10 minutes. |
| CertManagerHittingRateLimits (critical) | A rate limit has been hit creating and renewing certificates for five minutes. |
| DeploymentNotReady (critical). | A Deployment on the org admin cluster has been in a non-ready state for longer than 15 minutes. |
Sample alertmanagerConfigurationConfigmaps
Syntax of configs in ConfigMaps that alertmanagerConfigurationConfigmaps lists must follow https://prometheus.io/docs/alerting/latest/configuration/
apiVersion: observability.gdc.goog/v1alpha1
kind: ObservabilityPipeline
metadata:
  # Choose namespace that matches the project's namespace
  namespace: kube-system
  name: observability-config
# Configure Alertmanager
 alerting:
  # Storage size for alerting data within organization
  # Permission: PA
  localStorageSize: 1Gi

  # Permission: PA & AO
  # alertmanager config must be under the key "alertmanager.yml" in the configMap
  alertmanagerConfig: <configmap-for-alertmanager-config>

  # Permission: PA
  volumes:
    - <volume referenced in volumeMounts>

  # Permission: PA
  volumeMounts:
    - <volumeMount referenced in alertmanagerConfig>
Sample rule configuration
# Configures either an alert or a target record for precomputation
apiVersion: monitoring.gdc.goog/v1alpha1
kind: MonitoringRule
metadata:
  # Choose namespace that contains the metrics that rules are based on
  # Note: alert/record will be produced in the same namespace
  namespace: g-fleetns-a
  name: alerting-config
spec:
  # Rule evaluation interval
  interval: <duration>

  # Configure limit for number of alerts (0: no limit)
  # Optional, Default: 0 (no limit)
  limit: <int>

  # Configure record rules
  recordRules:
    # Define which timeseries to write to (must be a valid metric name)
  - record: <string>

    # Define PromQL expression to evaluate for this rule
    expr: <string>

    # Define labels to add or overwrite
    # Optional, Map of {key, value} pairs
    labels:
      <labelname>: <labelvalue>

  # Configure alert rules
  alertRules:
    # Define alert name
  - alert: <string>

    # Define PromQL expression to evaluate for this rule
    # https://prometheus.io/docs/prometheus/latest/configuration/alerting_rules/
    expr: <string>

    # Define when an active alert moves from pending to firing
    # Optional, Default: 0s
    for: <duration>

    # Define labels to add or overwrite
    # Required, Map of {key, value} pairs
    # Required labels:
    #     severity: [error, critical, warning, info]
    #     code:
    #     resource: component/service/hardware related to alert
    #     additional labels are optional
    labels:
      severity: <enum: [error, critical, warning, info]>
      code:
      resource: <Short name of the related operable component>
      <labelname>: <tmpl_string>

    # Define annotations to add
    # Optional, Map of {key, value} pairs
    # Recommended annotations:
    #     message: value of Message field in UI
    #     expression: value of Rule field in UI
    #     runbookurl: URL for link in Actions to take field in UI
    annotations:
      <labelname>: <tmpl_string>
# Configures either an alert or a target record for precomputation
apiVersion: logging.gdc.goog/v1alpha1
kind: LoggingRule
metadata:
  # Choose namespace that contains the logs that rules are based on
  # Note: alert/record will be produced in the same namespace
  namespace: g-fleetns-a
  name: alerting-config
spec:
  # Choose which log source to base alerts on (Operational/Audit/Security Logs)
  # Optional, Default: Operational
  source: <string>

  # Rule evaluation interval
  interval: <duration>

  # Configure limit for number of alerts (0: no limit)
  # Optional, Default: 0 (no limit)
  limit: <int>

  # Configure record rules
  recordRules:
    # Define which timeseries to write to (must be a valid metric name)
  - record: <string>

    # Define LogQL expression to evaluate for this rule
    # https://grafana.com/docs/loki/latest/rules/
    expr: <string>

    # Define labels to add or overwrite
    # Optional, Map of {key, value} pairs
    labels:
      <labelname>: <labelvalue>

  # Configure alert rules
  alertRules:
    # Define alert name
  - alert: <string>

    # Define LogQL expression to evaluate for this rule
    expr: <string>

    # Define when an active alert moves from pending to firing
    # Optional, Default: 0s
    for: <duration>

    # Define labels to add or overwrite
    # Required, Map of {key, value} pairs
    # Required labels:
    #     severity: [error, critical, warning, info]
    #     code:
    #     resource: component/service/hardware related to alert
    #     additional labels are optional
    labels:
      severity: <enum: [error, critical, warning, info]>
      code:
      resource: <Short name of the related operable component>
      <labelname>: <tmpl_string>

    # Define annotations to add
    # Optional, Map of {key, value} pairs
    # Recommended annotations:
    #     message: value of Message field in UI
    #     expression: value of Rule field in UI
    #     runbookurl: URL for link in Actions to take field in UI
    annotations:
      <labelname>: <tmpl_string>
Query alerts from the HTTP API
The Observability platform exposes an HTTP API endpoint for querying and reading metrics, alerts, and other time series data from your project for system monitoring.Query alerts directly from the Observability HTTP API to set up automated tasks, adapt responses, and build integrations according to your use case. For example, insert the output into another command, export details to text file formats, or configure a Linux cron job. You can call the Observability HTTP API from the command-line interface (CLI) or a web browser and obtain the result in JSON format.
This section explains how to call the Observability HTTP API endpoint from the CLI using the API specification to query alerts.
Query alerts directly from the Observability HTTP API to set up automated tasks, adapt responses, and build integrations according to your use case. For example, insert the output into another command, export details to text file formats, or configure a Linux cron job. You can call the Observability HTTP API from the command-line interface (CLI) or a web browser and obtain the result in JSON format.
This section explains how to call the Observability HTTP API endpoint from the CLI using the Alertmanager API specification to query metrics.
Before you begin
To get the permissions you need to access the Observability HTTP API endpoint, ask your Project IAM Admin to grant you the Project Cortex Alertmanager Viewer (project-cortex-alertmanager-viewer) role in your project namespace.
The Project IAM Admin can grant you access by creating a role binding:
a. Infrastructure Operator (IO) Root-Admin - Project Cortex Alertmanager Viewer:
kubectl --kubeconfig $HOME/root-admin-kubeconfig create rolebinding
io-cortex-alertmanager-viewer-binding -n infra-obs
--user=fop-infrastructure-operator@example.com
--role=project-cortex-alertmanager-viewer
b. Platform-Admin (PA) Root-Admin - Project Cortex Alertmanager Viewer:
kubectl --kubeconfig $HOME/root-admin-kubeconfig create rolebinding
pa-cortex-alertmanager-viewer-binding -n platform-obs
--user=fop-platform-admin@example.com
--role=project-cortex-alertmanager-viewer
c. Application Operator (AO) Root-Admin - Project Cortex Alertmanager Viewer: Project: $AO_PROJECT AO User Name: $AO_USER
kubectl --kubeconfig $HOME/root-admin-kubeconfig create rolebinding
project-cortex-alertmanager-viewer-binding -n $AO_PROJECT
--user=$AO_USER
--role=project-cortex-alertmanager-viewer
After the role binding is created, you can access corresponding Alertmanager with your login username.
Verify the role binding
kubectl --kubeconfig $HOME/org-1-admin-kubeconfig get rolebinding -n platform-obs
For information about setting role bindings from the GDC console, see Grant access to resources.
Cortex endpoint
The following URL is the Cortex endpoint for accessing alerts:
https://GDC_URL/PROJECT_NAME/cortex/alertmanager/
Replace the following:
- GDC_URL: The URL of your organization in GDC.
- PROJECT_NAME: The name of your project.
Call the API endpoint
Follow these steps to reach the Cortex API endpoint from the CLI and query alerts:
- Ensure you meet the prerequisites.
- Open the CLI.
Use the
curltool to call the Cortex endpoint URL and extend the URL using the standard https://prometheus.io/docs/prometheus/latest/querying/api/#alertmanagers to query alerts. For example:curl https://console.org-1.zone1.google.gdch.test/alice/cortex/alertmanager/api/v1/alertmanagers
You obtain the output in the CLI following the command. The API response format is JSON.