Cloud Deploy 显示在一段时间内给定部署流水线进行了多少次部署以及这些部署中成功部署的次数的指标。
Cloud Deploy 指标简介
Cloud Deploy 中的所有部署指标都具有以下特征:
所有指标均按交付流水线进行测量。
所有指标均适用于到生产目标的部署。
交付流水线进展中的最终目标被视为生产目标。
所有指标的测量周期为 30 天。
例如,部署指标会对过去 30 天内成功和失败部署的次数进行计数。
一些指标考虑成功的部署,还有一些指标则报告失败的部署。
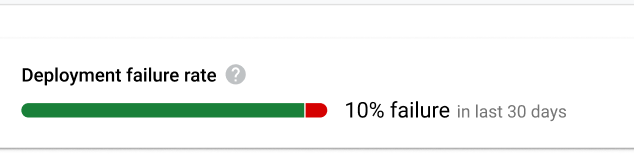
成功的部署是指一个或多个 pod 报告就绪状态的部署。部署失败率指标以所有部署尝试的百分比的形式对失败次数进行计数。
Cloud Deploy 提供Google Cloud 控制台中的以下部署指标:
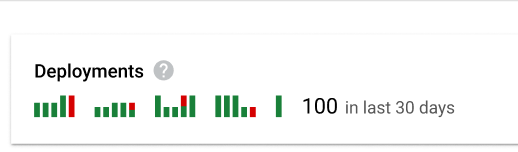
部署指标
“部署”指标显示从所选交付流水线到生产集群的成功和失败部署次数。
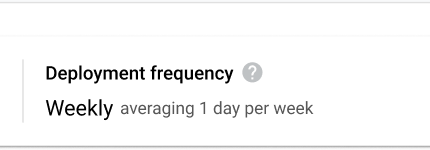
部署频率指标
“部署频率”指标显示每天交付流水线成功部署到生产目标的频率。这是 DevOps 研究和评估 (DORA) 研究计划定义的四个关键指标之一。
部署频率的计算方式
部署频率根据部署天数(而不是部署次数)计算。也就是说,如果交付流水线在给定日期生成了四个到生产环境的部署,则该日期计为一个部署日。
此指标按每天、每周或每月表示,具体取决于部署数量:
如果每周的部署天数中位数大于或等于 3,则频率表示为每天:
“0.8 次/天”。
否则,如果超过 2 周部署天数超过 0 天,则该值将表示为每周:
“每周 2 天。”
否则,如果每月至少有一个部署日,则表示为每月:
“每月 2 天。”
部署失败率指标
“部署失败率”指标显示失败的部署的百分比。