이 페이지에서는 Key Visualizer를 사용하여 Datastore 모드의 Firestore 사용 패턴과 관련된 성능 문제를 확인하는 방법을 설명합니다.
시작하기 전에
Datastore 모드에 Key Visualizer를 사용하려면 Firestore Key Visualizer API를 사용 설정해야 합니다.
Roles required to enable APIs
To enable APIs, you need the Service Usage Admin IAM
role (roles/serviceusage.serviceUsageAdmin), which
contains the serviceusage.services.enable permission. Learn how to grant
roles.
필요한 역할
계정에 다음 IAM 역할 중 하나가 부여되었는지 확인합니다.
- Cloud Datastore 소유자
- Cloud Datastore Key Visualizer 뷰어
- 편집기
- 소유자
이러한 역할에는 Key Visualizer에 액세스하는 데 필요한 다음 IAM 권한이 포함됩니다.
datastore.keyVisualizerScans.getdatastore.keyVisualizerScans.listdatastore.databases.getMetadataresourcemanager.projects.get
필요한 권한을 사용하여 커스텀 역할을 정의할 수도 있습니다.
특정 기간의 검사 보기
각 Key Visualizer 검사는 2시간의 활동을 다룹니다. 특정 기간의 검사는 해당 기간 중 1분 동안 3,000개 문서 작업을 초과하는 트래픽을 가진 데이터베이스에 사용할 수 있습니다.
Key Visualizer를 시작하려면 다음 단계를 따르세요.
Google Cloud 콘솔에서 데이터베이스 페이지로 이동합니다.
데이터베이스 목록에서 필요한 데이터베이스를 선택합니다.
탐색 메뉴에서 Key Visualizer를 클릭합니다.
사용 가능한 Key Visualizer 스캔에서 기간과 측정항목을 선택합니다.
오른쪽 상단에 있는 연필 아이콘을 클릭합니다. 날짜와 기간을 선택합니다.
검사 요건에 따라 검사가 제공됩니다. 검사 요건을 충족하지 않거나 아직 처리 중인 기간은 선택할 수 없습니다. 하루 중 가장 최근의 검사 두 개를 처리하기 전에 약간의 시간이 걸립니다.
모든 항목 데이터 또는 모든 색인 데이터를 소스로 선택합니다.
업데이트를 클릭합니다.
분석할 측정항목을 선택합니다.
왼쪽 상단의 측정항목 드롭다운을 클릭하고 확인할 측정항목을 선택합니다. Key Visualizer는 기본적으로 항목 키의 작업/초 측정항목과 색인 키의 색인 쓰기 작업/초 측정항목에서 열립니다.
측정항목을 비교하거나 데이터 상관관계를 찾기 위해 여러 Key Visualizer 측정항목을 함께 표시할 수 있습니다. 서로 다른 측정항목 간의 연결 찾기를 참조하세요.
활동 개요 보기
선택한 2시간 동안의 활동 개요를 보려면 기본 측정항목의 히트맵을 검토합니다.
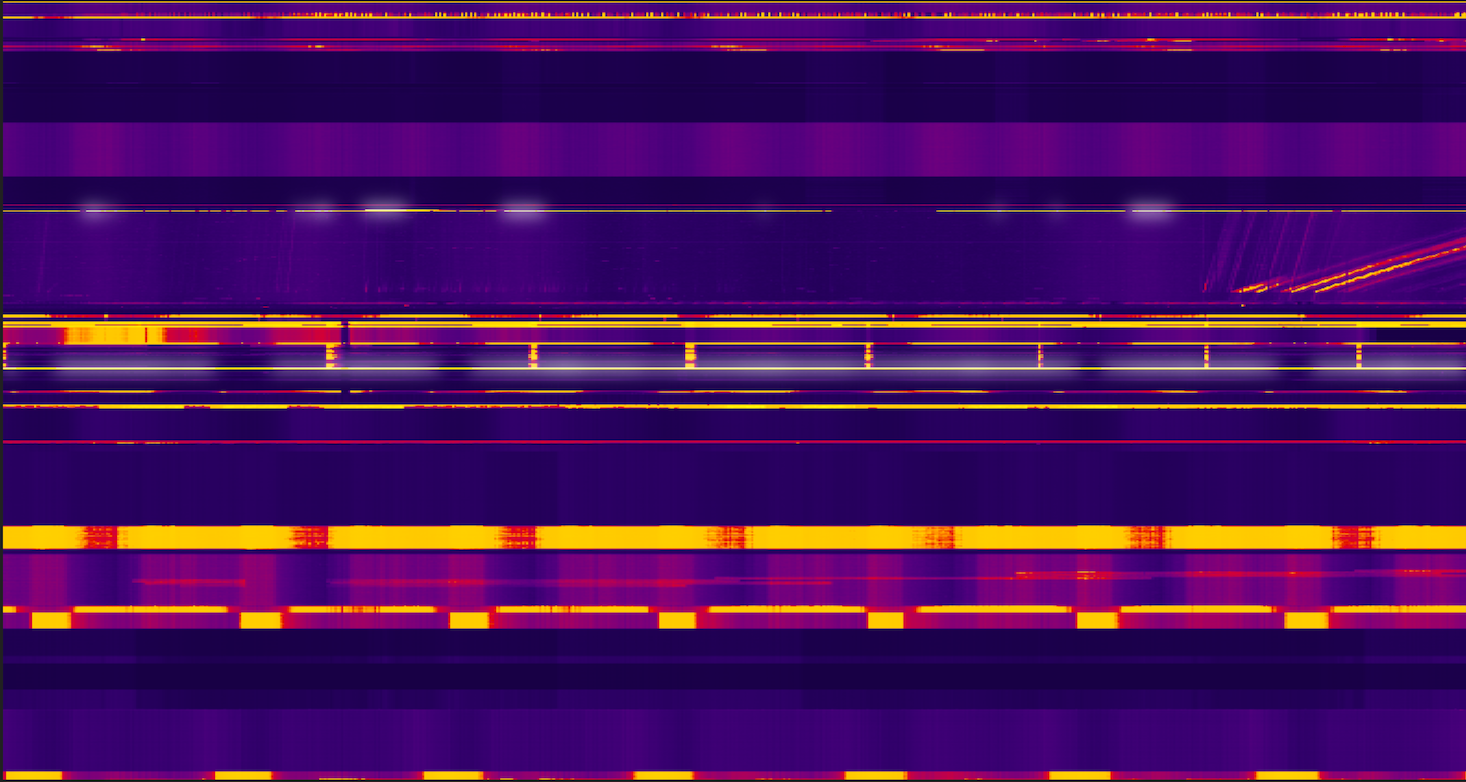
다음 예시에서는 서로 다른 주요 범위의 사용 패턴에 큰 차이가 있는 히트맵을 보여 줍니다.
- 어두운 색으로 표시된 범위에는 거의 또는 전혀 활동이 없습니다.
- 밝은 색상의 범위에는 훨씬 더 많은 활동이 있습니다.
- 중간에 빛나고 있는 흰색 범위에는 매우 많은 활동이 있습니다.
항목 키 스캔
작업/초 측정항목은 각 키 범위에 대한 초당 요청 수를 측정합니다. 이 측정항목은 쓰기, 조회, 쿼리 요청의 합계입니다. 히트맵을 열면 Key Visualizer가 기본적으로 이 측정항목을 표시합니다.
데이터베이스의 전체 활동을 파악한 후 다른 측정항목을 살펴보고 문제를 일으킬 수 있는 키 범위에 중점을 두고 조사를 계속할 수 있습니다. 자세히 알아보기
색인 키 스캔
특정 셀의 색인 쓰기 작업/초 측정항목은 해당 10초 시간 간격과 키 범위 내에서 초당 평균 색인 쓰기를 측정합니다.
다음 단계
- 항목 키에 대한 히트맵의 공통 패턴을 인식하는 방법 알아보기
- 색인 키에 대한 히트맵의 공통 패턴을 인식하는 방법을 알아보기
- 히트맵을 자세히 탐색하는 방법 알아보기