You can use the Apache Beam SDK's built-in logging infrastructure to log information when running your pipeline. You can use the Google Cloud console to monitor logging information during and after your pipeline runs.
Add log messages to your pipeline
Java
The Apache Beam SDK for Java recommends that you log worker messages through the open source Simple Logging Facade for Java (SLF4J) library. The Apache Beam SDK for Java implements the required logging infrastructure so that your Java code only needs to import the SLF4J API. Then, it instantiates a Logger to enable message logging within your pipeline code.
For pre-existing code and/or libraries, the Apache Beam SDK for Java sets up additional logging infrastructure. Log messages produced by the following logging libraries for Java are captured:
Python
The Apache Beam SDK for Python provides the logging library package,
which allows the pipeline workers to output log messages. To use the
library functions, you must import the library:
import logging
Go
The Apache Beam SDK for Go provides the log library package,
which allows the pipeline workers to output log messages. To use the
library functions, you must import the library:
import "github.com/apache/beam/sdks/v2/go/pkg/beam/log"
Worker log message code example
Java
The following example uses SLF4J for Dataflow logging. To learn more about configuring SLF4J for Dataflow logging, see the Java Tips article.
The Apache Beam WordCount example can be modified to output a log message when the word "love" is found in a line of the processed text. The added code is indicated in bold in the following example (surrounding code is included for context).
 package org.apache.beam.examples;
 // Import SLF4J packages.
 import org.slf4j.Logger;
 import org.slf4j.LoggerFactory;
 ...
 public class WordCount {
   ...
   static class ExtractWordsFn extends DoFn<String, String> {
     // Instantiate Logger.
     // Suggestion: As shown, specify the class name of the containing class
     // (WordCount).
     private static final Logger LOG = LoggerFactory.getLogger(WordCount.class);
     ...
     @ProcessElement
     public void processElement(ProcessContext c) {
       ...
       // Output each word encountered into the output PCollection.
       for (String word : words) {
         if (!word.isEmpty()) {
           c.output(word);
         }
         // Log INFO messages when the word "love" is found.
         if(word.toLowerCase().equals("love")) {
           LOG.info("Found " + word.toLowerCase());
         }
       }
     }
   }
 ... // Remaining WordCount example code ...
Python
The Apache Beam wordcount.py example can be modified to output a log message when the word "love" is found in a line of the processed text.
# import Python logging module.
import logging

class ExtractWordsFn(beam.DoFn):
  def process(self, element):
    words = re.findall(r'[A-Za-z\']+', element)
    for word in words:
      yield word

      if word.lower() == 'love':
        # Log using the root logger at info or higher levels
        logging.info('Found : %s', word.lower())

# Remaining WordCount example code ...
Go
The Apache Beam wordcount.go example can be modified to output a log message when the word "love" is found in a line of the processed text.
func (f *extractFn) ProcessElement(ctx context.Context, line string, emit func(string)) {
    for _, word := range wordRE.FindAllString(line, -1) {
        // increment the counter for small words if length of words is
        // less than small_word_length
        if strings.ToLower(word) == "love" {
            log.Infof(ctx, "Found : %s", strings.ToLower(word))
        }

        emit(word)
    }
}

// Remaining Wordcount example
Java
If the modified WordCount pipeline is run locally using the default DirectRunner
with the output sent to a local file (--output=./local-wordcounts), console output
includes the added log messages:
INFO: Executing pipeline using the DirectRunner.
...
Feb 11, 2015 1:13:22 PM org.apache.beam.examples.WordCount$ExtractWordsFn processElement
INFO: Found love
Feb 11, 2015 1:13:22 PM org.apache.beam.examples.WordCount$ExtractWordsFn processElement
INFO: Found love
Feb 11, 2015 1:13:22 PM org.apache.beam.examples.WordCount$ExtractWordsFn processElement
INFO: Found love
...
INFO: Pipeline execution complete.
By default, only log lines marked INFO and higher are sent to
Cloud Logging. To change this behavior, see
Setting Pipeline Worker Log Levels.
Python
If the modified WordCount pipeline is run locally using the default DirectRunner
with the output sent to a local file (--output=./local-wordcounts), console output
includes the added log messages:
INFO:root:Found : love
INFO:root:Found : love
INFO:root:Found : love
By default, only log lines marked INFO and higher are sent to
Cloud Logging. To change this behavior, see
Setting Pipeline Worker Log Levels.
Don't overwrite the logging configuration with logging.config
functions, as this might disable the pre-configured log handlers that
transmit the pipeline logs to Dataflow and Cloud Logging.
Go
If the modified WordCount pipeline is run locally using the default DirectRunner
with the output sent to a local file (--output=./local-wordcounts), console output
includes the added log messages:
2022/05/26 11:36:44 Found : love
2022/05/26 11:36:44 Found : love
2022/05/26 11:36:44 Found : love
By default, only log lines marked INFO and higher are sent to
Cloud Logging.
Control log volume
You might also reduce the volume of logs generated by changing the pipeline log levels. If you don't want to continue ingesting some or all of your Dataflow logs, add a Logging exclusion to exclude Dataflow logs. Then, export the logs to a different destination such as BigQuery, Cloud Storage, or Pub/Sub. For more information, see Control Dataflow log ingestion.
Logging limit and throttling
Worker log messages are limited to 15,000 messages every 30 seconds, per worker. If this limit is reached, a single worker log message is added saying that logging is throttled:
Throttling logger worker. It used up its 30s quota for logs in only 12.345s
Log storage and retention
Operational logs are stored in the
_Default log bucket. The
logging API service name is dataflow.googleapis.com. For more information
about the Google Cloud Platform monitored resource types and services used in
Cloud Logging, see Monitored resources and
services.
For details about how long log entries are retained by Logging, see the retention information in Quotas and limits: Logs retention periods.
For information about viewing operational logs, see Monitor and view pipeline logs.
Monitor and view pipeline logs
When you run your pipeline on the Dataflow service, you can use the Dataflow monitoring interface to view logs emitted by your pipeline.
Dataflow worker log example
The modified WordCount pipeline can be run in the cloud with the following options:
Java
--project=WordCountExample
--output=gs://<bucket-name>/counts
--runner=DataflowRunner
--tempLocation=gs://<bucket-name>/temp
--stagingLocation=gs://<bucket-name>/binaries
Python
--project=WordCountExample
--output=gs://<bucket-name>/counts
--runner=DataflowRunner
--staging_location=gs://<bucket-name>/binaries
Go
--project=WordCountExample
--output=gs://<bucket-name>/counts
--runner=DataflowRunner
--staging_location=gs://<bucket-name>/binaries
View logs
Because the WordCount cloud pipeline uses blocking execution, console messages are output during pipeline execution. After the job starts, a link to the Google Cloud console page is output to the console, followed by the pipeline job ID:
INFO: To access the Dataflow monitoring console, please navigate to
https://console.developers.google.com/dataflow/job/2017-04-13_13_58_10-6217777367720337669
Submitted job: 2017-04-13_13_58_10-6217777367720337669
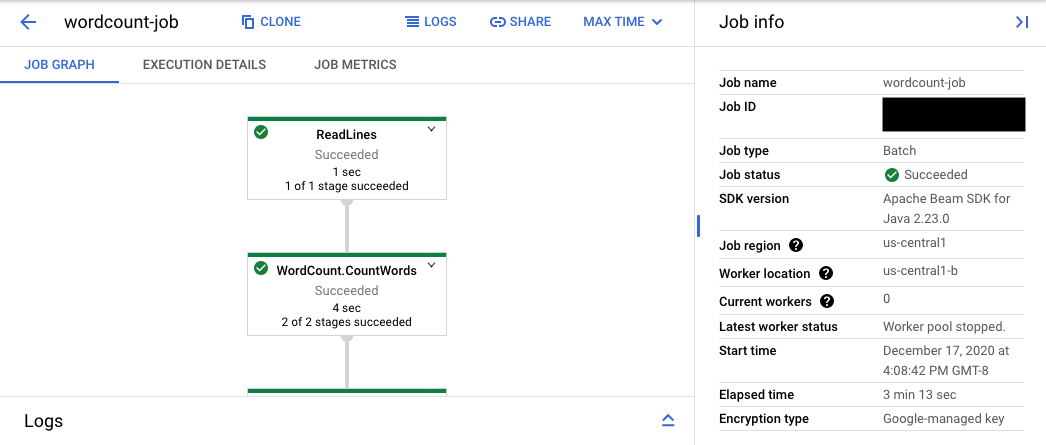
The console URL leads to the Dataflow monitoring interface with a summary page for the submitted job. It shows a dynamic execution graph on the left, with summary information on the right. Click keyboard_capslock on the bottom panel to expand the logs panel.
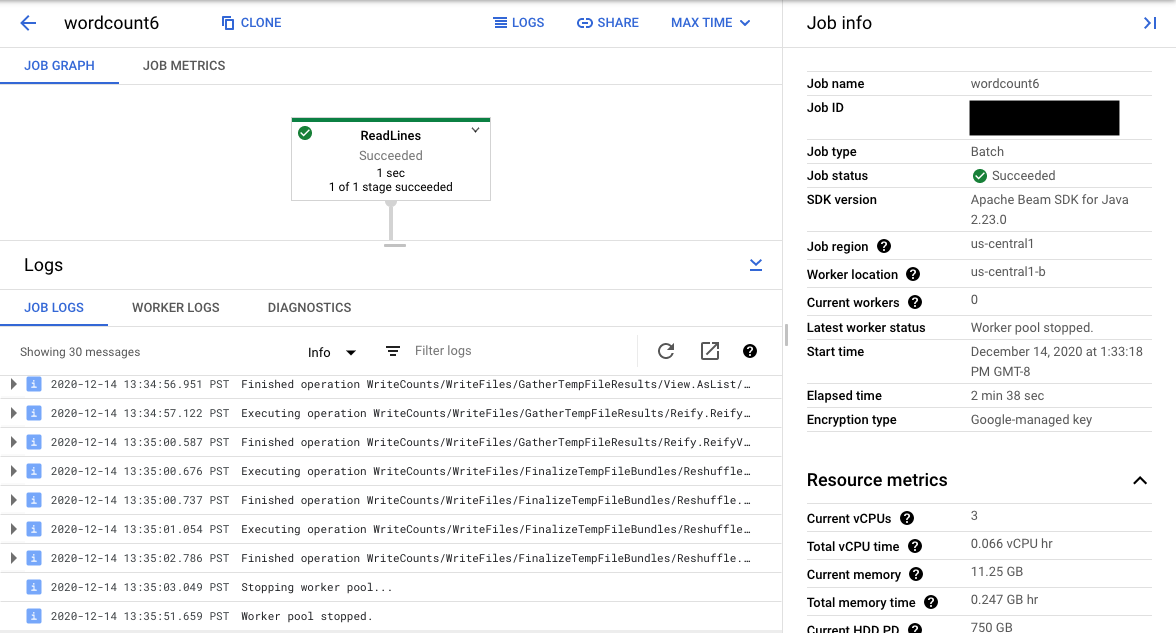
The logs panel defaults to showing Job Logs that report the status of the job as a whole. You can filter the messages that appear in the logs panel by clicking Infoarrow_drop_down and filter_listFilter logs.
Selecting a pipeline step in the graph changes the view to Step Logs generated by your code and the generated code running in the pipeline step.
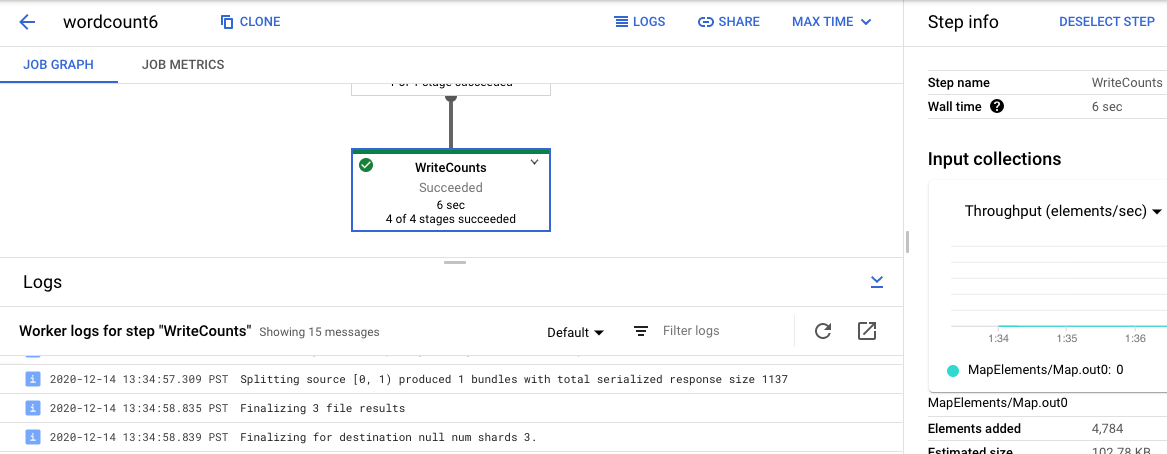
To get back to Job Logs, clear the step by clicking outside the graph or using the Deselect step button in the right side panel.
Navigate to Logs Explorer
To open Logs Explorer and select different log types, in the logs panel, click View in Logs Explorer (the external link button).
In Logs Explorer, to see the panel with different log types, click the Log fields toggle.
On the Logs Explorer page, the query might filter the logs by job step or by log type. To remove filters, click the Show query toggle and edit the query.
To see all logs available for a job, follow these steps:
In the Query field, enter the following query:
resource.type="dataflow_step"
resource.labels.job_id="JOB_ID"
Replace JOB_ID with the ID of your job.
Click Run query.
If you use this query and don't see logs for your job, click Edit time.
Adjust the start time and end time, and then click Apply.
Log types
Logs Explorer also includes infrastructure logs for your pipeline. Use error and warning logs to diagnose observed pipeline issues. Errors and warnings in the infrastructure logs that aren't correlated with a pipeline issue don't necessarily indicate a problem.
Here's a summary of the different log types available for viewing from the Logs Explorer page:
- job-message logs contain job-level messages that various components of Dataflow generate. Examples include the autoscaling configuration, when workers start up or shut down, progress on the job step, and job errors. Worker-level errors that originate from crashing user code and that are present in worker logs also propagate up to the job-message logs.
- worker logs are produced by Dataflow workers. Workers do
most of the pipeline work (for example, applying your
ParDos to data). Worker logs contain messages logged by your code and Dataflow. - worker-startup logs are present on most Dataflow jobs and can capture messages related to the startup process. The startup process includes downloading the jars of the job from Cloud Storage, then starting the workers. If there is a problem starting workers, these logs are a good place to look.
- harness logs contain messages from the Runner v2 runner harness.
- shuffler logs contain messages from workers that consolidate the results of parallel pipeline operations.
- system logs contain messages from the host operating systems of worker VMs. In some scenarios, they might capture process crashes or out-of-memory (OOM) events.
- docker and kubelet logs contain messages related to these public technologies, which are used on Dataflow workers.
- nvidia-mps logs contain messages about NVIDIA Multi-Process Service (MPS) operations.
Set pipeline worker log levels
Java
The default SLF4J logging level set on workers by the Apache Beam SDK for Java is
INFO. All log messages of INFO or higher (INFO,
WARN, ERROR) will be emitted. You can set a different default log level
to support lower SLF4J logging levels (TRACE or DEBUG) or set different
log levels for different packages of classes in your code.
The following pipeline options are provided to let you set worker log levels from the command line or programmatically:
--defaultSdkHarnessLogLevel=<level>: use this option to set all loggers at the specified default level. For example, the following command-line option will override the default DataflowINFOlog level, and set it toDEBUG:
--defaultSdkHarnessLogLevel=DEBUG--sdkHarnessLogLevelOverrides={"<package or class>":"<level>"}: use this option to set the logging level for specified packages or classes. For example, to override the default pipeline log level for theorg.apache.beam.runners.dataflowpackage, and set it toTRACE:
--sdkHarnessLogLevelOverrides='{"org.apache.beam.runners.dataflow":"TRACE"}'
To make multiple overrides, provide a JSON map:
(--sdkHarnessLogLevelOverrides={"<package/class>":"<level>","<package/class>":"<level>",...}).- The
defaultSdkHarnessLogLevelandsdkHarnessLogLevelOverridespipeline options aren't supported with pipelines that use the Apache Beam SDK versions 2.50.0 and earlier without Runner v2. In that case, use the--defaultWorkerLogLevel=<level>and--workerLogLevelOverrides={"<package or class>":"<level>"}pipeline options. To make multiple overrides, provide a JSON map:
(--workerLogLevelOverrides={"<package/class>":"<level>","<package/class>":"<level>",...})
The following example programmatically sets pipeline logging options with default values that can be overridden from the command line:
 PipelineOptions options = ...
 SdkHarnessOptions loggingOptions = options.as(SdkHarnessOptions.class);
 // Overrides the default log level on the worker to emit logs at TRACE or higher.
 loggingOptions.setDefaultSdkHarnessLogLevel(LogLevel.TRACE);
 // Overrides the Foo class and "org.apache.beam.runners.dataflow" package to emit logs at WARN or higher.
 loggingOptions.getSdkHarnessLogLevelOverrides()
     .addOverrideForClass(Foo.class, LogLevel.WARN)
     .addOverrideForPackage(Package.getPackage("org.apache.beam.runners.dataflow"), LogLevel.WARN);
Python
The default logging level set on workers by the Apache Beam SDK for Python is
INFO. All log messages of INFO or higher (INFO,
WARNING, ERROR, CRITICAL) will be emitted.
You can set a different default log level to support lower logging levels (DEBUG)
or set different log levels for different modules in your code.
Two pipeline options are provided to let you set worker log levels from the command line or programmatically:
--default_sdk_harness_log_level=<level>: use this option to set all loggers at the specified default level. For example, the following command-line option overrides the default DataflowINFOlog level, and sets it toDEBUG:
--default_sdk_harness_log_level=DEBUG--sdk_harness_log_level_overrides={\"<module>\":\"<level>\"}: use this option to set the logging level for specified modules. For example, to override the default pipeline log level for theapache_beam.runners.dataflowmodule, and set it toDEBUG:
--sdk_harness_log_level_overrides={\"apache_beam.runners.dataflow\":\"DEBUG\"}
To make multiple overrides, provide a JSON map:
(--sdk_harness_log_level_overrides={\"<module>\":\"<level>\",\"<module>\":\"<level>\",...}).
The following example uses the
WorkerOptions
class to programmatically set pipeline logging options
that can be overridden from the command line:
  from apache_beam.options.pipeline_options import PipelineOptions, WorkerOptions

  pipeline_args = [
    '--project=PROJECT_NAME',
    '--job_name=JOB_NAME',
    '--staging_location=gs://STORAGE_BUCKET/staging/',
    '--temp_location=gs://STORAGE_BUCKET/tmp/',
    '--region=DATAFLOW_REGION',
    '--runner=DataflowRunner'
  ]

  pipeline_options = PipelineOptions(pipeline_args)
  worker_options = pipeline_options.view_as(WorkerOptions)
  worker_options.default_sdk_harness_log_level = 'WARNING'

  # Note: In Apache Beam SDK 2.42.0 and earlier versions, use ['{"apache_beam.runners.dataflow":"WARNING"}']
  worker_options.sdk_harness_log_level_overrides = {"apache_beam.runners.dataflow":"WARNING"}

  # Pass in pipeline options during pipeline creation.
  with beam.Pipeline(options=pipeline_options) as pipeline:
Replace the following:
PROJECT_NAME: the name of the projectJOB_NAME: the name of the jobSTORAGE_BUCKET: the Cloud Storage nameDATAFLOW_REGION: the region where you want to deploy the Dataflow jobThe
--regionflag overrides the default region that is set in the metadata server, your local client, or environment variables.
Go
This feature is not available in the Apache Beam SDK for Go.
View the log of launched BigQuery jobs
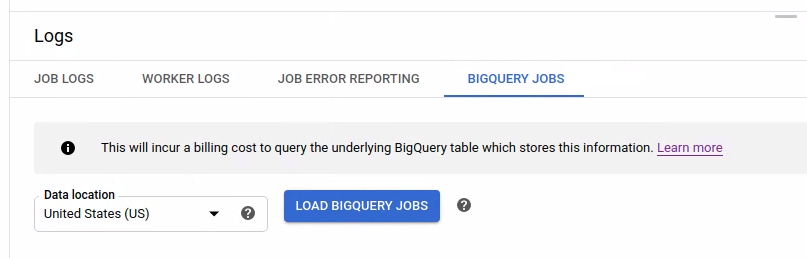
When using BigQuery in your Dataflow pipeline, BigQuery jobs are launched to perform various actions on your behalf. These actions might include loading data, exporting data, and other similar tasks. For troubleshooting and monitoring purposes, the Dataflow monitoring interface has additional information on these BigQuery jobs available in the Logs panel.
The BigQuery jobs information displayed in the Logs panel is stored and loaded from a BigQuery system table. A billing cost is incurred when the underlying BigQuery table is queried.
View the BigQuery job details
To view the BigQuery jobs information, your pipeline must use Apache Beam 2.24.0 or later.
To list the BigQuery jobs, open the BigQuery Jobs tab and select the location of the BigQuery jobs. Next, click Load BigQuery Jobs and confirm the dialog. After the query completes, the jobs list is displayed.
Basic information about each job is provided including job ID, type, duration, and other details.
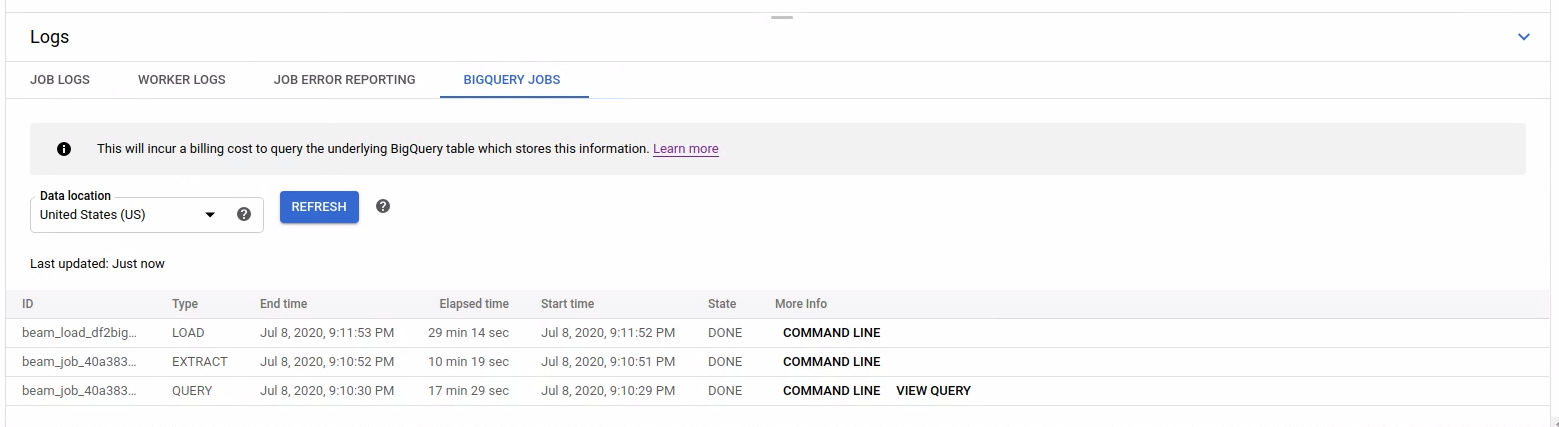
For more detailed information on a specific job, click Command line in the More Info column.
In the modal window for the command line, copy the bq jobs describe command and run it locally or in Cloud Shell.
gcloud alpha bq jobs describe BIGQUERY_JOB_ID
The bq jobs describe command outputs
JobStatistics,
which provide further details that are useful when diagnosing a slow or stuck BigQuery job.
Alternatively, when you use BigQueryIO with a SQL query, a query job is issued. To see the SQL query used by the job, click View query in the More Info column.
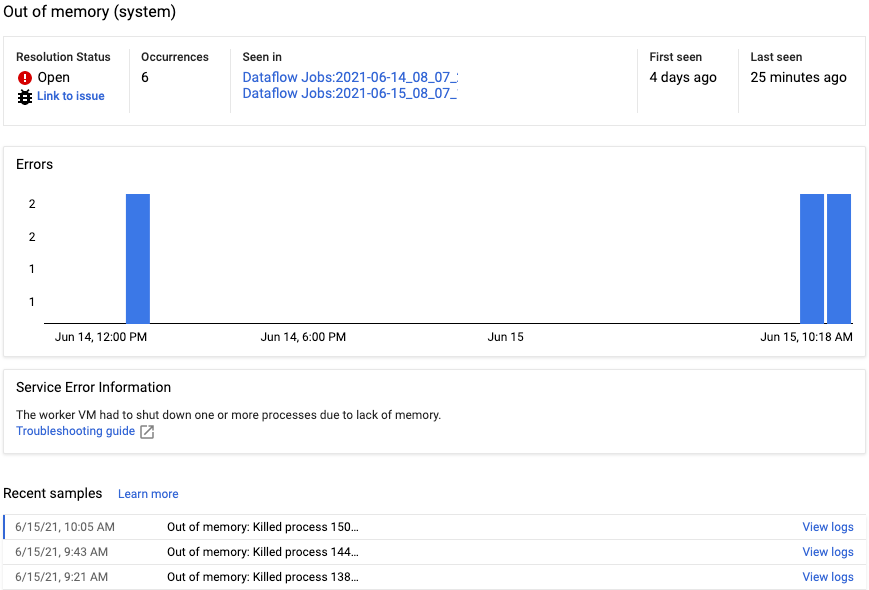
View diagnostics
The Diagnostics tab of the Logs pane collects and displays certain log entries produced in your pipelines. These entries include messages that indicate a probable issue with the pipeline and error messages with stack traces. Collected log entries are deduplicated and combined into error groups.
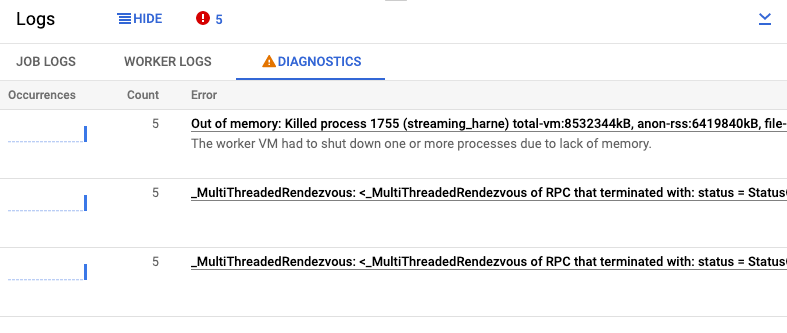
The error report includes the following information:
- A list of errors with error messages
- The number of times each error occurred
- A histogram indicating when each error occurred
- The time that the error most recently occurred
- The time that the error first occurred
- The status of the error
To view the error report for a specific error, click the description under the Errors column. The Error reporting page is displayed. If the error is a Service Error, a Troubleshooting guide link displays.
To know more about the page, see View and filter errors.
Mute an error
To mute an error message, follow these steps:
- Open the Diagnostics tab.
- Click the error that you want to mute.
- Open the resolution status menu. The statuses have the following labels: Open, Acknowledged, Resolved, or Muted.
- Select Muted.
Use a different SLF4J logging provider
By default, the Apache Beam SDK for Java uses java.util.logging as the
SLF4J logging provider. When a pipeline starts, Dataflow
automatically adds the necessary JARs to the Java classpath to configure this
logging environment.
To use a different SLF4J logging provider, such as
Reload4J or Logback,
you must prevent the default JARs from being added to the classpath, because
SLF4J only supports one logging provider at runtime. Add
the following experiment to your pipeline options:
--experiments=use_custom_logging_libraries. This option is only available for
pipelines that use Runner V2 since Apache Beam
SDK 2.63.0.
When you enable this experiment, you can bundle your preferred SLF4J logging provider with your pipeline's JARs.