Nel menu di navigazione, fai clic su Datastore Studio.
Tipi di statistiche
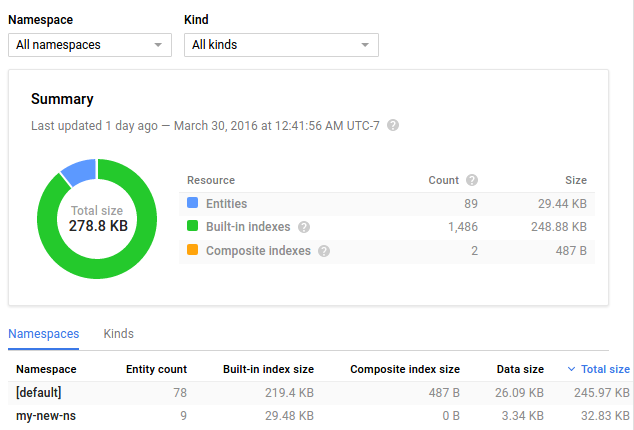
La pagina della dashboard mostra i dati in vari modi:
Un grafico a torta che mostra lo spazio utilizzato da ogni tipo di proprietà, ad esempio stringa, double o blob.
Un grafico a torta che mostra lo spazio utilizzato per tipo di entità.
Una tabella con lo spazio totale utilizzato da ogni tipo di proprietà. Il tipo di proprietà "Metadati"
rappresenta lo spazio consumato dall'archiviazione
di proprietà all'interno di una voce che non viene utilizzata direttamente dalle proprietà. L'entità
"Statistiche Datastore", se presente, mostra lo spazio occupato dai dati delle statistiche
nel database.
Una tabella che mostra le dimensioni totali, le dimensioni medie, il conteggio delle voci e le dimensioni di tutte le entità, nonché degli indici integrati e composti.
Per impostazione predefinita, i grafici a torta mostrano le statistiche per tutte le entità. Puoi limitare
i grafici a torta a un tipo di entità specifico scegliendolo dal menu a discesa.
Limitazioni dello spazio di archiviazione per le statistiche
I dati delle statistiche vengono archiviati nell'istanza Datastore
della tua applicazione. Lo spazio utilizzato dai dati delle statistiche aumenta in proporzione al numero di tipi di entità e tipi di proprietà diversi utilizzati dalla tua applicazione. Se utilizzi gli spazi dei nomi, ognuno contiene una copia completa delle statistiche per quello spazio dei nomi. Per mantenere ragionevole l'overhead di archiviazione e aggiornamento delle statistiche, il database elimina progressivamente le entità delle statistiche.
Per informazioni dettagliate sui dati statistici e su come Datastore elimina progressivamente le entità statistiche, consulta Statistiche della modalità Datastore.
[[["Facile da capire","easyToUnderstand","thumb-up"],["Il problema è stato risolto","solvedMyProblem","thumb-up"],["Altra","otherUp","thumb-up"]],[["Difficile da capire","hardToUnderstand","thumb-down"],["Informazioni o codice di esempio errati","incorrectInformationOrSampleCode","thumb-down"],["Mancano le informazioni o gli esempi di cui ho bisogno","missingTheInformationSamplesINeed","thumb-down"],["Problema di traduzione","translationIssue","thumb-down"],["Altra","otherDown","thumb-down"]],["Ultimo aggiornamento 2025-09-03 UTC."],[[["\u003cp\u003eThe Datastore Dashboard provides statistics on your application's data, accessible via the Google Cloud console's Databases page and then selecting Datastore Studio.\u003c/p\u003e\n"],["\u003cp\u003eStatistics are displayed through pie charts and tables, showing data usage by property type, entity kind, and overall space consumed by entities and indexes.\u003c/p\u003e\n"],["\u003cp\u003eThe statistics displayed include total space used, average size, entry count, and a breakdown of space usage by various property types, including metadata and datastore statistics themselves.\u003c/p\u003e\n"],["\u003cp\u003eWhile the charts show data for all entities by default, users can filter them to display data for a specific entity kind using a drop-down menu.\u003c/p\u003e\n"],["\u003cp\u003eStorage of statistics data depends on the number of different entity kinds, property types, and namespaces, and the database will progressively drop statistics entities to maintain reasonable storage overhead.\u003c/p\u003e\n"]]],[],null,["# Viewing Statistics in the Console\n\nThis page describes details of the statistics shown in the Datastore\nDashboard.\n\nViewing the statistics\n----------------------\n\nView statistics for your application's data in the Datastore\nDashboard.\n\n1. In the Google Cloud console, go to the **Databases** page.\n\n [Go to Databases](https://console.cloud.google.com/datastore/databases)\n2. Select the required database from the list of databases.\n\n3. In the navigation menu, click **Datastore Studio**.\n\n| **Note:** While Datastore removes individual entities almost immediately, a namespace container may remain visible for several days to a week after the final entity within it is removed.\n\nTypes of statistics\n-------------------\n\nThe Dashboard page displays data in various ways:\n\n- A pie chart that shows space used by each property\n type, such as string, double, or blob.\n\n- A pie chart showing space used by entity kind.\n\n- A table with the total space used by each property type. The \"Metadata\"\n property type represents space consumed by storing\n properties inside an entry that is not used by the properties directly. The\n \"Datastore Stats\" entity, if any, shows the space consumed by the statistics\n data itself in your database.\n\n- A table showing total size, average size, entry count, and the size of all\n entities, and the built-in and composite indexes.\n\n| **Note:** Operations generated by Datastore Statistics count against your [quota](/datastore/docs/pricing).\n\nBy default, the pie charts display statistics for all entities. You can restrict\nthe pie charts to a particular entity kind by choosing from the drop-down menu.\n\nStorage limitations for statistics\n----------------------------------\n\nThe statistics data is stored in your application's Datastore\ninstance. The space consumed by the statistics data increases in proportion to\nthe number of different entity kinds and property types used by your\napplication. If you use namespaces, each namespace contains a complete copy of\nthe stats for that namespace. To keep the overhead of storing and updating the\nstatistics reasonable, the database progressively drops statistics\nentities.\n\nFor details on statistics data and how Datastore progressively\ndrops statistics entities, see [Datastore mode Statistics](/datastore/docs/concepts/stats)."]]