Vertex AI Vision is an AI-powered platform you can use to ingest, analyze, and store video data. Vertex AI Vision lets you build and deploy AI applications. You can build end-to-end Vertex AI Vision solutions by leveraging Vertex AI Vision's integration with other product components.
To start implementing solutions using the Vertex AI Vision platform, review the following Vertex AI Vision concepts and components:
Streams: Represent a video streaming layer from your solution. The stream source can be a live video (for example, an IP camera) or a video file (for example, an MP4 file).
Applications: Enable the connection between a stream and an AI processor to perform a machine learning operation on the video. For example, you can connect a camera stream to an AI model that counts people passing in front of it.
App output destination: Send analyzed data to a storage destination (Vertex AI Vision's Media Warehouse or BigQuery) or receive live data. Storing to Vertex AI Vision's Media Warehouse lets you search analysis output and metadata from the AI processors used on data from the ingested streams. Storing to BigQuery lets you use the product's offline analytics capabilities. If you directly receive app output, you can use insights to instantly inform business decisions. For more information, see Overview: Connect app output to a data destination.
Objectives
This tutorial shows you how to do the following:
- Create a BigQuery dataset and table.
- Build a Vertex AI Vision occupancy analytics app that connects to BigQuery.
- Create a Compute Engine VM instance and set up its environment.
- Stream video from the VM instance to the app.
- Use stored app output to create a forecasting model with BigQuery ML.
Costs
In this document, you use the following billable components of Google Cloud:
- Vertex AI Vision (Streams - Data ingested, Streams - Data consumed, Models - Occupancy analytics suite)
- Compute Engine
- BigQuery
To generate a cost estimate based on your projected usage,
use the pricing calculator.
When you finish the tasks that are described in this document, you can avoid continued billing by deleting the resources that you created. For more information, see Clean up.
Before you begin
- Sign in to your Google Cloud account. If you're new to Google Cloud, create an account to evaluate how our products perform in real-world scenarios. New customers also get $300 in free credits to run, test, and deploy workloads.
-
In the Google Cloud console, on the project selector page, select or create a Google Cloud project.
Roles required to select or create a project
- Select a project: Selecting a project doesn't require a specific IAM role—you can select any project that you've been granted a role on.
-
Create a project: To create a project, you need the Project Creator
(
roles/resourcemanager.projectCreator), which contains theresourcemanager.projects.createpermission. Learn how to grant roles.
-
Verify that billing is enabled for your Google Cloud project.
-
Enable the BigQuery, Compute Engine and Vision AI APIs.
Roles required to enable APIs
To enable APIs, you need the Service Usage Admin IAM role (
roles/serviceusage.serviceUsageAdmin), which contains theserviceusage.services.enablepermission. Learn how to grant roles. -
Create a service account:
-
Ensure that you have the Create Service Accounts IAM role
(
roles/iam.serviceAccountCreator). Learn how to grant roles. -
In the Google Cloud console, go to the Create service account page.
Go to Create service account - Select your project.
-
In the Service account name field, enter a name. The Google Cloud console fills in the Service account ID field based on this name.
In the Service account description field, enter a description. For example,
Service account for quickstart. - Click Create and continue.
-
Grant the following roles to the service account: Vision AI > Vision AI Editor, Compute Engine > Compute Instance Admin (beta), BigQuery > BigQuery Data Owner, Storage > Storage Object Viewer†.
To grant a role, find the Select a role list, then select the role.
To grant additional roles, click Add another role and add each additional role.
- Click Continue.
-
Click Done to finish creating the service account.
Do not close your browser window. You will use it in the next step.
-
Ensure that you have the Create Service Accounts IAM role
(
-
Create a service account key:
- In the Google Cloud console, click the email address for the service account that you created.
- Click Keys.
- Click Add key, and then click Create new key.
- Click Create. A JSON key file is downloaded to your computer.
- Click Close.
-
Install the Google Cloud CLI.
-
If you're using an external identity provider (IdP), you must first sign in to the gcloud CLI with your federated identity.
-
To initialize the gcloud CLI, run the following command:
gcloud init -
In the Google Cloud console, on the project selector page, select or create a Google Cloud project.
Roles required to select or create a project
- Select a project: Selecting a project doesn't require a specific IAM role—you can select any project that you've been granted a role on.
-
Create a project: To create a project, you need the Project Creator
(
roles/resourcemanager.projectCreator), which contains theresourcemanager.projects.createpermission. Learn how to grant roles.
-
Verify that billing is enabled for your Google Cloud project.
-
Enable the BigQuery, Compute Engine and Vision AI APIs.
Roles required to enable APIs
To enable APIs, you need the Service Usage Admin IAM role (
roles/serviceusage.serviceUsageAdmin), which contains theserviceusage.services.enablepermission. Learn how to grant roles. -
Create a service account:
-
Ensure that you have the Create Service Accounts IAM role
(
roles/iam.serviceAccountCreator). Learn how to grant roles. -
In the Google Cloud console, go to the Create service account page.
Go to Create service account - Select your project.
-
In the Service account name field, enter a name. The Google Cloud console fills in the Service account ID field based on this name.
In the Service account description field, enter a description. For example,
Service account for quickstart. - Click Create and continue.
-
Grant the following roles to the service account: Vision AI > Vision AI Editor, Compute Engine > Compute Instance Admin (beta), BigQuery > BigQuery Data Owner, Storage > Storage Object Viewer†.
To grant a role, find the Select a role list, then select the role.
To grant additional roles, click Add another role and add each additional role.
- Click Continue.
-
Click Done to finish creating the service account.
Do not close your browser window. You will use it in the next step.
-
Ensure that you have the Create Service Accounts IAM role
(
-
Create a service account key:
- In the Google Cloud console, click the email address for the service account that you created.
- Click Keys.
- Click Add key, and then click Create new key.
- Click Create. A JSON key file is downloaded to your computer.
- Click Close.
-
Install the Google Cloud CLI.
-
If you're using an external identity provider (IdP), you must first sign in to the gcloud CLI with your federated identity.
-
To initialize the gcloud CLI, run the following command:
gcloud init
† Role only needed if you copy a sample video file from a Cloud Storage bucket.
Set up BigQuery to receive data
To be able to receive data and make predictions from your analytics app data, you must create a BigQuery dataset and table that match the processed information.
Create a dataset
Before you can create a BigQuery table, you must first create a dataset to receive the analyzed information from your app.
Console
Open the BigQuery page in the Google Cloud console.
In the Explorer panel, select the project where you want to create the dataset.
Expand the Actions option and click Create dataset.
On the Create dataset page:
- For Dataset ID, enter
occupancy_dataset. For Data location, choose a geographic location for the dataset. After a dataset is created, the location can't be changed.
For Default table expiration, choose one of the following options:
- Never: (Default) Tables created in the dataset are never automatically deleted. You must delete them manually.
Number of days after table creation: This value determines when a newly created table in the dataset is deleted. This value is applied if you don't set a table expiration when the table is created.
Click Create dataset.
- For Dataset ID, enter
Create a BigQuery table
Console
In the Google Cloud console, go to the BigQuery page.
- In the Explorer pane, expand your project, and then select
the
occupancy_datasetdataset. - In the Dataset info section, click Create table.
- In the Create table panel, specify the following details:
- In the Source section, select Empty table in the Create table from list.
- In the Destination section, specify the following
details:
- Verify that in the Dataset field
occupancy_datasetis specified. - In the Table field, enter
occupancy_dataset_table. - Verify that the Table type field is set to Native table.
- Verify that in the Dataset field
- In the Schema section, enter the
schema definition. You can
enter schema information manually by doing the following:
- Click
Edit as text and paste the following JSON array
schema. When you use a JSON array, you
generate the schema using the same process as
creating
a JSON schema file.
[
    {
      "name": "ingestion_time",
      "type": "TIMESTAMP",
      "mode": "REQUIRED"
    },
    {
      "name": "application",
      "type": "STRING",
      "mode": "REQUIRED"
    },
    {
      "name": "instance",
      "type": "STRING",
      "mode": "REQUIRED"
    },
    {
      "name": "node",
      "type": "STRING",
      "mode": "REQUIRED"
    },
    {
      "name": "annotation",
      "type": "STRING"
    }
]
- Click
Edit as text and paste the following JSON array
schema. When you use a JSON array, you
generate the schema using the same process as
creating
a JSON schema file.
- Click Create table.
Create an occupancy count application
After you have set up your BigQuery dataset and table, you can create the app that processes the data sent to these BigQuery resources.
Create an empty app
Before you can populate the app graph, you must first create an empty app.
Console
Create an app in the Google Cloud console.
Open the Applications tab of the Vertex AI Vision dashboard.
Click the Create button.
Enter
occupancy-bq-appas the app name and choose your region.Click Create.
Add app component nodes
After you have created the empty application, you can then add the three nodes to the app graph:
- Ingestion node: The stream resource that ingests data sent from a Compute Engine VM instance you create.
- Processing node: The occupancy analytics model that acts on ingested data.
- BigQuery node: The connector node that lets your app to store metadata to your BigQuery table.
Console
Add component nodes to your app in the console.
Open the Applications tab of the Vertex AI Vision dashboard.
In the
occupancy-bq-appline, select View graph. This takes you to the graph visualization of the processing pipeline.
Add a data ingestion node
To add an input stream node, select the Streams option in the Connectors section of the side menu.
In the Source section of the Stream menu that opens, select Add streams.
In the Add streams menu, choose Register new streams and add
occupancy-bq-streamas the stream name.To add the stream to the app graph, click Add streams.
Add a data processing node
To add the occupancy count model node, select the occupancy analytics option in the Specialized models section of the side menu.
Leave the default selections People and Vehicles.
Add a BigQuery node
To add the output destination (storage) node, select the BigQuery option in the Connectors section of the side menu.
In the BigQuery menu, search for
occupancy_dataset_tableand select your table.In the Store metadata from: section, select both Streams and Occupancy analytics.
Deploy your app for use
After you have built your end-to-end app with all the necessary components, the last step to using the app is to deploy it.
Console
Open the Applications tab of the Vertex AI Vision dashboard.
Select View graph next to the
occupancy-bq-appapp in the list.From the application graph builder page, click the Deploy button.
In the following confirmation dialog, select Deploy.
The deploy operation might take several minutes to complete. After deployment finishes, green check marks appear next to the nodes.
Set up a remote machine to stream video
Now that you have a deployed occupancy count app ready to receive, process, and store streaming data out to a BigQuery table, you must actually stream video data into the app.
In this tutorial you create a Compute Engine VM instance that hosts a video, and you send that streaming video data from the VM.
Create a Linux VM
The first step in sending video from a Compute Engine VM instance is creating the VM instance.
Console
In the console, go to the VM instances page.
Select your project and click Continue.
Click Create instance.
Specify a Name for your VM. For more information, see Resource naming convention.
Optional: Change the Zone for this VM. Compute Engine randomizes the list of zones within each region to encourage use across multiple zones.
Accept the remaining default options. For more information about these options, see Create and start a VM.
To create and start the VM, click Create.
Set up the VM environment
After the VM has started, you can use the console to establish
an SSH connection in your browser. After establishing this connection, you can
download the vaictl command-line tool to ingest video into your app.
Console
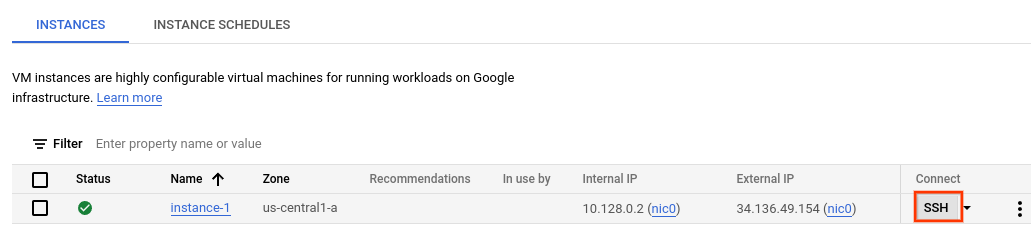
Establish an SSH connection to your VM
In the console, go to the VM instances page.
In the Connect section of the instance line you created, click on SSH. This opens an SSH connection in a new browser window.
Download the vaictl command-line tool
In the SSH-in-browser window, download the Vertex AI Vision (
vaictl) command-line tool using the following command:wget https://github.com/google/visionai/releases/download/v0.0.5/visionai_0.0-5_amd64.debInstall the command-line tool by running the following command:
sudo apt install ./visionai_0.0-5_amd64.debYou can test the installation by running the following command:
vaictl --help
Ingest a video file into your app
After you set up your VM environment, you can copy a sample video file and then
use vaictl to stream the video data to your occupancy count app.
After you send this command, you must let several hours of data to stream before you move to the next step.
SSH-in-browser
Copy a sample video to your VM
- In the SSH-in-browser window for your VM, copy a sample
video with the following
gcloud storage cpcommand. Replace the following variable:- SOURCE: The location of a video file to use. You
can use your own video file source (for example,
gs://BUCKET_NAME/FILENAME.mp4), or use one of the sample videos:gs://cloud-samples-data/vertex-ai-vision/street_vehicles_people.mp4(video with people and vehicles, video source)gs://cloud-samples-data/vertex-ai-vision/highway_vehicles.mp4(video with vehicles only, video source)
gcloud storage cp SOURCE .
- SOURCE: The location of a video file to use. You
can use your own video file source (for example,
Stream video from VM and ingest data into your app
- To send this local video file to the app input stream, use the
following command. You must take the following variable substitutions:
- PROJECT_ID: Your Google Cloud project ID.
- LOCATION_ID: Your location ID. For example,
us-central1. More information. - LOCAL_FILE.EXT: The filename of a local video file.
For example,
my-video.mp4. --loopflag: Optional. Loops file data to simulate streaming.
This command streams a video file to a stream. If using the
--loopflag, the video is looped into the stream until you stop the command:vaictl -p PROJECT_ID \ -l LOCATION_ID \ -c application-cluster-0 \ --service-endpoint visionai.googleapis.com \ send video-file to streams 'occupancy-bq-stream' --file-path LOCAL_FILE.EXT --loop
It might take ~100 seconds between starting the vaictl ingest operation and
the video appearing in the dashboard.
After the stream ingestion is available,
you can see the video feed in the Streams tab of the Vertex AI Vision
dashboard by selecting the occupancy-bq-stream stream.
Build a forecasting model with BigQuery ML
You now have a functioning app storing metadata out to BigQuery. After you have a couple of hours of data streamed into your app, you can begin to build a forecasting model with BigQuery ML.
Optional: Run an occupancy query
You can view the app-produced data stored to the table by running a simple query.
Console
In the Google Cloud console, open the BigQuery page.
Select Expand next to
occupancy_dataset, and selectoccupancy_dataset_table.In the table detail view, click Compose new query.

Enter the following Google Standard SQL query in the Query editor text area:
SELECT
 *
FROM (
 SELECT
   TIMESTAMP_TRUNC(PARSE_TIMESTAMP('"%Y-%m-%dT%H:%M:%E*SZ"', JSON_QUERY(annotation,
         "$.currentTime")), MINUTE) currentTime,
   CAST(JSON_QUERY(annotation,
       '$.stats.fullFrameCount[0].count') AS INT64) AS count,
   JSON_QUERY(annotation,
     '$.stats.fullFrameCount[0].entity.labelString') AS type
 FROM
   `PROJECT_ID.occupancy_dataset.occupancy_dataset_table` )
WHERE
 count IS NOT NULL
Optional: To change the data processing location, click More, then Query settings. Under Processing location, click Auto-select and choose your data's location. Finally, click Save to update the query settings.
Click Run.
This creates a query job that writes the output to a temporary table.
Running this query produces a table with time and count information when people are present in the video.
| currentTime | count | type |
|---|---|---|
| 2022-08-10 16:17:00 UTC | 2 | "Person" |
| 2022-08-10 16:17:00 UTC | 2 | "Person" |
| 2022-08-10 16:17:00 UTC | 4 | "Person" |
| 2022-08-10 16:17:00 UTC | 1 | "Person" |
| 2022-08-10 16:17:00 UTC | 5 | "Person" |
| 2022-08-10 16:17:00 UTC | 2 | "Person" |
Create a view for training
After seeing the data stored to the table, you can create a view, and then inspect the contents of the resulting table. You use this view data to train your forecasting model.
You can create a view by composing a SQL query that is used to define the data
accessible to the view. The SQL query must consist of a SELECT statement. For
more information about BigQuery views, see
Introduction to views.
To create a training table view:
Console
In the Google Cloud console, open the BigQuery page.
Select Expand next to
occupancy_dataset, and selectoccupancy_dataset_table.In the table detail view, click Compose new query.
Enter the following Google Standard SQL query in the Query editor text area:
CREATE VIEW `PROJECT_ID.occupancy_dataset.forecast_training_data` AS (
  WITH
    raw_counts AS (
    SELECT
      *
    FROM (
      SELECT
        TIMESTAMP_TRUNC(
          PARSE_TIMESTAMP('"%Y-%m-%dT%H:%M:%E*SZ"',
                          JSON_QUERY(annotation,
                                      "$.currentTime")),
                        MINUTE) AS currentTime,
        CAST(JSON_QUERY(annotation,
            '$.stats.fullFrameCount[0].count') AS INT64) AS count,
        JSON_QUERY(annotation,
          '$.stats.fullFrameCount[0].entity.labelString') AS type
      FROM
        `PROJECT_ID.occupancy_dataset.occupancy_dataset_table` )
    WHERE
      count IS NOT NULL )
  SELECT
    currentTime,
    SUM(count) AS total_count,
    type
  FROM
    raw_counts
  GROUP BY
    currentTime, type)
Click Run.
Optional: Query the view
Run the following query to see the results of the new view training data:
Console
In the
occupancy_dataset_tabletable detail view, click Compose new query.Enter the following Google Standard SQL query in the Query editor text area:
SELECT
 *
FROM
  `PROJECT_ID.occupancy_dataset.forecast_training_data`
ORDER BY
 currentTime, type
LIMIT
 100
Click Run.
This returns a result sorted by time that looks like the following:
| currentTime | total_count | type |
|---|---|---|
| 2022-08-10 16:17:00 UTC | 129 | "Person" |
| 2022-08-10 16:18:00 UTC | 150 | "Person" |
| 2022-08-10 16:19:00 UTC | 80 | "Person" |
| 2022-08-10 16:20:00 UTC | 129 | "Person" |
| 2022-08-10 16:21:00 UTC | 142 | "Person" |
| 2022-08-10 16:22:00 UTC | 71 | "Person" |
| 2022-08-10 16:22:00 UTC | 2 | "Vehicle" |
Train the forecast model with BigQuery ML
Now that you have data in a view to serve as training data, you can train the forecast model with BigQuery ML.
Console
In the
occupancy_dataset_tabletable detail view, click Compose new query.Enter the following Google Standard SQL query in the Query editor text area:
CREATE OR REPLACE MODEL `PROJECT_ID.occupancy_dataset.occupancy_forecast_model`
  OPTIONS( MODEL_TYPE = "ARIMA_PLUS",
    TIME_SERIES_TIMESTAMP_COL = "currentTime",
    TIME_SERIES_DATA_COL = "total_count",
    TIME_SERIES_ID_COL = "type" ) AS
SELECT
  *
FROM
  `PROJECT_ID.occupancy_dataset.forecast_training_data`
Click Run.
The query takes several minutes to complete. After the first iteration is
complete, your model (occupancy_forecast_model) appears in the navigation
panel. Because the query uses a CREATE MODEL statement to create a model,
you don't see query results.
You can observe the model as it's being trained by viewing the Model stats tab. As soon as the first iteration completes, the tab is updated. The stats continue to update as each iteration completes.
Get an occupancy prediction with BigQuery
After your model is done training, you can get a prediction from the model about occupancy count.
The following ML.FORECAST query uses the
HORIZON function input to make a forecast of the next 60
minutes.
Console
In the
occupancy_dataset_tabletable detail view, click Compose new query.Enter the following Google Standard SQL query in the Query editor text area:
SELECT
  *
FROM
  ML.FORECAST(MODEL `PROJECT_ID.occupancy_dataset.occupancy_forecast_model`,
  STRUCT(60 AS HORIZON))
Click Run.
The model produces forecasts under forecast_value for future timestamps where
type is "Person". For example, on 2022-08-12 at 11:06:00, the model
forecasts there will be ~15.26 "Persons" in total.
| type | forecast_timestamp | forecast_value | standard_error | confidence_level | prediction_interval_lower_bound | prediction_interval_upper_bound |
|---|---|---|---|---|---|---|
| "Person" | 2022-08-12 11:06:00 UTC | 15.2621986941298 | 2.56470066 | 0.95 | 10.2444693 | 20.2799280 |
| "Person" | 2022-08-12 11:07:00 UTC | 13.235260043001354 | 3.19379743 | 0.95 | 6.98672921 | 19.4837908 |
| "Person" | 2022-08-12 11:08:00 UTC | 16.257331475128712 | 3.87581375 | 0.95 | 8.67446430 | 23.8401986 |
| "Person" | 2022-08-12 11:09:00 UTC | 31.432229611853742 | 4.24905293 | 0.95 | 23.1191356 | 39.7453236 |
| "Person" | 2022-08-12 11:10:00 UTC | 26.199214148193725 | 4.26157413 | 0.95 | 17.8616229 | 34.5368053 |
| "Person" | 2022-08-12 11:11:00 UTC | 26.211573546307324 | 4.27962512 | 0.95 | 17.8386663 | 34.5844807 |
Clean up
To avoid incurring charges to your Google Cloud account for the resources used in this tutorial, either delete the project that contains the resources, or keep the project and delete the individual resources.
Delete the project
- In the Google Cloud console, go to the Manage resources page.
- In the project list, select the project that you want to delete, and then click Delete.
- In the dialog, type the project ID, and then click Shut down to delete the project.
Delete individual resources
Delete Compute Engine VM instance
- In the Google Cloud console, go to the VM instances page.
- Select the checkbox for the instance that you want to delete.
- To delete the instance, click More actions, click Delete, and then follow the instructions.
Delete BigQuery dataset
- In the Google Cloud console, open the BigQuery page.
-
Select expand next to your project and locate
your
occupancy_datasetdataset. - To delete the dataset, click Actions, click Delete, and then follow the instructions.
Delete a stream
- In the Google Cloud console, go to the Streams page.
-
Locate
your
occupancy-bq-streamstream. - To delete the stream, click Actions, click Delete stream, and then follow the instructions.
Delete an app
- In the Google Cloud console, go to the Applications page.
-
Locate
your
occupancy-bq-appapp. - To delete the app, click Actions, click Delete application, and then follow the instructions.
What's next
- Read more about Responsible AI practices.
- Learn about other components you can add to an app in Build an app.
- Learn about other output storage and processing options in Connect app output to a data destination .
- Read about how to Search Warehouse data in the console.
- Explore reference architectures, diagrams, and best practices about Google Cloud. Take a look at our Cloud Architecture Center.