After you create an app, you can enable visualization output during the deployment step. Then, view the output stream.
Deploy an app with visualization output enabled
After you have built an end-to-end application with all the necessary components you must deploy the app to start using it. When you deploy, you have the option to enable visualization.
Console
Open the Applications tab of the Vertex AI Vision dashboard.
Find your application from the list and, next to it, select View app.
From the application graph builder page, click Deploy.
In the Deploy application menu that opens, select any other options that apply and Enable visualization.
Choose the input you want to visualize from the drop-down menu below the checkbox option.
Click Deploy.
After deployment, green check marks appear next to the nodes.
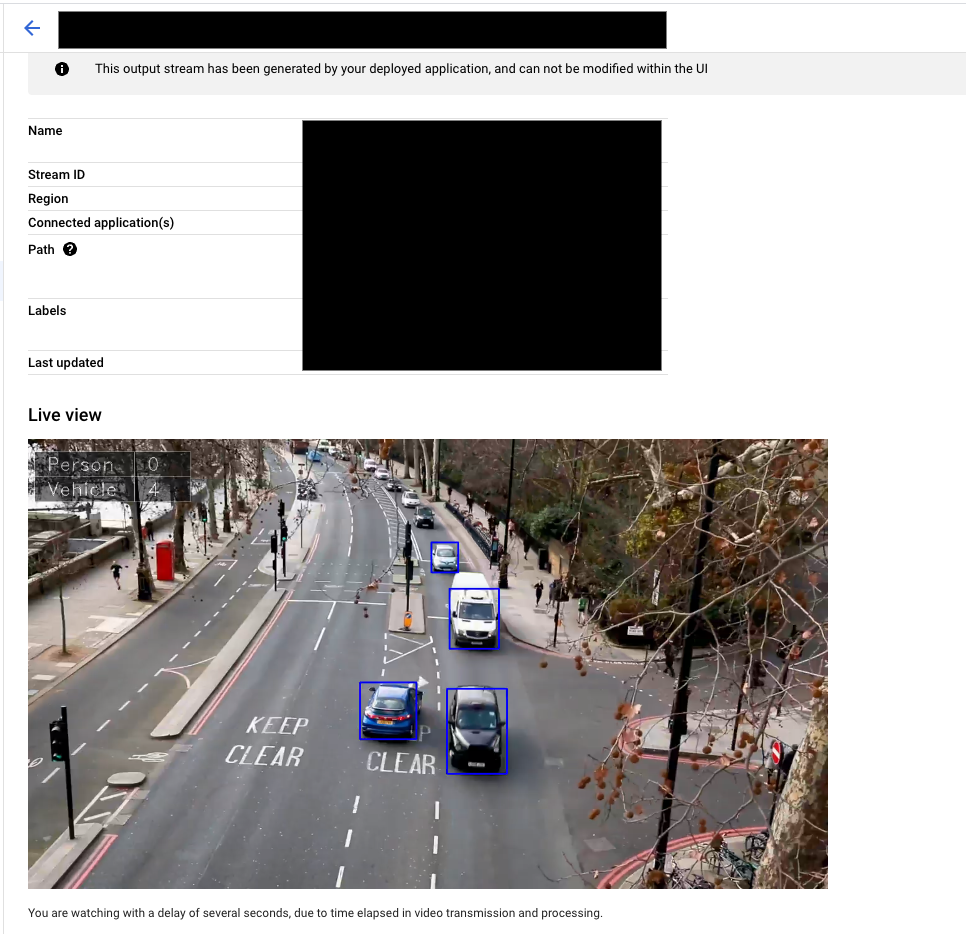
View output visualization
After an app has been deployed for some minutes, you can access a visualization of the selected input.
Console
Open the Applications tab of the Vertex AI Vision dashboard.
Find your application from the list and, next to it, select View app.
From the application graph builder page, click View Output Visualization.
You're then prompted to select the input and processor to visualize.
Select View to be directed to a stream page and view the visualization stream.
What's next
- Read instructions about how to begin data ingestion from an app's input stream in Create and manage streams.
- Learn how to list apps and view a deployed app's instances in Managing applications.
- Learn how to read app input data from an ingestion stream or analyzed model output data in Read stream data.