このページでは、Cloud SQL のシステム分析情報ダッシュボードの使用方法について説明します。システム分析情報ダッシュボードには、インスタンスで使用するリソースの指標が表示されるため、システム パフォーマンスの問題の検出と分析に役立ちます。
Gemini in Databases アシスタントを使用すると、Cloud SQL for MySQL リソースのモニタリングとトラブルシューティングを行えます。詳細については、Gemini アシスタンスによるモニタリングとトラブルシューティングをご覧ください。システム分析情報ダッシュボードを表示する
システム分析情報ダッシュボードを確認する手順は次のとおりです。
-
Google Cloud コンソールで、Cloud SQL の [インスタンス] ページに移動します。
- インスタンスの名前をクリックします。
左側の SQL ナビゲーション パネルから [システム分析情報] タブを選択します。
システム分析情報ダッシュボードが開きます。
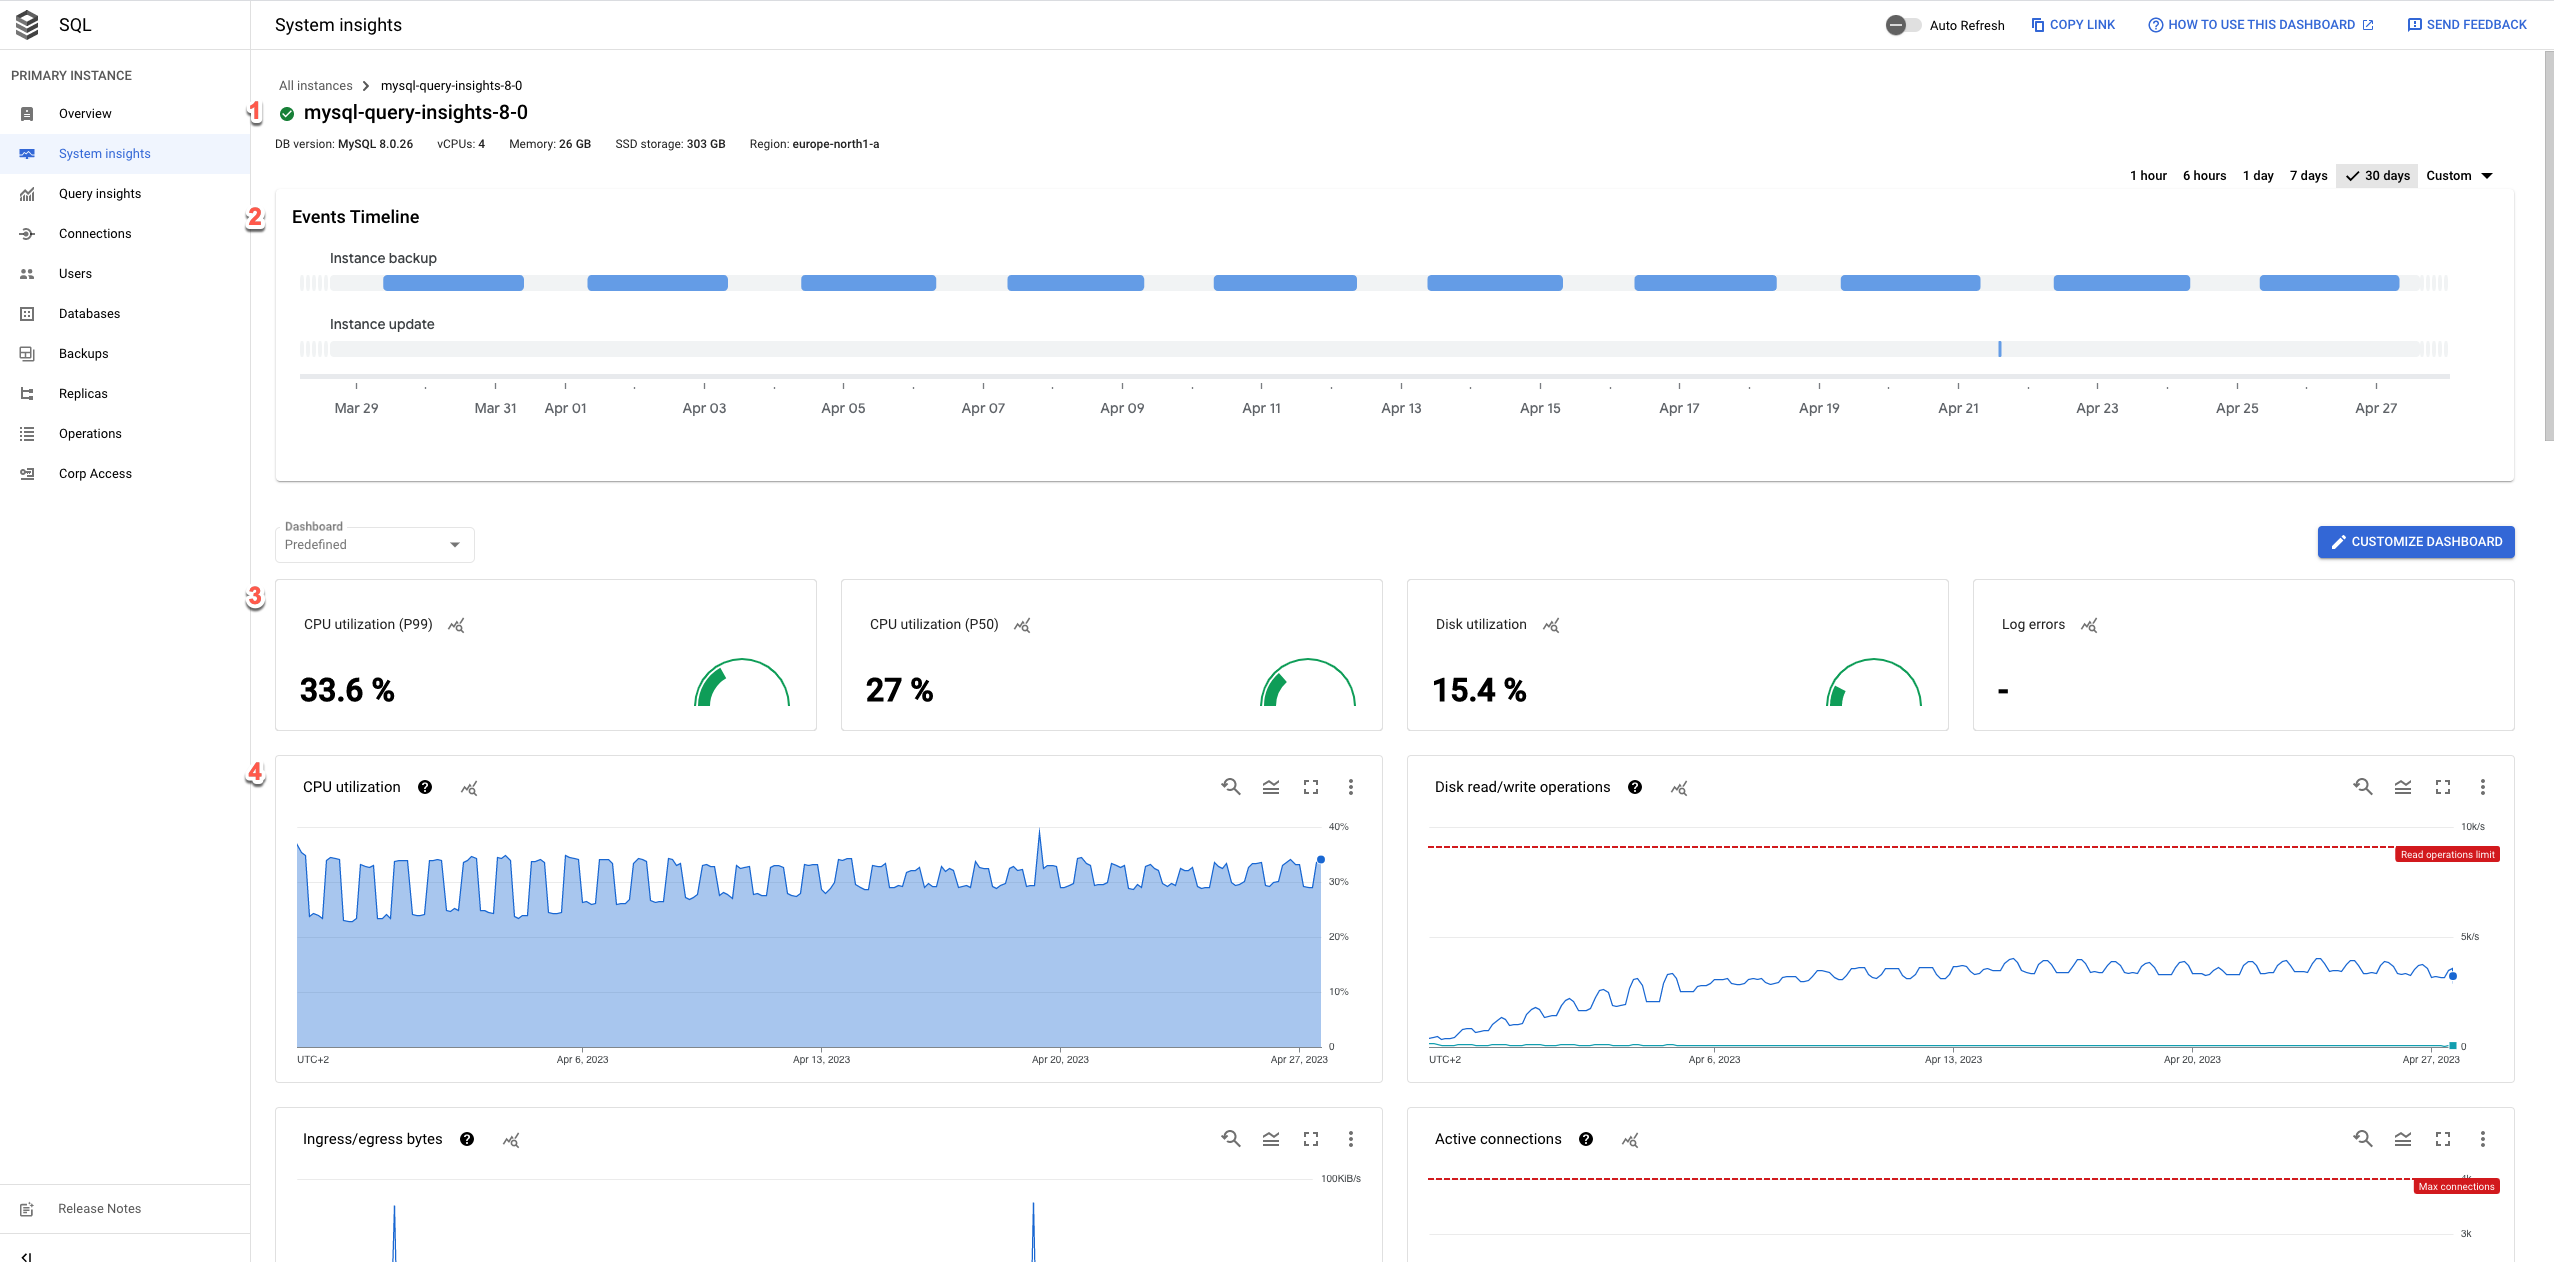
システム分析情報ダッシュボードには、次の情報が表示されます。
インスタンスの詳細
イベントのタイムライン: システム イベントが時系列で表示されます。この情報は、システム イベントがインスタンスの正常性とパフォーマンスに及ぼす影響を評価するのに役立ちます。
概要カード: CPU 使用率、ディスク使用率、ログエラーの指標の最新の値と集計値を表示して、インスタンスの健全性とパフォーマンスの概要を確認できます。
指標グラフ: オペレーティング システムとデータベースの指標に関する情報を示します。スループット、レイテンシ、費用など、いくつかの問題に関する分析情報を得ることができます。
ダッシュボードには、大きく分けて次のオプションがあります。
- カスタマイズされたダッシュボードを作成するには、[ダッシュボードをカスタマイズ] をクリックします。
ダッシュボードを最新の状態に保つには、[
 自動更新] オプションを有効にします。[自動更新] を有効にすると、ダッシュボード データが 1 分ごとに更新されます。この機能は、カスタマイズした期間には対応していません。
タイムセレクタでは、デフォルトで
1 dayが選択されています。期間を変更するには、事前に定義されている他の期間を選択するか、[カスタム] をクリックして開始時刻と終了時刻を定義します。過去 30 日分のデータを利用できます。ダッシュボードの絶対リンクを作成するには、[リンクをコピー] ボタンをクリックします。このリンクは、同じ権限を持つ他の Cloud SQL ユーザーと共有できます。
特定のイベントにアラートを作成するには、 [通知] をクリックします。
特定のアラートを表示するには、[アノテーション] をクリックします。
概要カード
次の表は、システム分析情報ダッシュボードの上部に表示される概要カードを示しています。これらのカードには、選択した期間のインスタンスの正常性とパフォーマンスの概要が表示されます。
| 概要カード | 説明 |
|---|---|
| CPU 使用率 - P50 | P50 の CPU 使用率の値。 |
| CPU 使用率 - P99 | P99 の CPU 使用率の値。 |
| ディスク使用率 | 最新のディスク使用率の値。 |
| ログのエラー | ログに記録されたエラーの数。 |
指標グラフ
各グラフカードのツールバーには、次の標準オプションのセットがあります。
選択した期間の特定の時点の指標値を表示するには、グラフの上にカーソルを移動します。
グラフをズームするには、グラフをクリックし、X 軸に沿って水平方向または Y 軸に沿って垂直方向にドラッグします。ズーム操作を元に戻すには、[ズームをリセット] をクリックします。または、ダッシュボードの上部にある事前定義された期間のいずれかをクリックします。ズーム操作は、ダッシュボード上のすべてのグラフに同時に適用されます。
その他のオプションを表示するには、[more_vert その他のグラフ オプション] をクリックします。多くのグラフには、次のオプションがあります。
グラフを全画面モードで表示するには、[全画面で表示] をクリックします。全画面モードを終了するには、[キャンセル] をクリックします。
凡例を非表示または閉じます。
グラフの PNG ファイルまたは CSV ファイルをダウンロードします。
Metrics Explorer で表示する。Metrics Explorer で指標を表示します。Cloud SQL Database リソースタイプを選択すると、Metrics Explorer で他の Cloud SQL 指標を確認できます。
カスタム ダッシュボードを作成するには、[edit ダッシュボードをカスタマイズ] をクリックして名前を付けます。または、[事前定義] メニューを開いて、既存のカスタム ダッシュボードを選択します。
指標グラフのデータを詳細に表示するには、query_stats [データを探索] をクリックします。ここで、特定の指標をフィルタし、グラフの表示方法を選択できます。
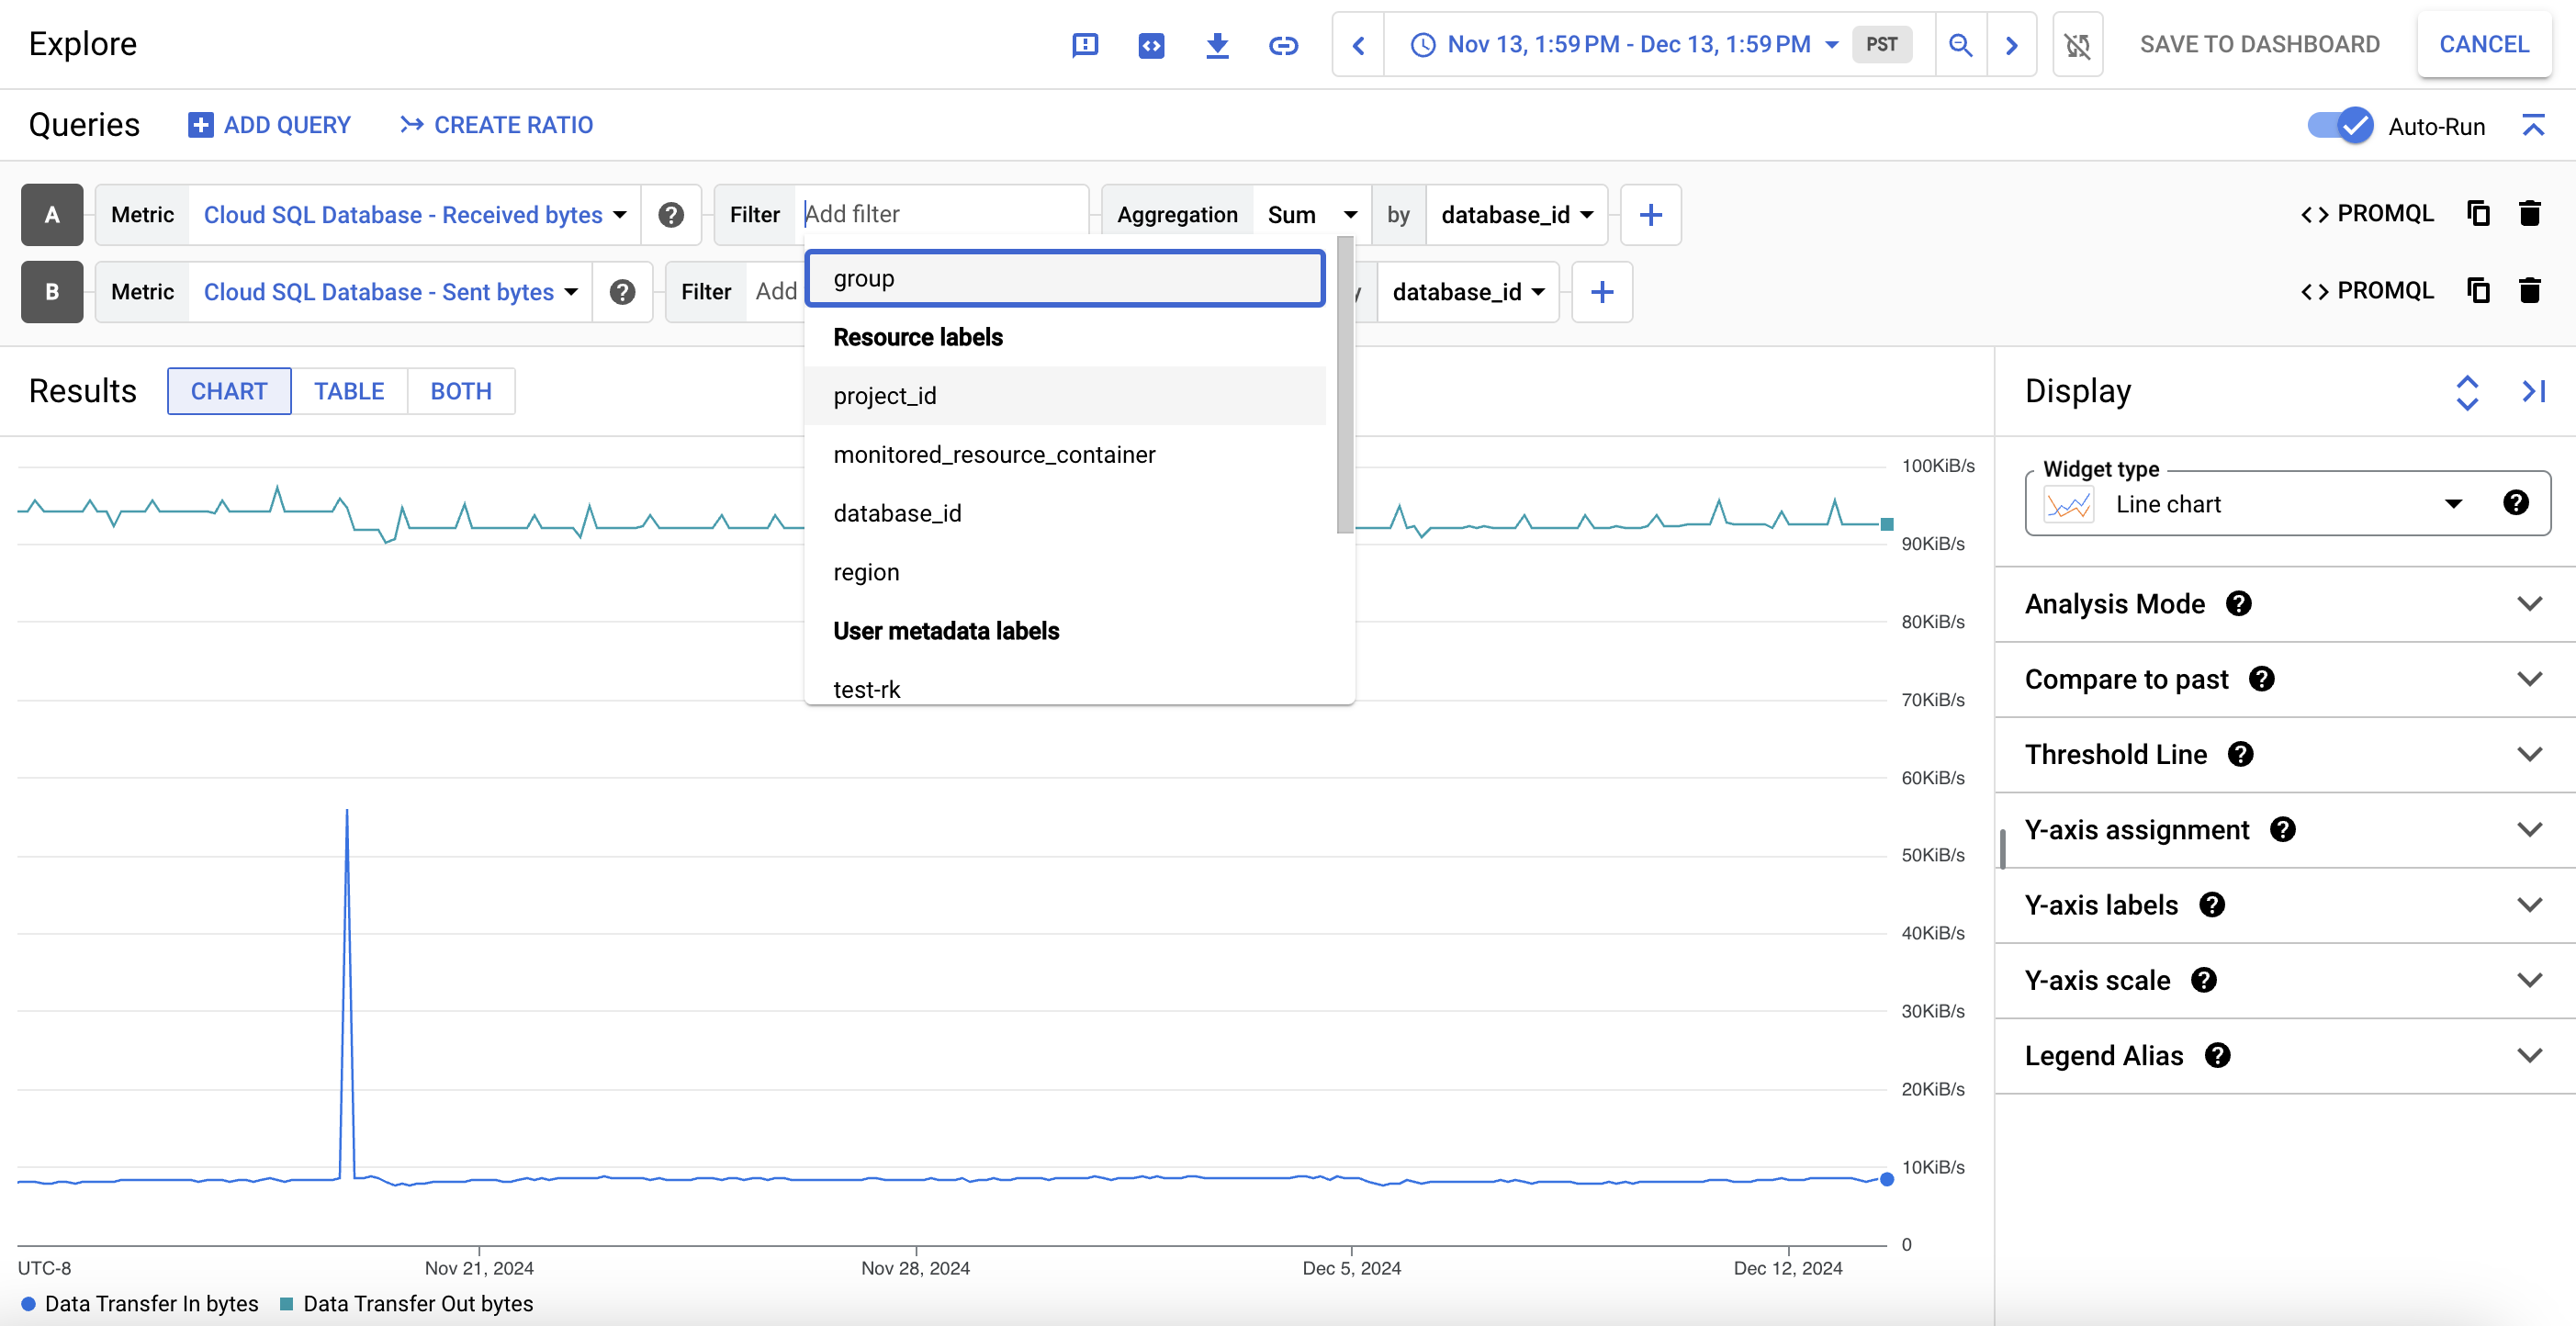
このカスタマイズしたビューを指標グラフとして保存するには、[ダッシュボードに保存] をクリックします。
デフォルトの指標
次の表は、Cloud SQL のシステム情報分析ダッシュボードにデフォルトで表示される Cloud SQL の指標を示したものです。
| 指標名とタイプ | 説明 |
|---|---|
クエリのレイテンシdbinsights.googleapis.com/ |
ユーザーとデータベースごとの P99、P95、P50 別の集計クエリ レイテンシ分布。 クエリ分析情報が有効になっているインスタンスでのみ使用できます。 |
データベース、ユーザー、クライアント アドレスごとのデータベース負荷dbinsights.googleapis.com/ |
データベース、ユーザー、またはクライアント アドレスごとのクエリ実行の累積時間。クエリ実行に関連するすべてのプロセスの CPU 時間、I/O 待機時間、ロック待機時間、プロセス コンテキスト切り替え、スケジューリングの合計です。 クエリ分析情報が有効になっているインスタンスでのみ使用できます。 |
CPU 使用率cloudsql.googleapis.com/ |
現在の CPU 使用率は、現在使用されている予約済みの CPU の割合として表されます。 |
MySQL の接続数cloudsql.googleapis.com/ |
データベース インスタンスが保持する接続数。 |
上り / 下り(内向き / 外向き)のバイト数cloudsql.googleapis.com/cloudsql.googleapis.com/ |
インスタンスとの間の上り(内向き)バイト数(受信バイト数)と下り(外向き)バイト数(送信バイト数)それぞれで示したネットワーク トラフィック。 |
| メモリのコンポーネント
|
データベースで利用可能なメモリ コンポーネント。使用量、キャッシュ、空きメモリです。各メモリ コンポーネントの値は、データベースで使用可能な合計メモリの割合として計算されます。 |
MySQL のクエリ数cloudsql.googleapis.com/
|
サーバーによって実行されたステートメントの数です。これには、ストアド プロシージャや関数などのストアド プログラム内で実行されるステートメントが含まれます。 |
MySQL のクエスチョン数cloudsql.googleapis.com/
|
サーバーによって実行されたステートメントの数です。これには、クライアントによってサーバーに送信されたステートメントのみが含まれ、ストアド プログラム内で実行されるステートメントは含まれません。 |
MySQL のネットワーク トラフィックcloudsql.googleapis.com/cloudsql.googleapis.com/
|
クライアントから送受信されたバイト数。 |
InnoDB のページ数
|
InnoDB バッファプール内のダーティページ、フリーページ、合計ページの数。InnoDB バッファプールのダーティページとは、メモリ内で変更されたが、ディスクには書き戻されないページのことです。InnoDB バッファプールのフリーページとは、データが含まれず、未使用のページのことです。 |
| InnoDB fsync 呼び出し数
|
InnoDB fsync オペレーションの数。 |
| InnoDB ログ fsync 呼び出し数
|
InnoDB redo ログファイルに対して実行された fsync オペレーションの数。 |
InnoDB ページの読み取り / 書き込みcloudsql.googleapis.com/cloudsql.googleapis.com/
|
InnoDB ページの読み取りと書き込みの回数。 |
MySQL の開いているテーブルのキャッシュcloudsql.googleapis.com/cloudsql.googleapis.com/
|
open_tables は、現在開いているテーブルの数です。opened_table_count は、最後のサンプル以降にデータベースが開いたテーブルの数です。opened_table_count の値が一貫して高い場合は、table_open_cache の値を増やすことをおすすめします。 |
MySQL のテーブル定義キャッシュcloudsql.googleapis.com/database/cloudsql.googleapis.com/database/
|
open_table_definitions は、現在開いているテーブル定義の数です。opened_table_definitions_count は、最後のサンプル以降、データベースでテーブル定義が開かれた回数です。opened_table_definitions_count の値が一貫して高い場合は、table_definition_cache の値を増やすことをおすすめします。 |
| InnoDB データ ディクショナリのメモリ使用量
|
InnoDB データ ディクショナリ キャッシュのメモリ使用量です。InnoDB には、テーブル、列、インデックス、外部キーなど、データベース オブジェクトに関する情報を保存する独自のキャッシュがあります。table_definition_cache は、このキャッシュ内のテーブル数にソフトリミットを設定します。ただし、外部キーの関係を持つテーブルは、データベースがシャットダウンまたは再起動されるまでキャッシュに保存されます。インスタンスに外部キーの関係を持つテーブルが多くある場合、このキャッシュは大量のメモリを消費する可能性があります。 |
ディスク ストレージ(タイプ別)cloudsql.googleapis.com/ |
data、binlog、tmp_data などのデータ型ごとのインスタンス ディスク使用量の内訳。この指標は、ストレージ費用の把握に役立ちます。ストレージの使用料金について詳しくは、ストレージとネットワークの料金をご覧ください。ポイントインタイム リカバリ(PITR)ではバイナリログが使用されます。Cloud SQL が新しいログを定期的に生成し、これらのログは保存容量を使用します。Cloud SQL は、バイナリログとそれに関連する自動バックアップを自動的に削除します。これは通常、 transactionLogRetentionDays に設定された保持値が満たされた後に行われます。transactionLogRetentionDays は、Cloud SQL がトランザクション ログを保持する日数です。値の範囲は 1~7 です。PITR の使用中に予期しないストレージの問題を回避するには、ストレージの自動増量を有効にすることをおすすめします。 |
ディスク読み取り / 書き込みオペレーションcloudsql.googleapis.com/cloudsql.googleapis.com/
|
read_ops_count は、ディスク読み取り I/O オペレーションの差分数を示します。この指標を使用すると、インスタンスが環境に適したサイズかどうかを判断できます。必要な場合はさらに大きいマシンタイプに切り替えて、キャッシュから提供されるリクエストを増やし、レイテンシを短縮できます。write_ops_count は、ディスク書き込み I/O オペレーションの差分数を示します。Cloud SQL インスタンス(レプリカを除く)では、およそ 1 秒間に 1 回システム テーブルに書き込まれます。
|
Cloud Logginglogging.googleapis.com/
|
エラーと警告のログエントリの合計数を表示します。 |
詳細については、Cloud SQL の指標をご覧ください。
イベントのタイムライン
ダッシュボードには、次のイベントの詳細が表示されます。
| イベント名 | 説明 | オペレーションのタイプ |
|---|---|---|
Instance restart |
Cloud SQL インスタンスの再起動 | RESTART |
Instance failover |
高可用性(HA)プライマリ インスタンスから、プライマリ インスタンスになるスタンバイ インスタンスへの手動フェイルオーバーを開始します。 | FAILOVER |
Instance maintenance |
インスタンスが現在メンテナンス中であることを示します。通常、メンテナンスを行うとインスタンスは 1~3 分間使用できなくなります。 | MAINTENANCE |
Instance backup |
インスタンスのバックアップを実行します。 | BACKUP_VOLUME |
Instance update |
Cloud SQL インスタンスの設定を更新します。 | UPDATE |
Promote replica |
Cloud SQL レプリカ インスタンスを昇格させます。 | PROMOTE_REPLICA |
Start replica |
Cloud SQL 読み取りレプリカ インスタンスでレプリケーションを開始します。 | START_REPLICA |
Stop replica |
Cloud SQL 読み取りレプリカ インスタンスでレプリケーションを停止します。 | STOP_REPLICA |
Recreate replica |
Cloud SQL レプリカ インスタンスのリソースを再作成します。 | RECREATE_REPLICA |
Create replica |
Cloud SQL レプリカ インスタンスを作成します。 | CREATE_REPLICA |
Data import |
Cloud SQL インスタンスにデータをインポートします。 | IMPORT |
Instance export |
データを Cloud SQL インスタンスから Cloud Storage バケットにエクスポートします。 | EXPORT |
Restore backup |
Cloud SQL インスタンスのバックアップを復元します。このオペレーションにより、インスタンスが再起動する可能性があります。 | RESTORE_VOLUME |