数据库可观测性用于衡量根据数据库系统在日志、指标和跟踪记录中生成的数据或遥测推断数据库系统的内部状态的准确程度。
在应用中发生的问题涉及数据库时,诊断和问题排查尤其困难且特别耗时。遥测收集至关重要。遥测经过应用上下文充实后,可以使数据库实例更易于理解、可观测且更易于维护。您可以轻松识别问题和趋势,并尽早采取补救措施,而不会造成代价高昂的停机。此外,使用此类数据,您还可以配置较新的数据库实例,以从它们启动的那一刻起收集正确类型的数据。
您可以高效利用数据,主动预防问题并专注于战略性创新。良好的遥测数据收集在 DevOps 模型中特别有用,数据库专家需要在该模型中独立分析遥测数据,以监控、评估和优化其快速发展的应用的性能和健康状况。
Google Cloud 提供了多种跨四个迭代可观测性阶段的强大功能,可帮助您维护 Cloud SQL 数据库的健康状况。
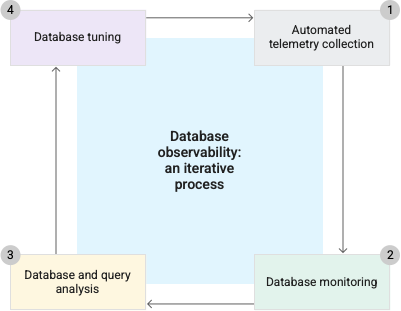
自动遥测收集
为了实现可观测性目标,我们首先收集遥测,最好是通过自动化的过程进行。进行一段时间的收集后,遥测数据可帮助您为不同负载条件下的指标建立基准。
Google Cloud 服务会自动生成可观测性数据,包括指标、日志和跟踪记录,这有助于提供完整的可观测性概览。
Cloud Monitoring 会收集您的服务和您使用的 Google Cloud 资源的测量结果。Cloud SQL 会使用内置内存自定义代理来收集查询遥测数据,从而降低对性能的影响并消除对代理维护或安全开销的需求。
Cloud Logging 会从常见应用组件收集日志记录数据。对于 Cloud SQL,另请参阅查看实例日志。
Cloud Trace 可从应用收集延迟数据和已执行的查询计划,以帮助您跟踪请求如何在您的应用中传播。您可以比较一段时间内或不同版本之间的这些延迟分布情况。如果对您的应用进行了插桩处理以使用 Cloud Trace,则当 Cloud Trace 检测到您的应用的延迟情况发生明显变化时会向您发出提醒。
Sqlcommenter 是一个用于数据库的 OpenTelemetry 库,可帮助您从应用的视角监控数据库。Sqlcommenter 会自动对 ORM 进行插桩处理,以使用标记增强 SQL 语句,并允许将 OpenTelemetry 跟踪记录上下文信息传播到数据库。
借助数据库中的标记和跟踪记录应用上下文,您可以轻松将应用代码与数据库性能相关联,并排查基于微服务的架构的问题。
数据库监控
适当的监控可帮助您确定应用是否以最佳方式运行。尽早实现监控,例如在启动迁移之前或将新应用部署到生产环境之前。区分应用问题与底层云问题。
Cloud SQL 概览页面显示一些关键指标的图表。
Cloud SQL 还有助于您比较指标(针对选定实例)。
您可以使用 Cloud Monitoring 创建自定义信息中心,用于帮助您监控指标和设置提醒政策,以便您能够及时收到通知。
数据库和查询分析
Cloud SQL Query Insights 工具提供监控和诊断功能,可让您检测和修复查询性能问题。
Query Insights 信息中心可帮助您提早确定查询性能问题,并且您只需使用一个界面即可从检测转为解决。内置的直观查询计划有助于您排查问题,找到根本原因。您还可以使用上下文中的端到端应用跟踪来找到有问题的查询的来源。
查询数据分析提供以应用为中心的监控功能,可帮助您诊断使用对象关系映射 (ORM) 构建的应用的性能问题。您可以使用查询关联的业务逻辑(如付款、商品目录、业务分析或运费)标记查询。Query Insights 可与现有 APM 工具集成,让您可以使用自己喜欢的工具监控和排查查询问题。
查询数据分析工具使用 sqlcommenter 自动对 ORM 进行插桩。此插桩可帮助您识别导致问题的应用代码。Query Insights 支持 OpenTelemetry 标准,并通过 Google Cloud Observability API 为 APM 工具提供查询指标和跟踪记录数据。
Query Insights 与 Cloud Monitoring 集成,让您可以为查询指标或标记创建自定义信息中心和提醒,并使用电子邮件、短信、Slack、PagerDuty 等接收通知。
数据库调整
您可以采用迭代方式排查并调整数据库。
Cloud SQL Recommender 可帮助您分析数据库的当前使用情况,并根据启发式方法和机器学习提供建议和数据洞见。
Cloud SQL Recommender 简要说明如下:
| 名称 | 说明 |
|---|---|
| 磁盘空间不足 Recommender | 降低 Cloud SQL 实例用尽磁盘可用空间导致的停机风险。 |
| 空闲实例 Recommender | 通过关闭无意中空闲的 Cloud SQL 实例来降低费用。 |
| 超额预配的实例 Recommender | 通过调整对于给定工作负载而言过大的 Cloud SQL 实例大小来降低费用。 |
| 预配不足的实例 Recommender | 通过调整 CPU 和/或内存用量较高的 Cloud SQL 实例的大小,避免高 CPU 和内存用量造成的瓶颈,并最大限度地降低发生内存不足事件的可能性。 |
| 大量打开的表 Recommender | 通过为 Cloud SQL 实例增加表打开缓存的大小来优化实例的性能,这些实例的打开表数等于表打开缓存并且同时打开的表太多。 |
| 大量表 Recommender | 通过减少表数过多且接近服务等级协议 (SLA) 限制的 Cloud SQL 实例的表数来优化实例的性能。 |
后续步骤
- 查看 Cloud SQL 指标列表。
- 详细了解 Cloud Logging 和 Cloud Monitoring。另请参阅查看实例日志。
- 排查并调整数据库实例。
- 详细了解 Google Cloud Recommender。