使用 OpenTelemetry Collector 附加元件寫入 OTLP 指標


本教學課程說明如何撰寫、部署及呼叫 Cloud Run 服務,並使用 Google 建構的 OpenTelemetry Collector 做為補充資訊,將自訂 OTLP 指標回報給 Google Cloud Managed Service for Prometheus。如要瞭解 Google 建立的 Collector,請參閱「Google 建立的 OpenTelemetry Collector 總覽」。

如果 Cloud Run 服務會回報 Prometheus 指標,請改用 Cloud Run 的 Prometheus 補充資訊

目標

  • 撰寫、建構服務,並將服務部署到 Cloud Run,同時將 Google 建構的 OpenTelemetry Collector 做為補充資訊。
  • 產生自訂指標,並向 Google Cloud Managed Service for Prometheus 回報。

費用

在本文件中,您會使用 Google Cloud的下列計費元件:

如要根據預測用量估算費用,請使用 Pricing Calculator

初次使用 Google Cloud 的使用者可能符合免費試用資格。

事前準備

  1. Sign in to your Google Cloud account. If you're new to Google Cloud, create an account to evaluate how our products perform in real-world scenarios. New customers also get $300 in free credits to run, test, and deploy workloads.
  2. In the Google Cloud console, on the project selector page, select or create a Google Cloud project.

    Go to project selector

  3. Make sure that billing is enabled for your Google Cloud project.

  4. In the Google Cloud console, on the project selector page, select or create a Google Cloud project.

    Go to project selector

  5. Make sure that billing is enabled for your Google Cloud project.

  6. Enable the Cloud Run, Cloud Monitoring, Artifact Registry, and Cloud Build APIs.

    Enable the APIs

  7. 安裝並初始化 gcloud CLI
  8. 更新 Google Cloud CLI:gcloud components update
  9. 必要的角色

    如要取得完成本教學課程所需的權限,請要求管理員為您授予專案的下列 IAM 角色:

    如要進一步瞭解如何授予角色,請參閱「管理專案、資料夾和機構的存取權」。

    您或許還可透過自訂角色或其他預先定義的角色取得必要權限。

    另請注意,Cloud Run 服務身分需要「Monitoring 指標寫入者」 (roles/monitoring.metricWriter) 角色。Compute Engine 預設服務帳戶可能預設具備這個角色,但如果您已變更其權限或使用其他服務帳戶,可能需要新增這個角色。

設定 gcloud 預設值

如要針對 Cloud Run 服務設定 gcloud 的預設值:

  1. 設定您的預設專案:

    gcloud config set project PROJECT_ID

    PROJECT_ID 改為您為本教學課程建立的專案名稱。

  2. 為所選區域設定 gcloud:

    gcloud config set run/region REGION

    REGION 改為您所選擇的支援 Cloud Run 地區

Cloud Run 位置

Cloud Run 具有「地區性」,這表示執行 Cloud Run 服務的基礎架構位於特定地區,並由 Google 代管,可為該地區內所有區域提供備援功能。

選擇 Cloud Run 服務的執行地區時,請將延遲時間、可用性或耐用性需求做為主要考量。一般而言,您可以選擇最靠近使用者的地區,但您應考量 Cloud Run 服務所使用的其他 Google Cloud 產品位置。使用分散在不同位置的 Google Cloud 產品,可能會影響服務的延遲時間和費用。

Cloud Run 可在下列地區使用:

採用級別 1 定價

採用級別 2 定價

如果您已建立 Cloud Run 服務,即可在 Google Cloud 控制台的 Cloud Run 資訊主頁中查看地區。

建立 Artifact Registry 映像檔存放區

建立 Artifact Registry Docker 存放區,用於代管範例服務映像檔:

gcloud artifacts repositories create run-otel \
    --repository-format=docker \
    --location=REGION \
    --project=PROJECT_ID

更改下列內容:

  • PROJECT_ID 改為您為本教學課程建立的專案名稱。
  • REGION REGION 改為您所選擇的支援 Cloud Run 地區

擷取程式碼範例

如要擷取要使用的程式碼範例:

  1. 將應用程式存放區範例複製到本機電腦中:

    Go

    git clone https://github.com/GoogleCloudPlatform/golang-samples.git

    您也可以 下載 zip 格式的範例,然後解壓縮該檔案。

  2. 變更為包含 Cloud Run 程式碼範例的目錄:

    Go

    cd golang-samples/run/custom-metrics/

檢查程式碼

本教學課程的程式碼包含下列項目:

  • 處理傳入要求並產生名為 sidecar_sample_counter_total 的指標。
package main

import (
	"context"
	"fmt"
	"log"
	"net/http"
	"os"

	"go.opentelemetry.io/otel/exporters/otlp/otlpmetric/otlpmetricgrpc"
	"go.opentelemetry.io/otel/metric"
	sdkmetric "go.opentelemetry.io/otel/sdk/metric"
	"go.opentelemetry.io/otel/sdk/resource"
	semconv "go.opentelemetry.io/otel/semconv/v1.24.0"
)

var counter metric.Int64Counter

func main() {
	ctx := context.Background()
	shutdown := setupCounter(ctx)
	defer shutdown(ctx)

	port := os.Getenv("PORT")
	if port == "" {
		port = "8080"
		log.Printf("defaulting to port %s", port)
	}

	http.HandleFunc("/", handler)
	log.Fatal(http.ListenAndServe(":"+port, nil))
}

func handler(w http.ResponseWriter, r *http.Request) {
	counter.Add(context.Background(), 100)
	fmt.Fprintln(w, "Incremented sidecar_sample_counter_total metric!")
}

func setupCounter(ctx context.Context) func(context.Context) error {
	serviceName := os.Getenv("K_SERVICE")
	if serviceName == "" {
		serviceName = "sample-cloud-run-app"
	}
	r, err := resource.Merge(
		resource.Default(),
		resource.NewWithAttributes(
			resource.Default().SchemaURL(),
			semconv.ServiceName(serviceName),
		),
	)
	if err != nil {
		log.Fatalf("Error creating resource: %v", err)
	}

	exporter, err := otlpmetricgrpc.New(ctx,
		otlpmetricgrpc.WithInsecure(),
	)
	if err != nil {
		log.Fatalf("Error creating exporter: %s", err)
	}
	provider := sdkmetric.NewMeterProvider(
		sdkmetric.WithReader(sdkmetric.NewPeriodicReader(exporter)),
		sdkmetric.WithResource(r),
	)

	meter := provider.Meter("example.com/metrics")
	counter, err = meter.Int64Counter("sidecar-sample-counter")
	if err != nil {
		log.Fatalf("Error creating counter: %s", err)
	}
	return provider.Shutdown
}
  • 定義服務作業環境的 Dockerfile
FROM golang:1.23 as builder
WORKDIR /app
COPY . .
RUN CGO_ENABLED=0 GOOS=linux go build -o sample-app

FROM alpine:3
RUN apk add --no-cache ca-certificates
COPY --from=builder /app/sample-app /sample-app
CMD ["/sample-app"]

範例也包含 collector 子目錄下的檔案,用於建構自訂收集器:

  • 收集器的設定檔。

    receivers:
      otlp:
        protocols:
          grpc:
          http:
    
    processors:
      batch:
        # batch metrics before sending to reduce API usage
        send_batch_max_size: 200
        send_batch_size: 200
        timeout: 5s
    
      memory_limiter:
        # drop metrics if memory usage gets too high
        check_interval: 1s
        limit_percentage: 65
        spike_limit_percentage: 20
    
      # automatically detect Cloud Run resource metadata                                                                                                                                               
      resourcedetection:
        detectors: [env, gcp]
        timeout: 2s
        override: false
    
      resource:
        attributes:
        # add instance_id as a resource attribute
        - key: service.instance.id
          from_attribute: faas.id
          action: upsert
          # parse service name from K_SERVICE Cloud Run variable                                                                                                                                       
        - key: service.name
          value: ${env:K_SERVICE}
          action: insert
    
    exporters:
      googlemanagedprometheus: # Note: this is intentionally left blank   
    
    extensions:
      health_check:
        endpoint: 0.0.0.0:13133
    service:
      extensions: [health_check]
      pipelines:
        metrics:
          receivers: [otlp]
          processors: [batch, memory_limiter, resourcedetection, resource]
          exporters: [googlemanagedprometheus]
  • Dockerfile:將提供的設定檔組合到上游 Collector 映像檔中。

    FROM us-docker.pkg.dev/cloud-ops-agents-artifacts/google-cloud-opentelemetry-collector/otelcol-google:0.121.0
    
    COPY collector-config.yaml /etc/otelcol-google/config.yaml

推送程式碼

推送程式碼包含三個步驟:使用 Cloud Build 建構容器映像檔、將容器映像檔上傳到 Artifact Registry,然後將容器映像檔部署到 Cloud Run。

如要推送程式碼:

  1. 建構範例服務容器,並在 Artifact Registry 上發布:

    gcloud builds submit --tag REGION-docker.pkg.dev/PROJECT_ID/run-otel/sample-metrics-app

    若成功執行,您應會看到包含 ID、建立時間和映像檔名稱的「SUCCESS」(成功) 訊息。映像檔會儲存在 Artifact Registry 中,日後如有需要,可以重複使用。

  2. 建構 Collector 容器並發布至 Artifact Registry:

    gcloud builds submit collector --tag REGION-docker.pkg.dev/PROJECT_ID/run-otel/otel-collector-metrics

    若成功執行,您應會看到包含 ID、建立時間和映像檔名稱的「SUCCESS」(成功) 訊息。映像檔會儲存在 Artifact Registry 中,日後如有需要,可以重複使用。

  3. 部署應用程式:

    YAML

    1. 建立名為 service.yaml 的新檔案,並加入下列內容:

      apiVersion: serving.knative.dev/v1
      kind: Service
      metadata:
        name: SERVICE-NAME
        annotations:
          run.googleapis.com/launch-stage: BETA
      spec:
        template:
          metadata:
            annotations:
              run.googleapis.com/container-dependencies: "{app:[collector]}"
          spec:
            containers:
            - image: REGION-docker.pkg.dev/PROJECT_ID/run-otel/sample-metrics-app
              name: app
              ports:
              - containerPort: CONTAINER_PORT
              env:
              - name: "OTEL_EXPORTER_OTLP_ENDPOINT"
                value: "http://localhost:4317"
            - image: REGION-docker.pkg.dev/PROJECT_ID/run-otel/otel-collector-metrics
              name: collector
              startupProbe:
                httpGet:
                  path: /
                  port: 13133
      
    2. 取代下列項目:
  4. 使用下列指令建立新服務:

    gcloud run services replace service.yaml

    這項指令會傳回服務網址。使用這個網址,在「試用」中試用範例應用程式。

立即體驗

使用「運送程式碼」一節中 gcloud run 指令的網址連線至服務,產生一些範例指標 (您可以多次執行這項指令,產生更有趣的資料):

curl -H \
"Authorization: Bearer $(gcloud auth print-identity-token)" \
SERVICE_URL

SERVICE_URL 改為服務的網址。

接著,前往 Google Cloud 控制台的 Cloud Monitoring 專區,選取「指標探索工具」,然後選取 sidecar_sample_counter_total 指標。

Metrics Explorer UI 中顯示的自訂指標

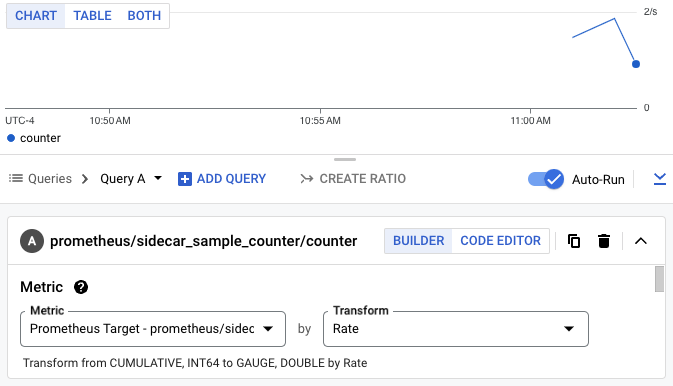
您也可以使用 PromQL 查詢指標。舉例來說,下列查詢會根據 Cloud Run 執行個體 ID 篩選指標:

sidecar_sample_counter_total{instance="INSTANCE_ID"}

INSTANCE_ID 替換為服務的任何執行個體 ID (可從執行個體記錄或中繼資料伺服器取得)。

這項查詢會產生類似下方的圖表:

PromQL 查詢的自訂指標

清除所用資源

如果您是為了這個教學課程建立新專案,請刪除專案。如果您使用現有專案,並想保留專案,但不要本教學課程新增的變更,請刪除為本教學課程建立的資源

刪除專案

如要避免付費,最簡單的方法就是刪除您為了本教學課程所建立的專案。

如要刪除專案:

  1. In the Google Cloud console, go to the Manage resources page.

    Go to Manage resources

  2. In the project list, select the project that you want to delete, and then click Delete.
  3. In the dialog, type the project ID, and then click Shut down to delete the project.

刪除教學課程資源

  1. 刪除您在本教學課程中部署的 Cloud Run 服務:

    gcloud run services delete SERVICE-NAME

    其中 SERVICE-NAME 是您選擇的服務名稱。

    您也可以從Google Cloud 控制台刪除 Cloud Run 服務。

  2. 移除您在教學課程設定期間新增的 gcloud 預設區域設定:

     gcloud config unset run/region
    
  3. 移除專案設定:

     gcloud config unset project
    
  4. 刪除在本教學課程中建立的其他 Google Cloud 資源:

後續步驟

如需更多範例 (包括追蹤記錄和記錄檔的範例),請前往 GitHub