This page describes how to monitor your Memorystore for Memcached instance's performance.
Monitoring allows you to check in on your instances to make sure they're behaving as desired. This guide covers a few basic examples of monitoring Memcached instances. In addition to the types of monitoring covered here, Memorystore for Memcached is compatible with open source Memcached, so you can use existing Memcached monitoring tools from Compute Engine VMs to monitor your instances.
Monitoring instances in the Google Cloud console
To view an instance's core metrics:
- Go to the Memorystore for Memcached page in the Google Cloud console.
Memorystore for Memcached - Click the Instance ID of the instance you'd like to view.
You can monitor several metrics by visiting an instance's Instance details page in the Google Cloud console. By default, the graph shows the instance's current memory usage and its max capacity. Other metrics available in the Google Cloud console are: Active Connections, Memory Usage, CPU Usage Time, Hit Ratio, Items, Eviction Count, Operation Count, Received Bytes, Sent Bytes, Uptime, Unused Memory, Get Operations, Set Operations, and Delete Operations.
To change the metrics shown on the graph, use the dropdown in its upper left corner. To change the time frame, select a different period of time in the upper right corner of the graph.
Using Cloud Monitoring
Cloud Monitoring is a monitoring service that allows you to view metrics such as uptime for your Memcached instances. For more details about all Memorystore for Memcached metrics available from Cloud Monitoring, see the Monitoring reference documentation.
Signing up for Cloud Monitoring
To access the monitoring console, click Monitoring in the Google Cloud console navigation pane:
For pricing information, see Cloud Monitoring pricing.
Viewing instance uptime, restart, and failover information in Monitoring
To view instance uptime information, use Metrics Explorer:
Go to the Google Cloud console, login and navigate to the project with your Memcached instances:
Select Monitoring from the left navigation menu.
In Monitoring, if the navigation pane isn't expanded, click Expand last_page. This button is located on the lower left of the console.
If Metrics Explorer is shown in the navigation pane, click Metrics Explorer. Otherwise, select Resources and then select Metrics Explorer.
In the Find resource type and metric field, enter
memcache.googleapis.com/node/uptime.
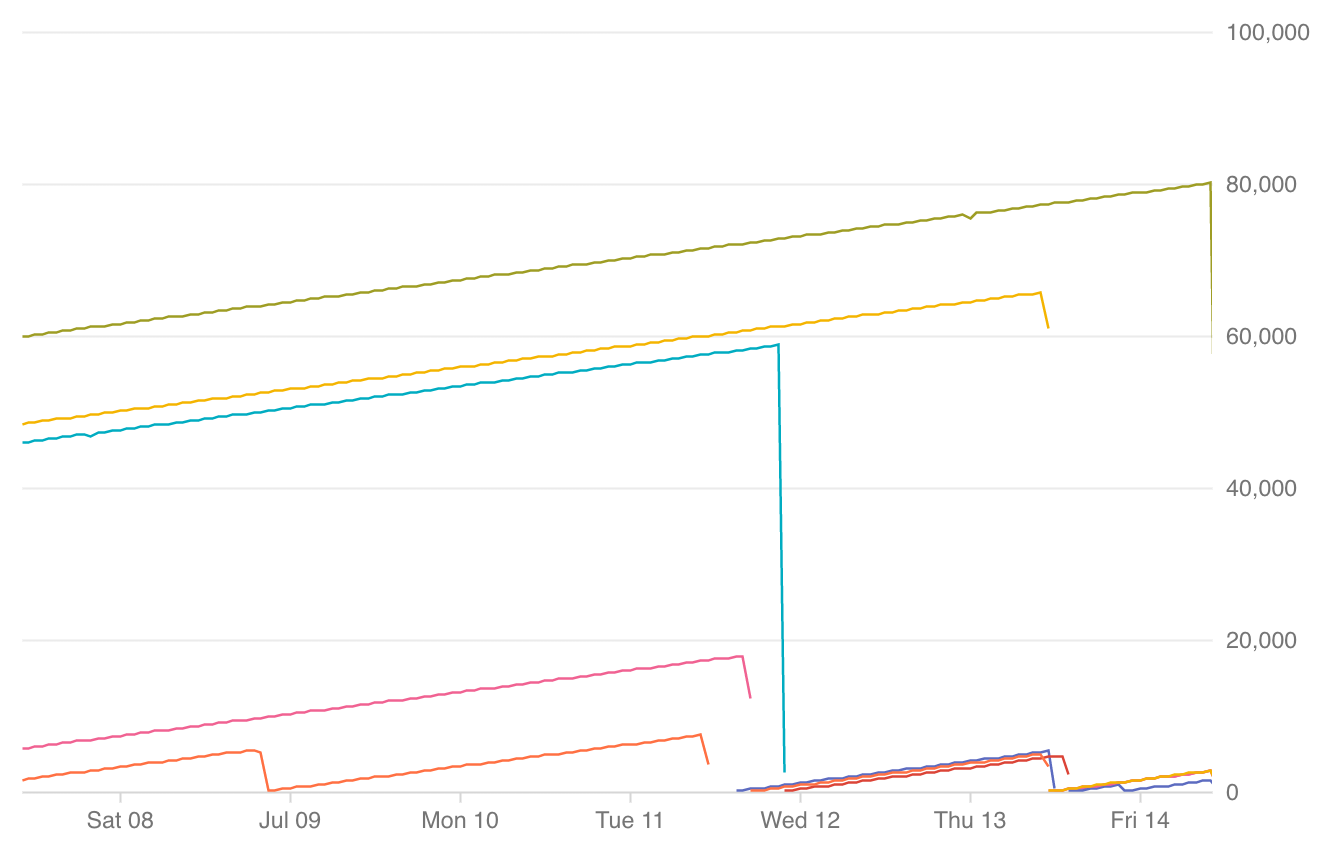
Your graph looks something like this:

- Each line indicates a single instance.
- Up and to the right indicates Memcached is up.
- A drop off indicates a restart.
- Missing data indicates unavailability.
- Below your graph, there's a color-coded key that indicates which line belongs to which instance. As you hover over the key, the corresponding line on the graph is highlighted.
You can change the time horizon in the upper-right hand corner as well as add filters to tailor the information you're seeing to a particular region, project, instance, or node.
Viewing operations per second
To view an instance's operations per second, use Metrics Explorer:
Go to the Google Cloud console, login and navigate to the project with your Memcached instances:
Select Monitoring from the left navigation menu.
In Monitoring, if the navigation pane isn't expanded, click Expand last_page. This button is located on the lower left of the console.
If Metrics Explorer is shown in the navigation pane, click Metrics Explorer. Otherwise, select Resources and then select Metrics Explorer.
Select Memcached instance as the resource type.
Enter
memcache.googleapis.com/node/operation_countin the Find resource type and metric field.Choose Sum from the aggregation drop-down menu.
Creating a dashboard to monitor Memcached memory usage
In the Google Cloud console, select Monitoring, or use the following button:
Select Dashboards > Create Dashboard.
Provide a name for the dashboard, e.g. "Memcached Dashboard", and click Confirm.
Click Add Chart.
Provide a chart title. For example, "Memcached Memory Usage".
In the search box labeled Find resource type and metric, search for "Memorystore Memcached Node", and select the metric.
- Enter "Cache memory" as the metric type.
- In the Filter box, add a filter for instance_id and select the instance you want to monitor.
- If you want to monitor the usage of all the Memorystore instances in your project, use Group by and select instance_id.
- Enter "Cache memory" as the metric type.
Click Save. You can access this dashboard from the dashboards tab in the Monitoring UI.
Setting a Monitoring alert for a metric
This section explains how to set an alert in Monitoring for an individual metric.
To create an alert for a metric:
In the Google Cloud console, select Monitoring, or use the following button:
Click Alerting from the left navigation menu.
Click the Create Policy button.
Enter a Policy name.
Click Add Condition.
- Provide a name for the condition, for example "Memory Usage Alert".
- Under Target, select Memorystore Memcached Node instance resource type.
- Select the desired metric. For example, select "Memory Usage".
- Under Configuration, choose your desired condition.
- For example, for Memory Usage you can choose Any time the series violates.
- Select values for Condition triggers if, Threshold, and duration
(labeled as For).
- For example, use the Condition, is above, and set Threshold to the equivalent, in bytes, of 80% of your instance size. Set For to 1 minute initially to understand the usage pattern.
- Click Add.
Set up a notification channel:
- Click the Add notification channel button.
- Option 1) Choose Email from the Notification Channel Type menu.
- Enter the email address where you want your alerts sent.
- Option 2) See Creating channels for instructions on setting up other types of notification channels.
- Option 1) Choose Email from the Notification Channel Type menu.
- Click the Add notification channel button.
Click the Save button.
Viewing Memcached logs
Memcached produces logs that Cloud Logging captures.
Viewing audit logs
Go to the Logs Explorer page in the Google Cloud console.
To view the audit logs, select Audited Resource > memcached.googleapis.com from the resources drop-down.
What's next
- View available Memcached metrics.
- View available Memcached configurations.
