The Custom Visualization Builder (CVB) is a playground that gives developers an environment to build and test their custom visualization before adding it into Looker. Here's an example of how you can use this tool.

The CVB has two sides:
- The left side where you will write the Javascript code of your visualization
- The right side which is also divided into two sections:
- The top section has the following tabs:
- Query Response: were you can add the JSON format of your query response.
- Raw Data. You must enter here an array of the data returned by Looker.
- Dependencies which is also a mandatory tab thus you need to enter a string array with the CDN links of all the dependencies that your visualization needs.
- The bottom section where the resulting visualization is displayed.
- The top section has the following tabs:
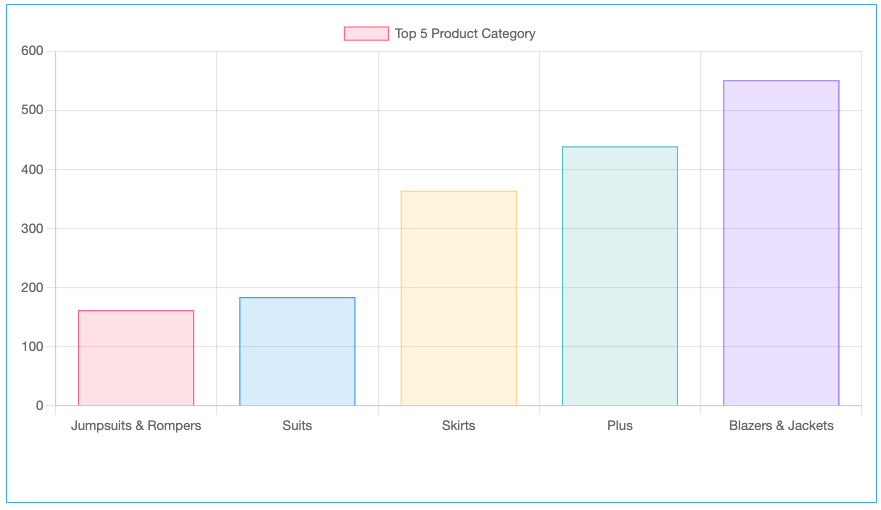
Let's say that you want to build the following visualization using the Chart.js library:
The visualization object has two properties that are required: create and updateAsync function. This tutorial will focus on the later which is a function that is called every time the state of your visualization may need to change. It will always be called after create, and may be called many times.
Step 1: Extract and prepare the data
The data will be passed to the updateAsync function via its first parameter, conventionally named data. The code below loops through each element of this data object and pushes the data values into an actual_data array and the labels into a data_labels array. These two arrays will be used later to draw the visualization.
const data_labels = []
const actual_data = []

data.forEach((d)=>{
     data_labels.push(d["Products Category"])
     actual_data.push(d["Products Count"])
})
Step 2: Append the visualization to the page
Chart.js needs a canvas to render the visualization onto the page. You need to create a canvas element with an id of your choice (myChart is used for this tutorial), then append this canvas to the div element that the CVB uses to render the visualization. This div has an id attribute named vis.
const vizCanvas = document.createElement('canvas')
vizCanvas.setAttribute("id", "myChart")

const vizDiv = document.getElementById("vis")
vizDiv.appendChild(vizCanvas)
Step 3: Draw the visualization on the page
Now that you have a canvas element on the page with an id of myChart, you can target this element and draw the visualization like this:
const ctx = document.getElementById("myChart")
const myChart = new Chart(ctx, {
  type: 'bar',
  data: {
    labels: data_labels,
    datasets: [{
      label: 'Top 5 Product Category',
      data: actual_data,
      backgroundColor: [
        'rgba(255, 99, 132, 0.2)',
        'rgba(54, 162, 235, 0.2)',
        'rgba(255, 206, 86, 0.2)',
        'rgba(75, 192, 192, 0.2)',
        'rgba(153, 102, 255, 0.2)'
      ],
      borderColor: [
        'rgba(255, 99, 132, 1)',
        'rgba(54, 162, 235, 1)',
        'rgba(255, 206, 86, 1)',
        'rgba(75, 192, 192, 1)',
        'rgba(153, 102, 255, 1)'
      ],
      borderWidth: 1
    }]
  },
  options: {
    scales: {
      y: {
        beginAtZero: true
      }
    },
  }
});

doneRendering()
It's important to call the doneRendering function in the end to indicate that the visualization is fully rendered. This is especially important to call if your visualization needs to perform asynchronous calls or needs to be rendered as a PDF.
The final code looks like this:
const visObject = {
    create: function(element, config){
        element.innerHTML = "";
    },

    updateAsync: function (data, element, config, queryResponse, details, doneRendering) {
        const data_labels = []
        const actual_data = []

        data.forEach((d)=>{
            data_labels.push(d["Products Category"])
            actual_data.push(d["Products Count"])
        })

        const vizCanvas = document.createElement('canvas')
        vizCanvas.setAttribute("id", "myChart")

        const vizDiv = document.getElementById("vis")
        vizDiv.appendChild(vizCanvas)

        const ctx = document.getElementById("myChart")
        const myChart = new Chart(ctx, {
            type: 'bar',
            data: {
                labels: data_labels,
                datasets: [{
                    label: 'Top 5 Product Category',
                    data: actual_data,
                    backgroundColor: [
                        'rgba(255, 99, 132, 0.2)',
                        'rgba(54, 162, 235, 0.2)',
                        'rgba(255, 206, 86, 0.2)',
                        'rgba(75, 192, 192, 0.2)',
                        'rgba(153, 102, 255, 0.2)'
                    ],
                    borderColor: [
                        'rgba(255, 99, 132, 1)',
                        'rgba(54, 162, 235, 1)',
                        'rgba(255, 206, 86, 1)',
                        'rgba(75, 192, 192, 1)',
                        'rgba(153, 102, 255, 1)'
                    ],
                    borderWidth: 1
                }]
            },
            options: {
                scales: {
                    y: {
                        beginAtZero: true
                    }
                },

            }
        });

        doneRendering()
    }
};

looker.plugins.visualizations.add(visObject);
Data from Looker
Here's the data returned by Looker that you can provide in the RAW DATA tab of the CVB:
[{"Products Category":"Jumpsuits & Rompers","Products Count":"162"},
{"Products Category":"Suits","Products Count":"184"},
{"Products Category":"Skirts","Products Count":"364"},
{"Products Category":"Plus","Products Count":"439"},
{"Products Category":"Blazers & Jackets","Products Count":"551"}]
Dependencies
Here's the dependency needed to render this visualization:
["https://cdnjs.cloudflare.com/ajax/libs/Chart.js/3.9.1/chart.min.js"]
Query Response
You can extract the query response in Looker by making an API call to the Get Query endpoint.
Final Step
Once your code is working and the visualization is rendered as expected, you can follow the steps outlined in the documentation to submit your visualization to Looker.