This document describes how to list and chart log-based metrics by using the Google Cloud console. For information about creating log-based metrics, see Configure counter metrics and Configure distribution metrics.
Before you begin
Ensure that your Identity and Access Management role includes the permissions required to create and view log-based metrics, and to create alerting policies. For details, see Permissions for log-based metrics.
List log-based metrics
To view a list of log-based metrics for your Google Cloud project, do the following:
-
In the Google Cloud console, go to the Log-based Metrics page:
If you use the search bar to find this page, then select the result whose subheading is Logging.
Select an existing Google Cloud project. The log-based metrics interface displays two lists of metric-types: System metrics and User-defined metrics.
The User-defined metrics pane of the log-based metrics interface has several features to help you manage the user-defined metrics in your Google Cloud project:
The user-defined metrics table includes Name, Description, Type, and Filter columns. These fields are specified when you create the metric.
The Filter user-defined metrics pane lets you filter your metric list by text search or metric Name, Description, and Filter.
The user-defined metrics table includes columns for Previous month usage and Month-to-date usage (MTD). This usage data is useful, for example, if you want to determine which metrics ingest the most data or to estimate your bills.
The more_vert More menu for each metric in your user-defined metrics pane contains additional features for managing your metrics:
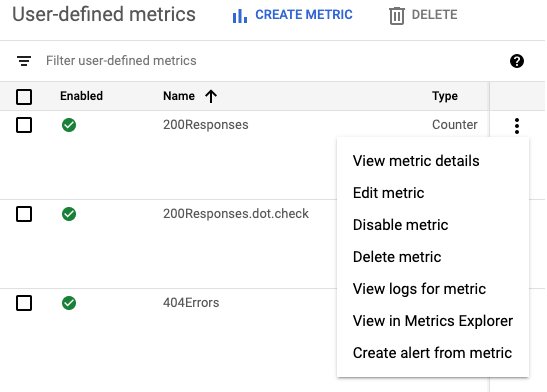
- View metric details: Shows you the metric's Name, Type, Description, Filter, Units, and Labels, if defined.
- Edit metric: Lets you edit certain fields for the metric.
- Disable metric: Lets you stops the metric from being calculated. You can re-enable a disabled metric from the same menu.
- Delete metric: Lets you delete the metric.
- View logs for metric: Takes you to the Logs Explorer and populates the metric's filter in the Query builder and runs the query.
- View in Metrics Explorer: Lets you chart the metric.
- Create alert from metric: Lets you configure notifications when a log-based metric matches criteria that you specify. For more information, see Alert on log-based metrics.
Chart log-based metrics
To create a chart of a log-based metric, do the following:
-
In the Google Cloud console, go to the Log-based Metrics page:
If you use the search bar to find this page, then select the result whose subheading is Logging.
Find the metric you want to view, and then select View in Metrics Explorer from the metric's more_vert More menu.
Metrics Explorer opens and is preconfigured for you. However, you might want to change some chart settings.
For example, the following screenshot shows a chart of the system metric with the name
byte_countfor a particular Google Cloud project: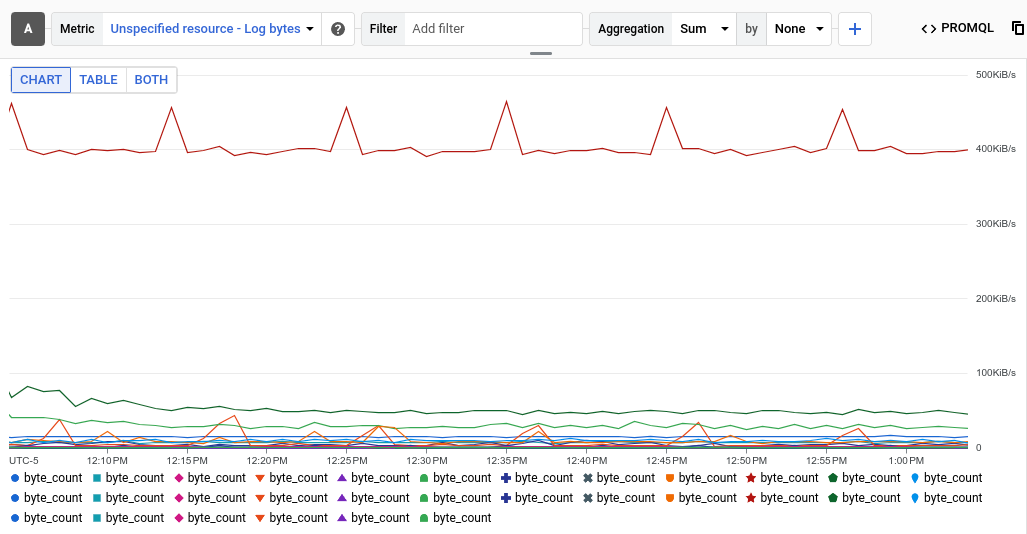
The Aggregation entry shows that each time series on the chart is a sum of the bytes written to a specific log. In the previous example, the project contains multiple logs, so the chart displays multiple time series.
To view the data for a specific log, add a filter. For example, to view the
byte_countmetric for log entries written by BigQuery, click Add filter, select log, and then select the BigQuery entry. The chart now displays a single time series, which shows the total of the log bytes written by BigQuery. If you want to view thebyte_countmetric by the severity of the log entry, then change the second menu in the Aggregation entry from None to Severity. The following chart shows thebyte_countmetric displayed by severity level for logs written by BigQuery: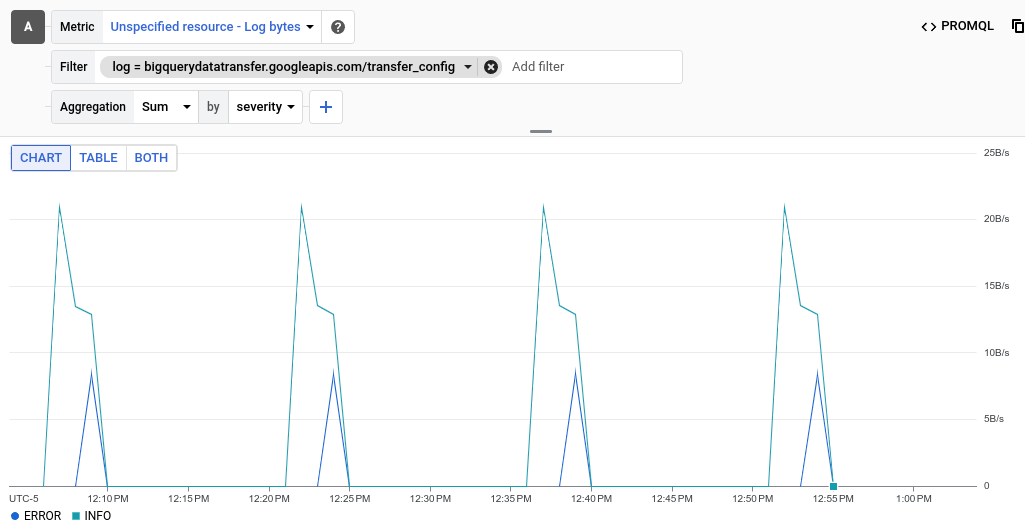
For distribution-valued log-based metrics, expand Line chart and select Heatmap chart.
For more information about distribution-valued metrics, see Distribution metrics and Percentiles and distribution-valued metrics.
Optional: To save the chart for future reference, click Save chart in the toolbar, and then complete the dialog. You can save the chart to an existing dashboard or create a new dashboard.
What's next
- To create an alerting policy for a log-based metric, see Alert on log-based metrics.
For more information about charting metric data, see these Monitoring resources: