You can configure an alerting policy to notify you whenever a specific message appears in your included logs. For example, if you want to know when an audit log records a particular data-access message, you can get notified when the message appears. These types of alerting policies are called log-based alerting policies. This document describes how to do the following, by using the Google Cloud console and the Cloud Monitoring API:
- Create and test a log-based alerting policy.
- Edit a log-based alerting policy.
- Delete a log-based alerting policy.
Before you begin
-
Verify that billing is enabled for your Google Cloud project.
Review Alerting comparison to determine if log-based alerting policies are a good fit for the data in your logs. For example:
Log-based alerting policies don't operate on excluded logs.
You can't use log-based alerting policies to derive counts from your logs. To derive counts, you need to use log-based metrics instead.
To create and manage log-based alerting policies, your Identity and Access Management role must include the permissions described in Permissions for log-based alerting policies.
Create a log-based alerting policy by using the Logs Explorer
You can create log-based alerting policy from the Logs Explorer page in the Google Cloud console or by using the Monitoring API. This section describes how to create log-based alerting policies by using Logs Explorer. For Monitoring API information, see Create a log-based alerting policy by using the Monitoring API.
Log-based alerting policies don't honor the scope setting in the Logs Explorer page. Instead, when a project-level sink routes a log entry that originates in a project to a log bucket, log-based alerting policies defined in that project scan the log entry. To learn more, see Available log entries.
The Logs Explorer interface guides you through the following steps:
- Provide details for the alerting policy, such as a name and a severity level.
- Choose the logs for which you want to receive a notification.
- Set the time between notifications.
- Set the time for automatic closure of incidents.
- Specify whom to notify.
For example, assume that you have an application that writes a syslog
log entry with NOTICE severity when the application changes a network address.
The log entries for network-address changes include a JSON payload that looks
like the following:
"jsonPayload": {
  "type": "Configuration change",
  "action": "Set network address",
  "result": "IP_ADDRESS",
}
You want to create a log-based alerting policy that notifies you
when an invalid IPv4 address appears in the jsonPayload.result field
of log entries in syslog with NOTICE severity.
To create this alerting policy, do the following:
-
In the Google Cloud console, go to the Logs Explorer page:
If you use the search bar to find this page, then select the result whose subheading is Logging.
Use the Query pane to build a query that matches the message you want to use in your log-based alerting policy.
For example, to find log entries with a severity level of
NOTICEin thesysloglog that have invalid IP addresses in the JSON payload, you can use the following query:log_id("syslog") severity = "NOTICE" jsonPayload.result !~ "^((25[0-5]|2[0-4][0-9]|[01]?[0-9][0-9]?)(\.|$)){4}$"Click Run query to validate the query.
In the Query results toolbar, expand the Actions menu and select add_alert Create log alert.
In the Alert details pane, do the following:
Enter a name for your alerting policy in the Alert Policy Name field. For example: "Network address: invalid IPv4 value".
Select an option from the Policy severity level menu. Incidents and notifications display the severity level.
Optional: Add documentation for your alerting policy. You can include information that might help the recipient of a notification diagnose the problem. The following string summarizes the reason for the notification:
Log-based alerting policy in project ${project} detected an invalid IPv4 value.For information about how you can format and tailor the content of this field, see Using Markdown and variables in documentation templates.
To advance to the next step, click Next.
In the Choose logs to include in the alert pane, do the following:
Enter a query and or edit the existing query to filter available logs. Log entries that match the query cause the alerting policy to trigger.
To verify the query, click Preview logs.
Optional: Extract log labels. You can create labels from log fields to be displayed in any incidents and notifications created by the alert.
In the documentation field of your alerting policy, you refer to the extracted labels by using a variable of the form
${log.extracted_label.KEY}, whereKEYis the name you gave the extracted label.
Click Next.
Select the minimum time between notifications. This value lets you control the number of notifications you get from Monitoring if this condition is met multiple times. For this example, select 5 min from the options.
Optional: Select the incident autoclose duration. By default, the incident autoclose duration is set to 7 days.
Click Next.
Select one or more notification channels for your alerting policy. For this example, select an email notification channel.
If you already have an email notification channel configured, then you can select it from the list. If not, click Manage notification channels and add an email channel. For information about creating notification channels, see Create and manage notification channels.
Click Save.
Your log-based alerting policy is now ready to test.
Test the example log-based alerting policy
To test the alerting policy you created, you can manually write a log entry that matches the query. To write the log entry, do the following:
Configure the following log entry by changing the
PROJECT_IDvariable to your project ID:{ "entries": [ { "logName": "projects/PROJECT_ID/logs/syslog", "jsonPayload": { "type": "Configuration change", "action": "Set network address", "result": "999.027.405.1", }, "severity": "NOTICE", "resource": { "type": "generic_task", "labels" : { "project_id": "PROJECT_ID", "location": "us-east1", "namespace": "fake-task-2", "job": "write-log-entry", "task_id": "11", }, }, }, ], }
Go to the
logEntries.writereference page, or click the following button:Copy the log entry you configured previously.
In the Try this API pane, do the following:
Replace the content of the Request body field in APIs Explorer with the log entry you copied in the previous step.
Click Execute. If prompted, follow the authentication flow.
If the
logEntries.writecall is successful, then you get an HTTP200response code and an empty response body,{}. For more information about APIs Explorer, see Using the APIs Explorer in the Monitoring documentation; the APIs Explorer works the same way with the Logging API.
The log entry matches the filter specified for the alerting policy in the following ways:
- The
logNamevalue specifies thesysloglog that is in your Google Cloud project. - The
severityvalue for this log entry isNOTICE. - The
jsonPayload.resultvalue is not a valid IPv4 address.
After you write the log entry, the following sequence occurs:
- The new log entry appears in the Logs Explorer. The log entry meets the condition of the alerting policy.
- An incident is opened in Cloud Monitoring.
You receive a notification for the incident. If you configured an email notification channel, then the notification looks like the following screenshot:
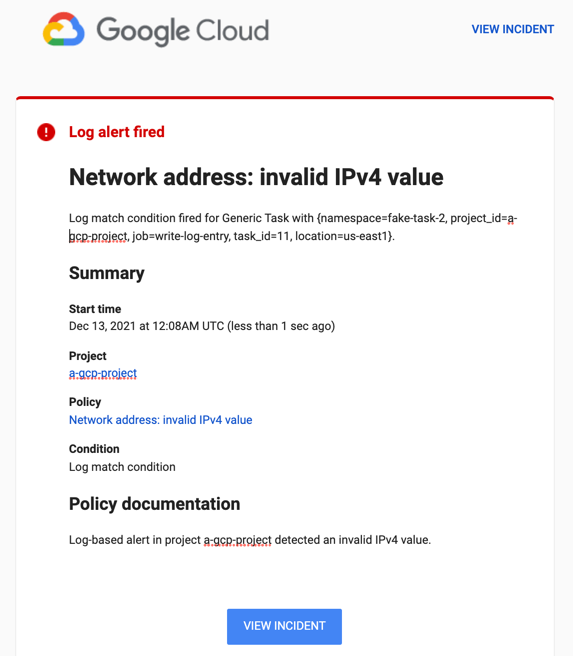
You can click View incident in the email to see the incident in Cloud Monitoring. For more information about incidents, see Manage incidents for log-based alerting policies.
Other scenarios: Alerting on audit logs
The example in the section titled Creating a log-based alerting policy is artificial; you don't typically create an alerting policy and then manually write log entries that meet the alerting policy condition. Log entries are usually written by applications or other services. But the source of the log entries doesn't matter; for log-based alerting policies, what matters is the query that you use to select the log entries.
The following sections describe realistic scenarios for log-based alerting policies based on the content of audit logs. Each scenario illustrates how to create a query that selects the appropriate audit-log entries. Otherwise, the procedure for creating the log-based alerting policies is the same as shown in Creating a log-based alert.
Alerting policies that monitor for human access of secrets
Suppose that your project stores secrets in Secret Manager, and some of these secrets are intended only for service accounts to use. Except in unusual circumstances, human users never access these secrets.
If you have enabled audit logging for Secret Manager, then each successful attempt to access a secret creates an audit log entry. Each entry includes the name of the secret and the caller's identity.
You can create a log-based alerting policy that notifies you when a human user accesses a secret.
The following shows an excerpt of an audit log entry written by Secret Manager. The excerpt shows the fields that are useful for creating the query for a log-based alert:
{
  "protoPayload": {
    "@type": "type.googleapis.com/google.cloud.audit.AuditLog",
    "serviceName": "secretmanager.googleapis.com",
    "methodName": "google.cloud.secretmanager.v1.SecretManagerService.AccessSecretVersion",
    "authenticationInfo": {
      "principalEmail": "my-svc-account@PROJECT_ID.iam.gserviceaccount.com",
      "serviceAccountDelegationInfo": [],
      "principalSubject": "serviceAccount:my-svc-account@PROJECT_ID.iam.gserviceaccount.com"
    },
    ...
  },
  ...
}
The following protoPayload subfields are of particular interest:
@type: indicates that this log entry is an audit log entry.serviceName: records the service that wrote the audit log entry. Use this field to identify entries written by Secret Manager.methodName: identifies the method for which this audit log entry was written. Use this field to identify the action that caused this entry to be created. In this example, it's theAccessSecretVersionmethod.authenticationInfo.principalEmail: records the account that invoked the method in themethodNamefield. The expected value for this field is a service account, which ends withgserviceaccount.com.
To find log entries for secret access by a human user, look
for audit log entries written by Secret Manager. You want to
find the log entries in which the AccessSecretVersion method was invoked by
a principal that doesn't end with gserviceaccount.com.
The following query isolates these log entries:
protoPayload.@type = "type.googleapis.com/google.cloud.audit.AuditLog"
protoPayload.serviceName = "secretmanager.googleapis.com"
protoPayload.methodName =~ "AccessSecretVersion$"
protoPayload.authenticationInfo.principalEmail !~ "gserviceaccount.com$"
To create a log-based alerting policy for human access of secrets, use this query in the Choose logs to include in the alert pane.
Alerting policies that monitor for decryption events
The analysis in the previous example can be adapted to other services. For example, if you use Cloud Key Management Service to encrypt and decrypt sensitive data, then you can use audit logs generated by Cloud KMS to detect when a human user decrypts a value.
To find log entries for decryption done by a human user, look
for audit log entries written by Cloud KMS. You want to find the
log entries in which the Decrypt method was invoked by
a principal that doesn't end with gserviceaccount.com, which indicates
a service account.
The following query isolates these log entries:
protoPayload.@type = "type.googleapis.com/google.cloud.audit.AuditLog"
protoPayload.serviceName = "cloudkms.googleapis.com"
protoPayload.methodName = "Decrypt"
protoPayload.authenticationInfo.principalEmail !~ "gserviceaccount.com$"
To create a log-based alerting policy for decryption done by a human user, use this query in the Choose logs to include in the alert pane.
Manage log-based alerting policies in Monitoring
You can view, edit, and delete log-based alerting policies by using the Google Cloud console for Monitoring or by using the Monitoring API. This document describes how to manage alerting policies by using the Google Cloud console. For information about using the Monitoring API to manage alerting policies, see Manage alerting policies by API.
To see a list of all the alerting policies in your Google Cloud project, do one of the following:
To navigate from Logging:
-
In the Google Cloud console, go to the Logs Explorer page:
If you use the search bar to find this page, then select the result whose subheading is Logging.
In the Query results toolbar, expand the Actions menu and select edit Manage log alerts.
-
To navigate from Monitoring:
-
In the Google Cloud console, go to the notifications Alerting page:
If you use the search bar to find this page, then select the result whose subheading is Monitoring.
To see all policies and to enable filtering, in the Policies pane, click See all policies.
-
Both of these actions take you to the Monitoring Policies page, which lists all the alerting policies in your Google Cloud project.
To restrict the alerting policies that are listed, add filters.
Each filter is composed of a name and a value. For example,
you can set the value to be an exact match for a policy name,
or a partial match. Matches are not case-sensitive.
If you specify multiple filters, then the filters are implicitly joined
by a logical AND unless you insert an OR filter.
The following screenshot lists the alerting policies that are enabled and that
were created after January 1, 2021:
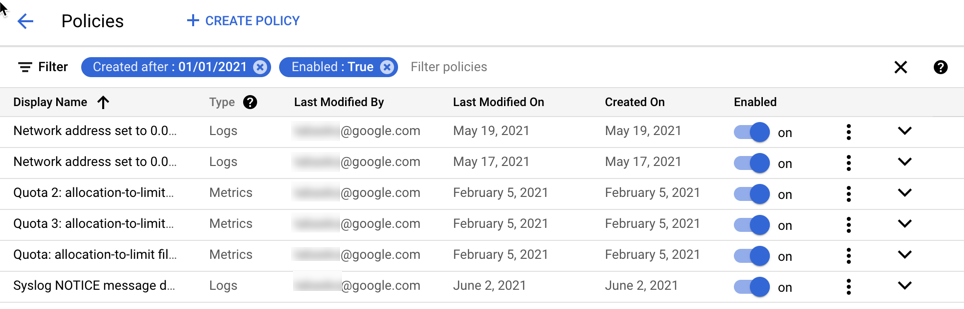
From the Policies page you can edit, delete, copy, enable, or disable an alerting policy:
To edit or copy a policy, click more_vert More options, and select an option. Editing and copying a policy is similar to the procedure described in Create a log-based alerting policy. You can change and, in some cases, delete the values in the fields. When done, click Save.
You can also edit a log-based alerting policy by clicking its name in the list of policies.
To delete a policy, click More options more_vert and select Delete. In the confirmation dialog, select Delete.
To enable or disable the alerting policy, click the toggle located under the heading Enabled.
Create a log-based alerting policy by using the Monitoring API
You can create log-based alerting policies by using the Monitoring API. You provide the same information to the Monitoring API that you provide when you use the Logs Explorer in the Google Cloud console:
- Details for the alerting policy, such as a name and a severity level.
- The logs for which you want to receive a notification.
- The time between notifications.
- The time for automatic closure of incidents.
- Whom to notify.
To create alerting policies by using the Monitoring API, you
create an AlertPolicy object and submit it to the
alertPolicies.create method.
Before you can use the Monitoring API, you must enable the API and have authorization to use it. For more information, see the following documentation:
Structure of alerting policies
The Monitoring API represents an alerting policy by using the
AlertPolicy structure.
The AlertPolicy structure has several embedded structures, including a
description of the alerting policy condition. Log-based alerting
policies differ from metric-based alerting policies in the following ways:
- You describe the condition by using the
LogMatchcondition type. Metric-based alerting policies use different condition types. - A log-based alerting policy can have only one condition.
- You specify the time between notifications and the automatic
incident-closure period by including an
AlertStrategystructure. Metric-based alerting policies don't include a time between notifications.
This section describes how to create a log-based alerting policy. These
policies differ from metric-based alerting policies in the type of condition
you use. For log-based alerting policies,
the condition type is LogMatch. When you use
the Monitoring API to manage alerting policies, there are
no differences in how you list, edit, or delete metric and log-based policies.
Manage alerting policies by API describes how to create,
list, edit, and delete alerting policy by using the Monitoring API.
Notification rules
When you create a log-based alerting policy, Logging creates
an internal object called a notification rule. Logging
uses the notification rule to match incoming log
entries to the filter of your alerting policy, and then to create a notification
when an entry matches the filter criteria. You don't interact directly
with the notification rule. However, to create a log-based alerting policy,
you must have the logging.notificationRules.create permission.
Design the alerting policy
The section titled
Create a log-based alerting policy by using the Logs Explorer
describes one way to create a log-based alerting policy.
That section shows how to create
a log-based alerting policy that notifies you when a syslog log entry has a
severity
level of NOTICE and an invalid IPv4 address in the jsonPayload.result
field.
To create the same log-based alerting policy by using the
Monitoring API, you
create an AlertPolicy object that looks like the following JSON structure:
{
  "displayName": "Network address: invalid IPv4 value (API)",
  "documentation": {
    "content": "Log-based alerting policy in project ${project} detected an invalid IPv4 value.",
    "mimeType": "text/markdown"
  },

  "conditions": [
    {
      "displayName": "Log match condition: invalid IP addr (API)",
      "conditionMatchedLog": {
        "filter": "log_id(\"syslog\") severity = \"NOTICE\" jsonPayload.result !~ \"^((25[0-5]|2[0-4][0-9]|[01]?[0-9][0-9]?)(\\.|$)){4}$\"",
      },
    }
  ],
  "combiner": "OR",

  "alertStrategy": {
    "notificationRateLimit": {
      "period": "300s"
    },
    "autoClose": "604800s",
  },

  "notificationChannels": [
    "projects/PROJECT_ID/notificationChannels/CHANNEL_ID"
  ]
}
This JSON code specifies the same information that you specify
when creating a log-based alerting policy by using Logs Explorer. The following
sections map the contents of this AlertPolicy structure to the steps you
follow when using Logs Explorer to create a log-based alert. The value
of the conditionMatchedLog field is a LogMatch structure.
Provide a name and documentation
An alerting policy has a display name and associated documentation that is
provided with notifications to assist responders. In the Logs Explorer,
these fields are called Alert Name and Documentation. You represent
these values in an AlertPolicy structure as follows:
{
  "displayName": "Network address: invalid IPv4 value (API)",
  "documentation": {
    "content": "Log-based alerting policy in project ${project} detected an invalid IPv4 value.",
    "mimeType": "text/markdown"
  },
  ...
}
In this example, the value for displayName includes "(API)"
so that you can distinguish between the two example policies
when viewing the list of policies in the Google Cloud console. The
Monitoring Policies page lists policies by display name and
indicates whether the policy is based on metrics or logs. For more information,
see
Manage log-based alerting policies in Monitoring.
The documentation field includes, in the content subfield, the description
you might supply when using the Logs Explorer. The second subfield,
mimeType is required when you specify a value for the documentation field.
The only valid value is "text/markdown".
Choose the logs for which you want to receive a notification
A log-based alerting policy has a single condition. In the Logs Explorer,
you specify the condition when you supply a query in the Define log entries to
alert on field. You represent these values in an AlertPolicy structure as
follows:
{ ...
  "conditions": [
    {
      "displayName": "Log match condition: invalid IP addr (API)",
      "conditionMatchedLog": {
        "filter": "log_id(\"syslog\" severity = \"NOTICE\" jsonPayload.result !~ \"^((25[0-5]|2[0-4][0-9]|[01]?[0-9][0-9]?)(\\.|$)){4}$\"",
      },
    }
  ],
  "combiner": "OR",
  ...
}
The conditions field takes a list of Condition
structures, although a log-based alerting policy must have only one
condition. Each Condition has a display name and a description of
the condition.
The value of the
displayNamefield is a brief description of the condition. When you use the Logs Explorer to create log-based alerting policies, the display name is always "Log match condition". When you use the Monitoring API, you can provide a more precise display name. A value is required.The value of the
conditionMatchedLogfield is aLogMatchstructure, and the value of thefilterfield is the query you specify in the Logs Explorer. Because this query is provided as the value of a JSON field, the entire query appears in quotes, and any quotes in the query itself must be escaped with the\(backslash) character.The
LogMatchstructure also includes an optionallabelExtractorsfield. You can use label extractors to compose custom labels from your log entries and then reference those labels in your notifications.For example, to extract the value of the label
labels."compute.googleapis.com/resource_id"from your log entry into a label calledvm_identifier, the previous condition might look like this:"conditions": [ { "displayName": "Log match condition: invalid IP addr (API)", "conditionMatchedLog": { "filter": "log_id(\"syslog\" severity = \"NOTICE\" jsonPayload.result !~ \"^((25[0-5]|2[0-4][0-9]|[01]?[0-9][0-9]?)(\\.|$)){4}$\")", "labelExtractors": { "vm_identifier": "EXTRACT(labels.\"compute.googleapis.com/resource_id\")" } }, } ],Use the
EXTRACTfunction to match the entire value, or use theREGEXP_EXTRACTto match substrings based on regular expressions. These are the same function used for label extraction in log-based metrics; see Create a label for more information.You can use these extracted labels in the documentation of the alerting policy, so they are reported in notifications. In the
documentationfield of your alerting policy, you refer to the extracted labels by using a variable of the form${log.extracted_label.KEY}, whereKEYis the name you gave the extracted label.The following example shows how to refer to the key for the extracted label
vm_identifier, so that the value of the log labellabels."compute.googleapis.com/resource_id"is included in the notifications:"documentation": { "content": "Log-based alerting policy in project ${project} detected an invalid IPv4 value on VM with ID ${log.extracted_label.vm_identifier}.", "mimeType": "text/markdown" },
The value for the combiner field specifies how to combine the results of
multiple conditions in metric-based alerting policies. You can only use one
condition in log-based alerting policies,
and you must specify the combiner field with
the value "OR". You can't create log-based alerting policies
with multiple conditions.
Set notification and auto-close values
A log-based alerting policy specifies the minimum time between
notifications. In the Logs Explorer, you select a value from the Time
between notifications menu.
You represent this value in an AlertPolicy structure by specifying a
value, in seconds, for the period field of a
NotificationRateLimit structure embedded in an
AlertStrategy structure.
Similarly, the alerting policy includes the period for automatically
closing incidents. The default value is 7 days.
In the Logs Explorer, you can select a different value from the
Incident autoclose duration menu. The option corresponds to the
autoclose field in the AlertStrategy API structure.
When you use this field, specify the value in seconds. The minimum value is
1,800 seconds, or
30 minutes.
{ ...
  "alertStrategy": {
    "notificationRateLimit": {
      "period": "300s"
    },
    "autoClose": "604800s",
  },
  ...
}
The value for the period field in this example, 300s, is equivalent to
5 minutes. The autoclose value, 604800s, is equivalent to 7 days.
Specify whom to notify
An alerting policy can include a list of notification channels.
In the Logs Explorer, you select channels from a menu.
You represent these values in an AlertPolicy structure by providing
a list of one or more resource names for configured
NotificationChannel objects:
{ ...
  "notificationChannels": [
    "projects/PROJECT_ID/notificationChannels/CHANNEL_ID"
  ]
}
When you create a notification channel, it is assigned a resource name. For information about retrieving the list of available notification channels, which includes their resource names, see Retrieving channels in the Monitoring documentation. You can't get the channel IDs by using the Google Cloud console.
Send your alerting policy to the Monitoring API
To create an alerting policy by using the Monitoring API, you
create an AlertPolicy object and submit it to the
alertPolicies.create method. You can invoke
the alertPolicies.create by using the Google Cloud CLI,
calling the Monitoring API directly.
You can also create log-based alerting policies
by using the client libraries for
C#, Go, Java, Python, and Ruby. You might also be able to use other client
libraries; the library for your language must include the
LogMatch condition type.
To create an alerting policy by using the gcloud CLI, do the following:
Put the JSON representation of your alerting policy into a text file, for example, into a file called
alert-invalid-ip.json.Pass this JSON file to the gcloud CLI using the following command:
gcloud alpha monitoring policies create --policy-from-file="alert-invalid-ip.json"
If successful, this command returns the resource name of the new policy, for example:
Created alerting policy [projects/PROJECT_ID/alertPolicies/POLICY_ID].
To create an alerting policy by calling alertPolicies.create directly,
you can use the APIs Explorer tool as follows:
Go to the
alertPolicies.createreference page.In the Try this API pane, do the following:
In the
namefield, enter the following value:projects/PROJECT_ID
Copy the JSON representation of your alerting policy and replace the contents of the Request body field in APIs Explorer with the copied alerting policy.
Click Execute.
If the
alertPolicies.createcall is successful, then you get an HTTP200response code and an empty response body,{}. For more information about APIs Explorer, see Using the APIs Explorer in the Monitoring documentation.
For more information about creating alerting policies by using the Monitoring API, see Creating policies. The examples in that document use condition types for metric-based alerting policies, but the principles are the same.
Test the alerting policy
To test your new alerting policy, you can use the same procedure described in Test the example log-based alert.
Example: Create an alerting policy when a log entry contains a text string
This example uses the Google Cloud console to create an alerting policy, the Logs Explorer to view log entries, and the Google Cloud CLI to write a log entry:
-
In the Google Cloud console, go to the Logs Explorer page:
If you use the search bar to find this page, then select the result whose subheading is Logging.
In the Query pane, enter the following query after updating the value of the PROJECT_ID:
logName="projects/PROJECT_ID/logs/test-log"
textPayload:"Oops"
The query searches the log with the name
test-logfor log entries that have atextPayloadfield that contains the string "Oops".In the Query results toolbar, expand the Actions menu and select add_alert Create log alert. Then, complete the dialog.
You must enter a name for the policy, like
Alert on Oops. The query that you entered in the previous step is automatically included in the alerting policy.To test the alerting policy, open the Cloud Shell and then run the following command:
gcloud logging write test-log --severity=ERROR --payload-type=text 'This log entry contains Oops'
The previous command writes an entry to the log named
test-log. The entry has a severity level ofERRORand includes atextPayloadfield.In the Logs Explorer, click Run query.
After the display is refreshed, you can view the details of the log entry that you wrote in the previous step.
-
In the Google Cloud console, go to the notifications Alerting page:
If you use the search bar to find this page, then select the result whose subheading is Monitoring.
The Incidents pane displays the incident and details about the alerting policy.
If you don't see an incident when you open the Alerting page, then wait a few minutes and refresh the page.
You won't see another incident or get another notification if you immediately repeat the Google Cloud CLI command. The alerting policy settings specify the minimum time period between incidents. You can view and change those settings by editing the policy.