This page describes how to retrieve audit logs for system artifacts in Google Distributed Cloud (GDC) air-gapped appliance.
System artifacts exist in the Artifact Registry of the org infrastructure cluster. All changes and operations performed on the system artifacts are audited. As an Infrastructure Operator (IO), view the audit logs through the Grafana user interface (UI).
Before you begin
To get the permissions that you need to view audit logs, ask your Security Admin to grant you the following roles for the org infrastructure cluster access:
- Grafana Viewer (
grafana-viewer) role. - Organization Grafana Viewer (
organization-grafana-viewer) role.
Get audit logs for artifacts in the org infrastructure cluster
To retrieve audit logs for system artifacts in the org infrastructure cluster, complete the following steps:
Go to the monitoring instance UI for the org infrastructure cluster.
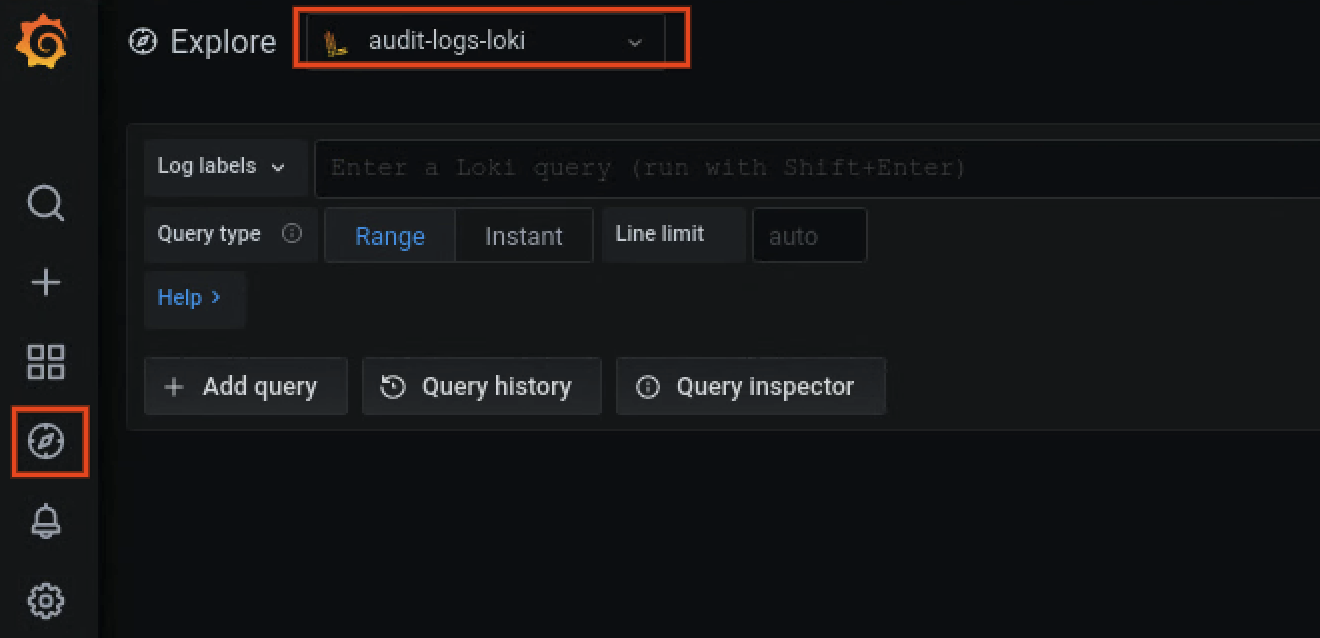
Click Explore > audit-logs-loki and build the query to get audit logs.
Find artifacts with Loki queries
You can build Loki queries to find artifacts.
The following sections contain examples for querying audit logs.
Query audit logs for all system artifacts
Run the following query to return audit logs for all system artifacts:
{cluster="ORG_INFRA_CLUSTER",service_name="artifactmanagement"}
Replace CLUSTER_NAME with the cluster name, which will match the pattern <ORG_NAME>-infra.
For example:
{cluster="<ORG_NAME>-infra", service_name="artifactmanagement"}`
Query audit logs for one specific Artifact Registry
Run the following query to return audit logs for one specific Artifact Registry:
{cluster="ORG_INFRA_CLUSTER",service_name="artifactmanagement"} | json resource="resource" | resource=~"^REGISTRY_PREFIX.*"
Replace the following:
- ORG_INFRA_CLUSTER: the org infrastructure cluster name, such as
ORG-INFRA. - REGISTRY_PREFIX: the target Artifact Registry name prefix.
For example:
{cluster="ORG-INFRA",service_name="artifactmanagement"} | json resource="resource" | resource=~"^gpc-system-services.*"
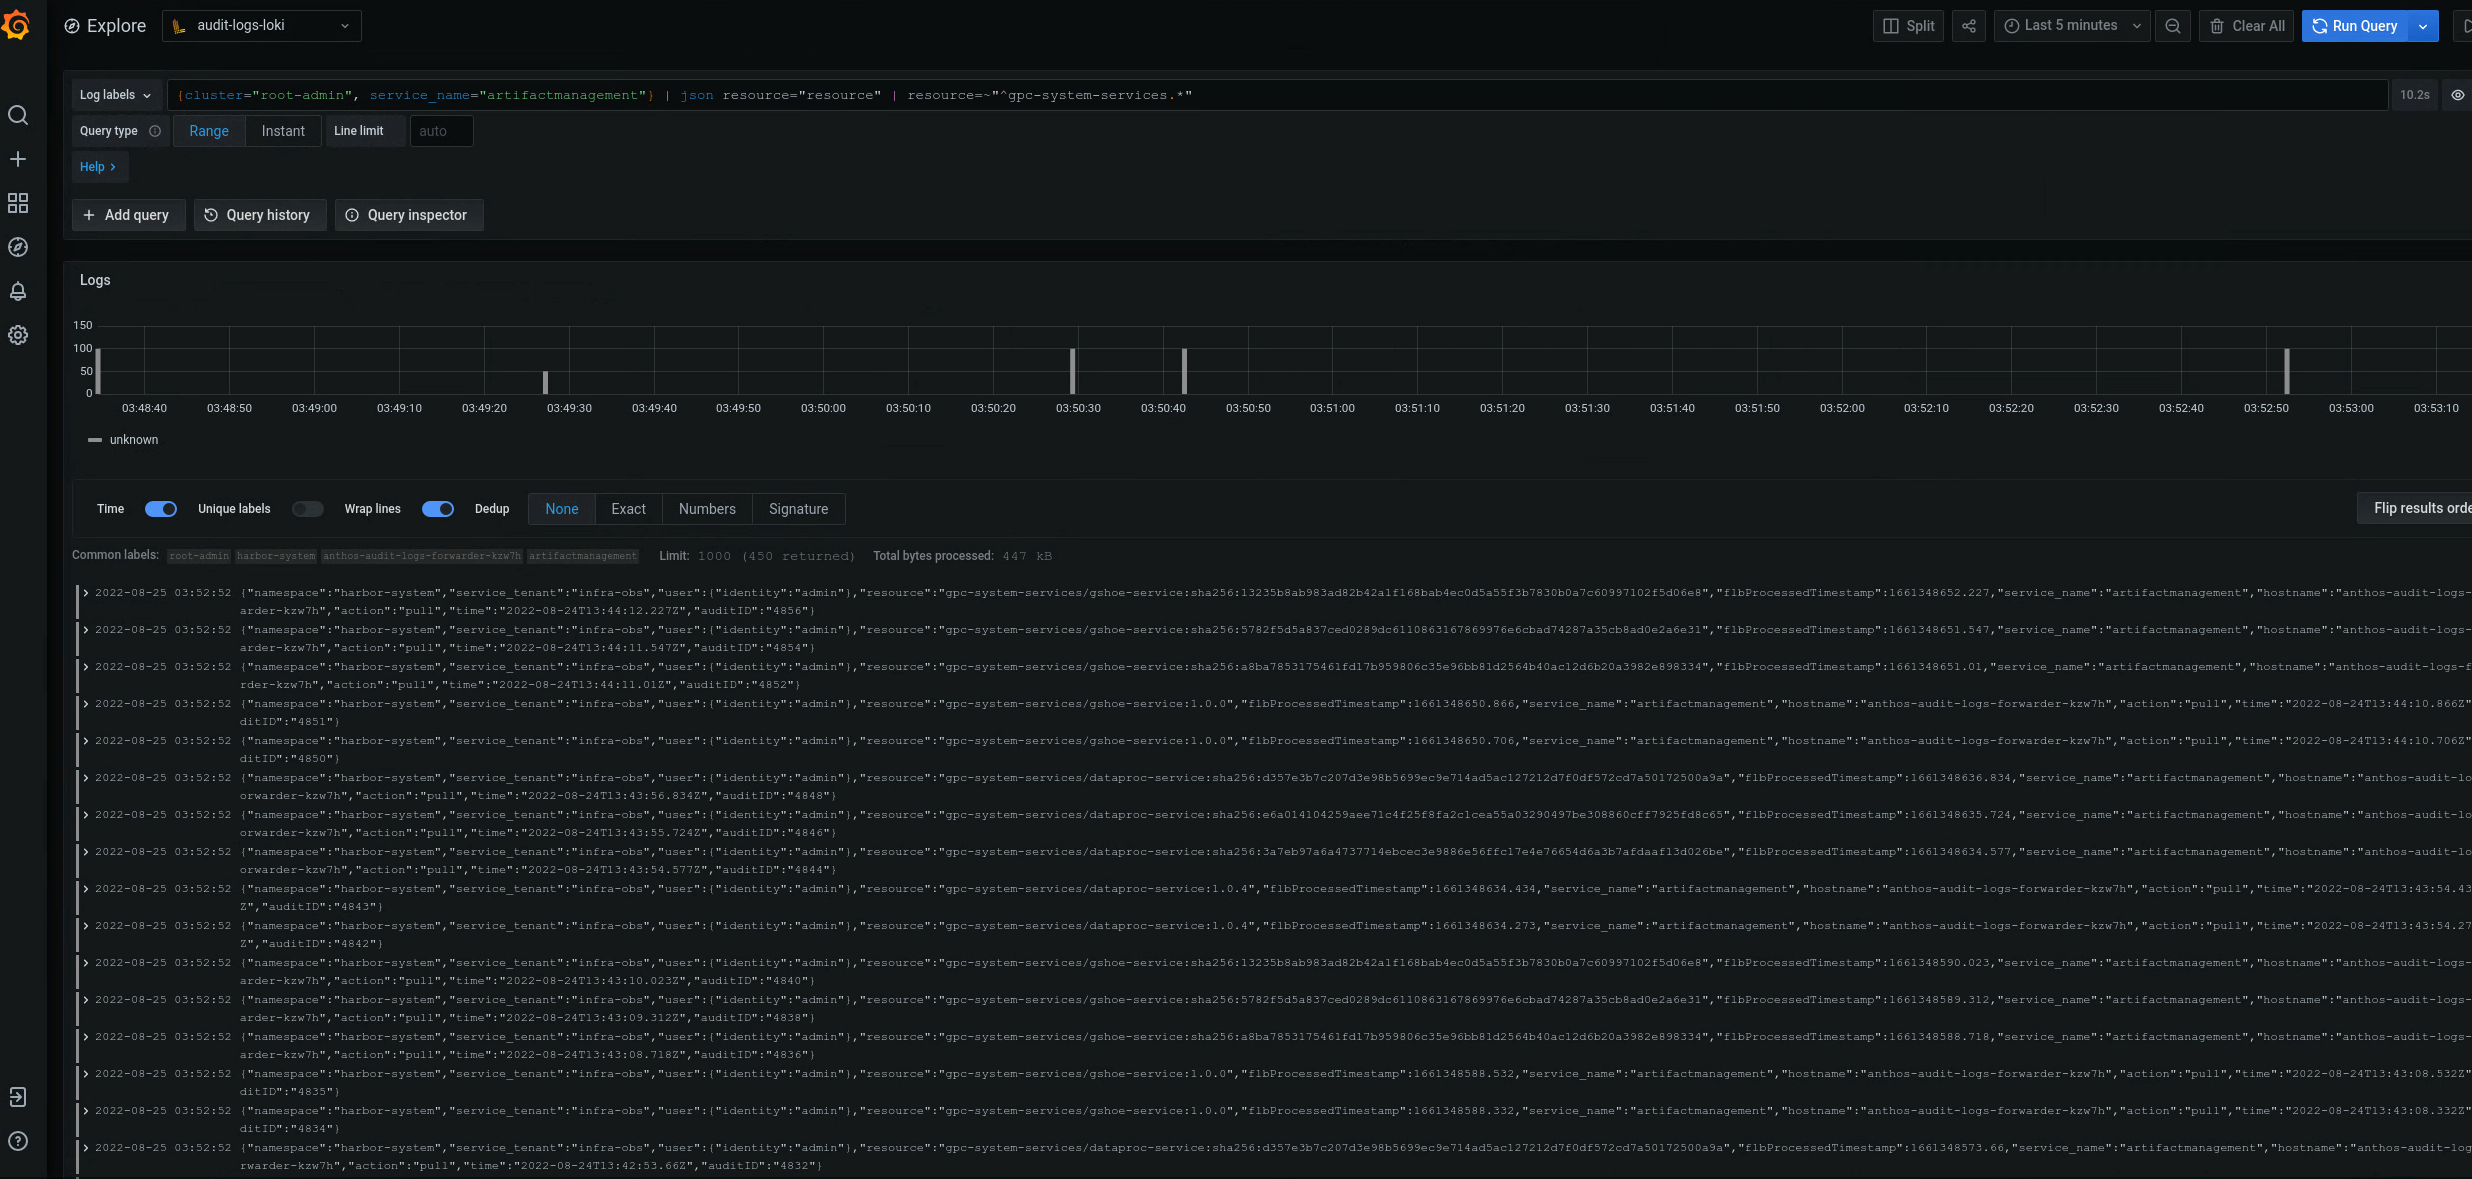
Figure 2. Examples of audit logs for one specific Artifact Registry listed on the Grafana UI.
In figure 2, the query to return audit logs from the gpc-system-services Artifact Registry of the cluster displays its results as a list on the same page.
Query audit logs for multiple Artifact Registry registries
Run the following query to return audit logs for multiple Artifact Registry registries:
{cluster="ORG_INFRA_CLUSTER",service_name="artifactmanagement"}
| json resource="resource" |
resource=~"^REGISTRY1_PREFIX.*" or
resource=~"^REGISTRY2_PREFIX.*"
Replace the following:
ORG_INFRA_CLUSTER: the target cluster name, such asorgname-infra.REGISTRY1_PREFIX: the first target Artifact Registry name prefix.REGISTRY2_PREFIX: the second target Artifact Registry name prefix.
For example:
{cluster="org-infra",service_name="artifactmanagement"} | json
resource="resource" | resource=~"^gpc-system.*" or resource=~"^library/.*"