記錄收集器從各種專案元件提取資料後,可觀測性平台會匯總所有記錄來源的記錄、新增索引,並根據資料可觀測性設定,將記錄與標籤建立關聯。然後,您可以在系統監控執行個體的記錄面板中查詢及查看記錄。
在記錄面板中查詢及查看記錄
您可以透過專案的 Grafana 執行個體 (也稱為系統監控執行個體) 使用者介面 (UI) 查詢記錄。 專案的系統監控執行個體。 系統監控執行個體包含專案層級的措施,可監控基礎架構元件,例如 CPU 使用率、儲存空間用量、網路監控、伺服器監控、記錄、快訊,以及 GDC 元件的指標。
您可以在專案的系統監控執行個體記錄面板中查看記錄。接著,您可以查詢特定記錄,查看使用案例需求的資料可觀測性。
事前準備
如要在記錄面板上查詢及查看記錄,您必須先取得系統監控執行個體的存取權。詳情請參閱「取得資訊主頁的存取權」。
如要登入 Grafana 並查看記錄,請要求專案 IAM 管理員授予您專案 Grafana 檢視者 (project-grafana-viewer) 角色。透過這個角色式存取控管程序,您可以安全地存取資料視覺化內容。
為記錄檔建構查詢
從系統監控執行個體的 UI 查詢記錄檔時,您可以選擇資料來源,從專案擷取作業記錄,並取得查詢的整合檢視畫面。如要篩選結果,請使用查詢語言運算式依標籤搜尋記錄。舉例來說,您可以在查詢中將 cluster 和 namespace 標籤分別設為可識別叢集和專案命名空間的值。
系統監控執行個體端點
應用程式營運人員 (AO) 適用
以下網址是專案監控執行個體的端點:
https://GDC_URL/PROJECT_NAMESPACE/grafana
更改下列內容:
- GDC_URL:您在 GDC 中的機構網址。
- PROJECT_NAMESPACE:專案的命名空間。
平台管理員 (PA) 專用
以下網址是專案監控執行個體的端點:
https://GDC_URL/platform-obs/grafana
將 GDC_URL 替換為貴機構在 GDC 中的網址。
查詢作業記錄
- 在 GDC 控制台中選取專案。
- 在導覽選單中,依序點選「Operations」>「Logging」。
按一下「在 Grafana Loki 中查看所有記錄」。
在監控執行個體的 UI 中,按一下導覽選單中的「explore」(探索) Explore,開啟「Explore」頁面。
在「探索」列的下拉式選單中,選取「作業記錄」做為資料來源,即可擷取作業記錄。
輸入查詢,使用 LogQL (記錄查詢語言) 運算式依標籤搜尋記錄。您可以透過下列任一方式完成這個步驟:
- 使用互動式查詢建構工具 UI。然後按一下「執行查詢」。
- 直接在文字欄位中輸入 LogQL 運算式,然後按 Shift+Enter 鍵執行查詢。
頁面會顯示與查詢條件相符的記錄。
查詢記錄後,您可以匯出記錄。按一下「匯出」,即可下載純文字或 CSV 格式的記錄。
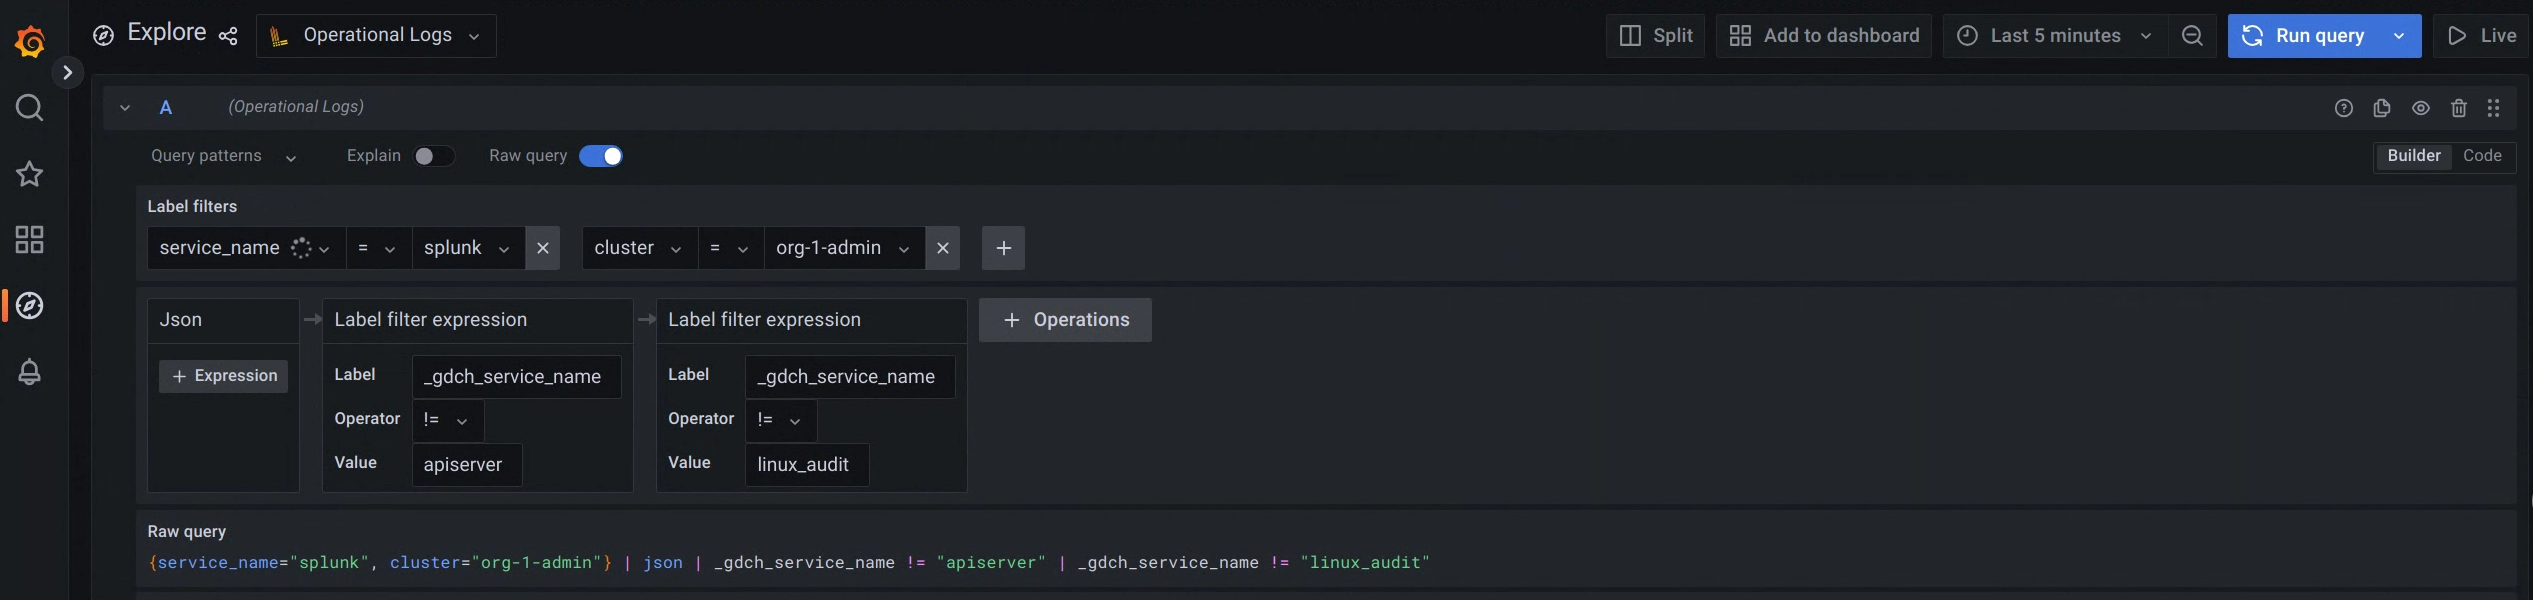
圖 1. 從系統監控執行個體的 UI 查詢記錄的選單選項。
如圖 1 所示,「作業記錄」選項會顯示介面,讓您從使用者介面建立記錄查詢,以擷取作業記錄。
如要查詢稽核記錄而非作業記錄,請在先前步驟的「探索」列中,從下拉式選單選取「稽核記錄」做為資料來源。
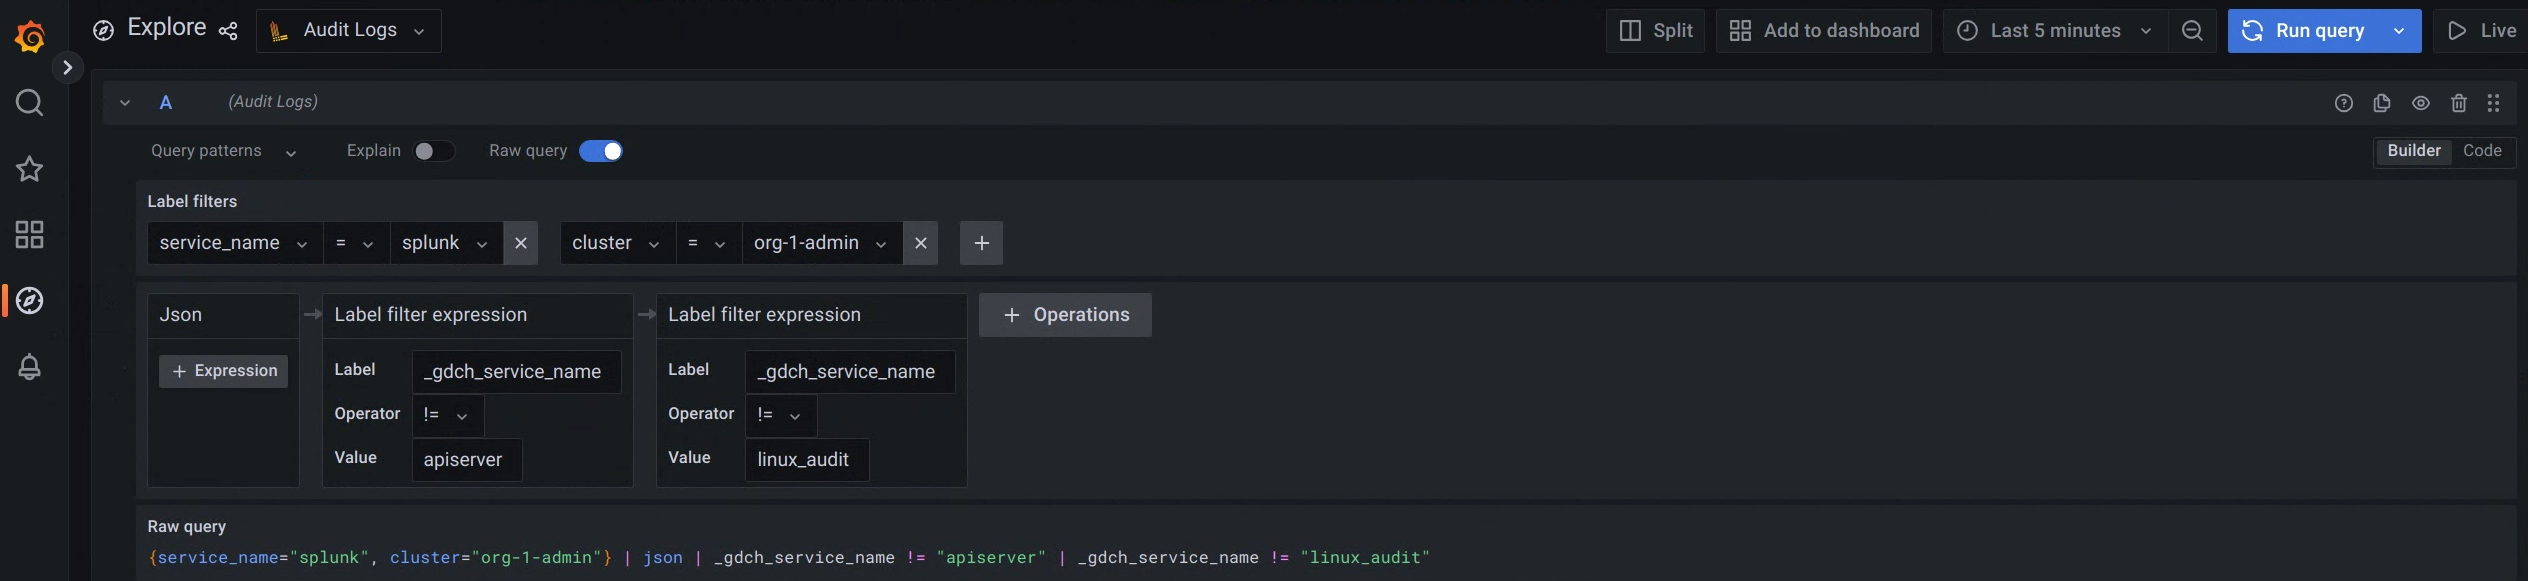
圖 2:選單選項:從監控執行個體的 UI 查詢稽核記錄。
如圖 2 所示,「稽核記錄」選項會顯示介面,讓您從使用者介面建構查詢,以擷取稽核記錄。
查詢記錄後,您可以匯出記錄。按一下「匯出」按鈕,即可下載純文字或 CSV 格式的記錄。
如要擷取作業記錄,請完成下列步驟:
- 在 GDC 控制台中選取專案。
- 在導覽選單中,依序點選「Operations」>「Logging」。
按一下「在 Grafana Loki 中查看所有記錄」。
在監控執行個體的 UI 中,按一下導覽選單中的「explore」(探索) Explore,開啟「Explore」頁面。
在「探索」列的下拉式選單中,選取「作業記錄」做為資料來源,即可擷取作業記錄。
輸入查詢,使用 LogQL (記錄查詢語言) 運算式依標籤搜尋記錄。您可以透過下列任一方式完成這個步驟:
- 使用互動式查詢建構工具 UI。然後按一下「執行查詢」。
- 直接在文字欄位中輸入 LogQL 運算式,然後按 Shift+Enter 鍵執行查詢。
頁面會顯示與查詢條件相符的記錄。
查詢記錄後,您可以匯出記錄。按一下「匯出」,即可下載純文字或 CSV 格式的記錄。
查詢稽核記錄
如要擷取稽核記錄,請完成下列步驟:
- 在 GDC 控制台中選取專案。
- 在導覽選單中,依序點選「作業」>「稽核記錄」。
按一下「在 Grafana Loki 中查看所有記錄」。
在監控執行個體的 UI 中,按一下導覽選單中的「explore」(探索) Explore,開啟「Explore」頁面。
在「探索」列的下拉式選單中,選取「稽核記錄」做為資料來源,以擷取稽核記錄。
輸入查詢,使用 LogQL (記錄查詢語言) 運算式依標籤搜尋記錄。您可以透過下列任一方式完成這個步驟:
- 使用互動式查詢建構工具 UI。然後按一下「執行查詢」。
- 直接在文字欄位中輸入 LogQL 運算式,然後按 Shift+Enter 鍵執行查詢。
頁面會顯示與查詢條件相符的記錄。
查詢記錄後,您可以匯出記錄。按一下「匯出」,即可下載純文字或 CSV 格式的記錄。
選取記錄檔的時間範圍
如要從監控執行個體的 UI 查詢特定時間範圍內的記錄,請按照下列步驟操作:
按一下「時間挑選器」下拉式選單。
在選單中執行下列任一操作:
- 選取相對時間範圍選項,例如過去 30 分鐘。
- 從日曆中選擇特定日期和時間,然後按一下「套用時間範圍」,即可設定自訂絕對時間範圍。
(選用) 按一下「變更時間設定」,即可透過時間範圍控制項變更「時區」和「會計年度」設定。
時間設定會儲存在個別資訊主頁中。如要進一步瞭解時間範圍查詢,請參閱 https://grafana.com/docs/loki/latest/reference/api/#query-loki-over-a-range-of-time。
查詢和標籤範例
以下列舉幾個可用於查詢記錄的預設標籤:
cluster:叢集名稱resources:資源清單namespace:您的專案命名空間node:節點名稱前置字串pod:Pod 名稱前置字串container:容器名稱前置字串
下表說明每個預設標籤,可用於從可觀測性平台查詢記錄:
| 記錄類型 | 標籤 | 值 |
|---|---|---|
| Kubernetes 容器記錄檔 | cluster |
CLUSTER_NAME |
resources |
k8s_container或k8s_audit |
|
namespace |
NAMESPACE_NAME | |
node |
NODE_NAME | |
pod |
POD_NAME | |
container |
CONTAINER_NAME | |
| 其他 Kubernetes 標籤 | ||
| 節點 journald 記錄 | cluster |
CLUSTER_NAME |
resources |
k8s_node |
|
node |
NODE_NAME | |
identifier |
SYSLOG_IDENTIFIER | |
machine |
MACHINE_ID |
查詢會使用 LogQL 查詢語言 https://grafana.com/docs/loki/latest/logql/。 下列程式碼範例顯示如何使用標籤和值查詢不同記錄:
選取專案中的所有記錄:
{cluster="user-vm-1-cluster", namespace="PROJECT_NAMESPACE"}將
PROJECT_NAMESPACE替換為專案的命名空間。選取服務的專案記錄檔:
{cluster="user-vm-1-cluster", namespace="PROJECT_NAMESPACE", container="my-service"}將
PROJECT_NAMESPACE替換為專案的命名空間。選取 Kubernetes API 伺服器記錄:
{cluster="admin", namespace="kube-system", resources="k8s_container", container="kube-apiserver"}選取叢集啟動程序記錄:
{cluster="admin", namespace="PROJECT_NAMESPACE"}將 PROJECT_NAMESPACE 替換為專案命名空間的名稱。例如:
cluster-user-test。選取節點 journald 記錄:
{cluster="admin", resources="k8s_node"}選取叢集稽核記錄:
{cluster="admin", resources="k8s_audit"}