This page provides troubleshooting tips and debugging strategies that you might find helpful if you're having trouble building or running your Dataflow pipeline. This information can help you detect a pipeline failure, determine the reason behind a failed pipeline run, and suggest some courses of action to correct the problem.
The following diagram shows the Dataflow troubleshooting workflow described in this page.

Dataflow provides real-time feedback about your job, and there is a basic set of steps you can use to check the error messages, logs, and for conditions such as your job's progress having stalled.
For guidance about common errors you might encounter when running your Dataflow job, see Troubleshoot Dataflow errors. To monitor and troubleshoot pipeline performance, see Monitor pipeline performance.
Best practices for pipelines
The following are the best practices for Java, Python, and Go pipelines.
Java
For batch jobs, we recommend that you set a time to live (TTL) for the temporary location.
Before setting up TTL and as a general best practice, ensure that you set both the staging location and the temporary location to different locations.
Do not delete the objects in the staging location as these objects are reused.
If a job completes or is stopped and the temporary objects are not cleaned up, manually remove these files from the Cloud Storage bucket that is used as a temporary location.
Python
Both the temporary and staging locations have a prefix of <job_name>.<time>.
Ensure that you set both the staging location and the temporary location to different locations.
If required, delete the objects in the staging location after a job completes or stops. Also, staged objects are not reused in Python pipelines.
If a job ends and the temporary objects are not cleaned up, manually remove these files from the Cloud Storage bucket that is used as a temporary location.
For batch jobs, we recommend that you set a time to live (TTL) for both the temporary and the staging locations.
Go
Both the temporary and staging locations have a prefix of
<job_name>.<time>.Ensure that you set both the staging location and the temporary location to different locations.
If required, delete the objects in the staging location after a job completes or stops. Also, staged objects are not reused in Go pipelines.
If a job ends and the temporary objects are not cleaned up, manually remove these files from the Cloud Storage bucket that is used as a temporary location.
For batch jobs, we recommend that you set a time to live (TTL) for both the temporary and the staging locations.
Check your pipeline's status
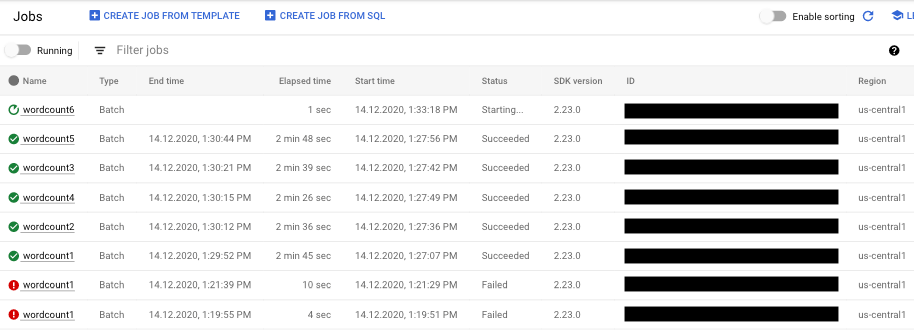
You can detect any errors in your pipeline runs by using the Dataflow monitoring interface.
- Go to the Google Cloud console.
- Select your Google Cloud Platform project from the project list.
- In the navigation menu, under Big Data, click Dataflow. A list of running jobs appears in the right-hand pane.
- Select the pipeline job you want to view. You can see the jobs' status at a glance in the Status field: "Running," "Succeeded," or "Failed."

Find information about pipeline failures
If one of your pipeline jobs fails, you can select the job to view more detailed information about errors and run results. When you select a job, you can view key charts for your pipeline, the execution graph, the Job info panel, and the Logs panel with Job logs, Worker logs, Diagnostics, and Recommendations tabs.
Check job error messages
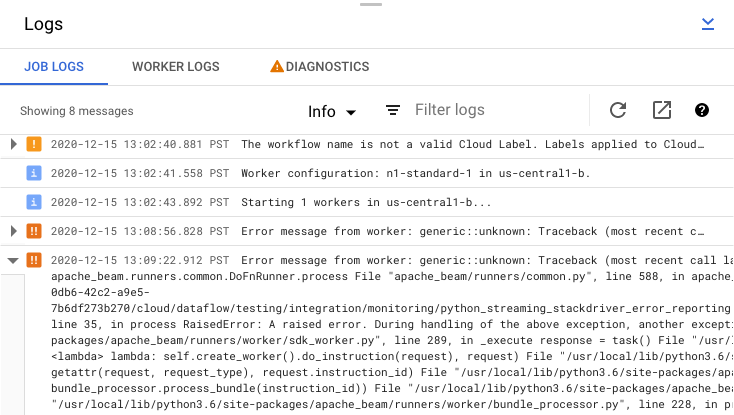
To view the Job Logs generated by your pipeline code and the Dataflow service, in the Logs panel, click segmentShow.
You can filter the messages that appear in Job logs by clicking Infoarrow_drop_down and filter_listFilter. To only display error messages, click Infoarrow_drop_down and select Error.
To expand an error message, click the expandable section arrow_right.

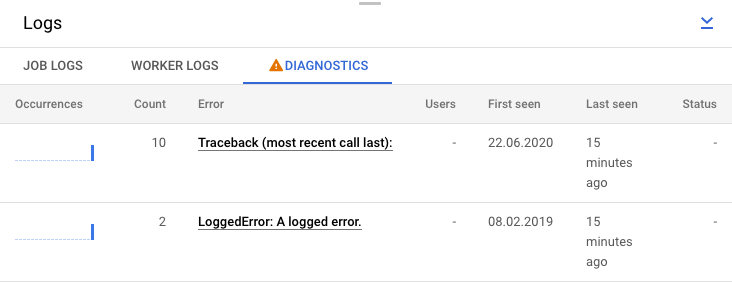
Alternatively, you can click the Diagnostics tab. This tab shows where errors occurred along the chosen timeline, a count of all logged errors, and possible recommendations for your pipeline.

View step logs for your job
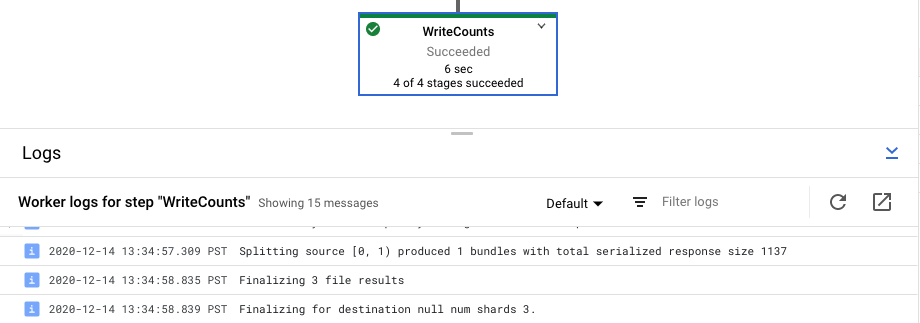
When you select a step in your pipeline graph, the logs panel toggles from displaying Job Logs generated by the Dataflow service to showing logs from the Compute Engine instances running your pipeline step.

Cloud Logging combines all of the collected logs from your project's Compute Engine instances in one location. See Logging pipeline messages for more information about using Dataflow's various logging capabilities.
Handle automated pipeline rejection
In some cases, the Dataflow service identifies that your pipeline might trigger known SDK issues. To prevent pipelines that are likely to encounter issues from being submitted, Dataflow automatically rejects your pipeline and displays the following message:
The workflow was automatically rejected by the service because it might trigger an
identified bug in the SDK (details below). If you think this identification is
in error, and would like to override this automated rejection, please re-submit
this workflow with the following override flag: [OVERRIDE FLAG].
Bug details: [BUG DETAILS].
Contact Google Cloud Support for further help.
Please use this identifier in your communication: [BUG ID].
After reading the caveats in the linked bug details, if you want to try to run
your pipeline anyway, you can override the automated rejection. Add the flag
--experiments=<override-flag> and resubmit your pipeline.
Determine the cause of a pipeline failure
Typically, a failed Apache Beam pipeline run can be attributed to one of the following causes:
- Graph or pipeline construction errors. These errors occur when Dataflow runs into a problem building the graph of steps that compose your pipeline, as described by your Apache Beam pipeline.
- Errors in job validation. The Dataflow service validates any pipeline job you launch. Errors in the validation process can prevent your job from being successfully created or executed. Validation errors can include problems with your Google Cloud project's Cloud Storage bucket, or with your project's permissions.
- Exceptions in worker code. These errors occur when there are errors or
bugs in the user-provided code that Dataflow distributes to
parallel workers, such as the
DoFninstances of aParDotransform. - Errors caused by transient failures in other Google Cloud services. Your pipeline might fail because of a temporary outage or other problem in the Google Cloud services upon which Dataflow depends, such as Compute Engine or Cloud Storage.
Detect graph or pipeline construction errors
A graph construction error can occur when Dataflow is building the execution graph for your pipeline from the code in your Dataflow program. During graph construction time, Dataflow checks for illegal operations.
If Dataflow detects an error in graph construction, keep in mind that no job is created on the Dataflow service. Thus, you don't see any feedback in the Dataflow monitoring interface. Instead, an error message similar to the following appears in the console or terminal window where you ran your Apache Beam pipeline:
Java
For example, if your pipeline attempts to perform an aggregation like
GroupByKey on a globally windowed, non-triggered,
unbounded PCollection, an error message similar to the following appears:
...
... Exception in thread "main" java.lang.IllegalStateException:
... GroupByKey cannot be applied to non-bounded PCollection in the GlobalWindow without a trigger.
... Use a Window.into or Window.triggering transform prior to GroupByKey
...
Python
For example, if your pipeline uses type hints and the argument type in one of the transforms is not as expected, an error message similar to the following occurs:
... in <module> run()
... in run | beam.Map('count', lambda (word, ones): (word, sum(ones))))
... in __or__ return self.pipeline.apply(ptransform, self)
... in apply transform.type_check_inputs(pvalueish)
... in type_check_inputs self.type_check_inputs_or_outputs(pvalueish, 'input')
... in type_check_inputs_or_outputs pvalue_.element_type))
google.cloud.dataflow.typehints.decorators.TypeCheckError: Input type hint violation at group: expected Tuple[TypeVariable[K], TypeVariable[V]], got <type 'str'>
Go
For example, if your pipeline uses a `DoFn` that doesn't take in any inputs, an error message similar to the following occurs:
... panic: Method ProcessElement in DoFn main.extractFn is missing all inputs. A main input is required.
... Full error:
...     inserting ParDo in scope root/CountWords
...     graph.AsDoFn: for Fn named main.extractFn
... ProcessElement method has no main inputs

... goroutine 1 [running]:
... github.com/apache/beam/sdks/v2/go/pkg/beam.MustN(...)
... (more stacktrace)
Should you encounter such an error, check your pipeline code to ensure that your pipeline's operations are legal.
Detect errors in Dataflow job validation
Once the Dataflow service has received your pipeline's graph, the service attempts to validate your job. This validation includes the following:
- Making sure the service can access your job's associated Cloud Storage buckets for file staging and temporary output.
- Checking for the required permissions in your Google Cloud project.
- Making sure the service can access input and output sources, such as files.
If your job fails the validation process, an error message appears in the Dataflow monitoring interface, as well as in your console or terminal window if you are using blocking execution. The error message looks similar to the following:
Java
INFO: To access the Dataflow monitoring console, please navigate to
  https://console.developers.google.com/project/google.com%3Aclouddfe/dataflow/job/2016-03-08_18_59_25-16868399470801620798
Submitted job: 2016-03-08_18_59_25-16868399470801620798
...
... Starting 3 workers...
... Executing operation BigQuery-Read+AnonymousParDo+BigQuery-Write
... Executing BigQuery import job "dataflow_job_16868399470801619475".
... Stopping worker pool...
... Workflow failed. Causes: ...BigQuery-Read+AnonymousParDo+BigQuery-Write failed.
Causes: ... BigQuery getting table "non_existent_table" from dataset "cws_demo" in project "my_project" failed.
Message: Not found: Table x:cws_demo.non_existent_table HTTP Code: 404
... Worker pool stopped.
... com.google.cloud.dataflow.sdk.runners.BlockingDataflowPipelineRunner run
INFO: Job finished with status FAILED
Exception in thread "main" com.google.cloud.dataflow.sdk.runners.DataflowJobExecutionException:
  Job 2016-03-08_18_59_25-16868399470801620798 failed with status FAILED
    at com.google.cloud.dataflow.sdk.runners.DataflowRunner.run(DataflowRunner.java:155)
    at com.google.cloud.dataflow.sdk.runners.DataflowRunner.run(DataflowRunner.java:56)
    at com.google.cloud.dataflow.sdk.Pipeline.run(Pipeline.java:180)
    at com.google.cloud.dataflow.integration.BigQueryCopyTableExample.main(BigQueryCopyTableExample.java:74)
Python
INFO:root:Created job with id: [2016-03-08_14_12_01-2117248033993412477]
... Checking required Cloud APIs are enabled.
... Job 2016-03-08_14_12_01-2117248033993412477 is in state JOB_STATE_RUNNING.
... Combiner lifting skipped for step group: GroupByKey not followed by a combiner.
... Expanding GroupByKey operations into optimizable parts.
... Lifting ValueCombiningMappingFns into MergeBucketsMappingFns
... Annotating graph with Autotuner information.
... Fusing adjacent ParDo, Read, Write, and Flatten operations
... Fusing consumer split into read
...
... Starting 1 workers...
...
... Executing operation read+split+pair_with_one+group/Reify+group/Write
... Executing failure step failure14
... Workflow failed.
Causes: ... read+split+pair_with_one+group/Reify+group/Write failed.
Causes: ... Unable to view metadata for files: gs://dataflow-samples/shakespeare/missing.txt.
... Cleaning up.
... Tearing down pending resources...
INFO:root:Job 2016-03-08_14_12_01-2117248033993412477 is in state JOB_STATE_FAILED.
Go
The job validation described in this section is not currently supported for Go. Errors due to these issues appear as worker exceptions.
Detect an exception in worker code
While your job is running, you might encounter errors or exceptions in your
worker code. These errors generally mean that the DoFns in your pipeline
code have generated unhandled exceptions, which result in failed tasks in your
Dataflow job.
Exceptions in user code (for example, your DoFn instances) are reported in the
Dataflow monitoring interface.
If you run your pipeline with blocking execution, error messages are
printed in your console or terminal window, such as the following:
Java
INFO: To access the Dataflow monitoring console, please navigate to https://console.developers.google.com/project/example_project/dataflow/job/2017-05-23_14_02_46-1117850763061203461
Submitted job: 2017-05-23_14_02_46-1117850763061203461
...
... To cancel the job using the 'gcloud' tool, run: gcloud beta dataflow jobs --project=example_project cancel 2017-05-23_14_02_46-1117850763061203461
... Autoscaling is enabled for job 2017-05-23_14_02_46-1117850763061203461.
... The number of workers will be between 1 and 15.
... Autoscaling was automatically enabled for job 2017-05-23_14_02_46-1117850763061203461.
...
... Executing operation BigQueryIO.Write/BatchLoads/Create/Read(CreateSource)+BigQueryIO.Write/BatchLoads/GetTempFilePrefix+BigQueryIO.Write/BatchLoads/TempFilePrefixView/BatchViewOverrides.GroupByWindowHashAsKeyAndWindowAsSortKey/ParDo(UseWindowHashAsKeyAndWindowAsSortKey)+BigQueryIO.Write/BatchLoads/TempFilePrefixView/Combine.GloballyAsSingletonView/Combine.globally(Singleton)/WithKeys/AddKeys/Map/ParMultiDo(Anonymous)+BigQueryIO.Write/BatchLoads/TempFilePrefixView/Combine.GloballyAsSingletonView/Combine.globally(Singleton)/Combine.perKey(Singleton)/GroupByKey/Reify+BigQueryIO.Write/BatchLoads/TempFilePrefixView/Combine.GloballyAsSingletonView/Combine.globally(Singleton)/Combine.perKey(Singleton)/GroupByKey/Write+BigQueryIO.Write/BatchLoads/TempFilePrefixView/BatchViewOverrides.GroupByWindowHashAsKeyAndWindowAsSortKey/BatchViewOverrides.GroupByKeyAndSortValuesOnly/Write
... Workers have started successfully.
...
... org.apache.beam.runners.dataflow.util.MonitoringUtil$LoggingHandler process SEVERE: 2017-05-23T21:06:33.711Z: (c14bab21d699a182): java.lang.RuntimeException: org.apache.beam.sdk.util.UserCodeException: java.lang.ArithmeticException: / by zero
        at com.google.cloud.dataflow.worker.runners.worker.GroupAlsoByWindowsParDoFn$1.output(GroupAlsoByWindowsParDoFn.java:146)
        at com.google.cloud.dataflow.worker.runners.worker.GroupAlsoByWindowFnRunner$1.outputWindowedValue(GroupAlsoByWindowFnRunner.java:104)
        at com.google.cloud.dataflow.worker.util.BatchGroupAlsoByWindowAndCombineFn.closeWindow(BatchGroupAlsoByWindowAndCombineFn.java:191)
...
... Cleaning up.
... Stopping worker pool...
... Worker pool stopped.
Python
INFO:root:Job 2016-03-08_14_21_32-8974754969325215880 is in state JOB_STATE_RUNNING.
...
INFO:root:... Expanding GroupByKey operations into optimizable parts.
INFO:root:... Lifting ValueCombiningMappingFns into MergeBucketsMappingFns
INFO:root:... Annotating graph with Autotuner information.
INFO:root:... Fusing adjacent ParDo, Read, Write, and Flatten operations
...
INFO:root:...: Starting 1 workers...
INFO:root:...: Executing operation group/Create
INFO:root:...: Value "group/Session" materialized.
INFO:root:...: Executing operation read+split+pair_with_one+group/Reify+group/Write
INFO:root:Job 2016-03-08_14_21_32-8974754969325215880 is in state JOB_STATE_RUNNING.
INFO:root:...: ...: Workers have started successfully.
INFO:root:Job 2016-03-08_14_21_32-8974754969325215880 is in state JOB_STATE_RUNNING.
INFO:root:...: Traceback (most recent call last):
  File ".../dataflow_worker/batchworker.py", line 384, in do_work self.current_executor.execute(work_item.map_task)
  ...
  File ".../apache_beam/examples/wordcount.runfiles/py/apache_beam/examples/wordcount.py", line 73, in <lambda>
ValueError: invalid literal for int() with base 10: 'www'
Go
... 2022-05-26T18:32:52.752315397Zprocess bundle failed for instruction
...     process_bundle-4031463614776698457-2 using plan s02-6 : while executing
...     Process for Plan[s02-6] failed: Oh no! This is an error message!
Consider guarding against errors in your code by adding exception handlers. For
example, if you'd like to drop elements that fail some custom input validation
done in a ParDo, handle the exception within your DoFn and drop the element.
You can also track failing elements in a few different ways:
- You can log the failing elements and check the output using Cloud Logging.
- You can check the Dataflow worker and worker startup logs for warnings or errors by following the instructions in Viewing logs.
- You can have your
ParDowrite the failing elements to an additional output for later inspection.
To track the properties of an executing pipeline, you can use the Metrics class,
as shown in the following example:
Java
final Counter counter = Metrics.counter("stats", "even-items");
PCollection<Integer> input = pipeline.apply(...);
...
input.apply(ParDo.of(new DoFn<Integer, Integer>() {
  @ProcessElement
  public void processElement(ProcessContext c) {
    if (c.element() % 2 == 0) {
      counter.inc();
    }
});
Python
class FilterTextFn(beam.DoFn):
      """A DoFn that filters for a specific key based on a regex."""

      def __init__(self, pattern):
        self.pattern = pattern
        # A custom metric can track values in your pipeline as it runs. Create
        # custom metrics to count unmatched words, and know the distribution of
        # word lengths in the input PCollection.
        self.word_len_dist = Metrics.distribution(self.__class__,
                                                  'word_len_dist')
        self.unmatched_words = Metrics.counter(self.__class__,
                                               'unmatched_words')

      def process(self, element):
        word = element
        self.word_len_dist.update(len(word))
        if re.match(self.pattern, word):
          yield element
        else:
          self.unmatched_words.inc()

    filtered_words = (
        words | 'FilterText' >> beam.ParDo(FilterTextFn('s.*')))
Go
func addMetricDoFnToPipeline(s beam.Scope, input beam.PCollection) beam.PCollection {
    return beam.ParDo(s, &MyMetricsDoFn{}, input)
}

func executePipelineAndGetMetrics(ctx context.Context, p *beam.Pipeline) (metrics.QueryResults, error) {
    pr, err := beam.Run(ctx, runner, p)
    if err != nil {
        return metrics.QueryResults{}, err
    }

    // Request the metric called "counter1" in namespace called "namespace"
    ms := pr.Metrics().Query(func(r beam.MetricResult) bool {
        return r.Namespace() == "namespace" && r.Name() == "counter1"
    })

    // Print the metric value - there should be only one line because there is
    // only one metric called "counter1" in the namespace called "namespace"
    for _, c := range ms.Counters() {
        fmt.Println(c.Namespace(), "-", c.Name(), ":", c.Committed)
    }
    return ms, nil
}

type MyMetricsDoFn struct {
    counter beam.Counter
}

func init() {
    beam.RegisterType(reflect.TypeOf((*MyMetricsDoFn)(nil)))
}

func (fn *MyMetricsDoFn) Setup() {
    // While metrics can be defined in package scope or dynamically
    // it's most efficient to include them in the DoFn.
    fn.counter = beam.NewCounter("namespace", "counter1")
}

func (fn *MyMetricsDoFn) ProcessElement(ctx context.Context, v beam.V, emit func(beam.V)) {
    // count the elements
    fn.counter.Inc(ctx, 1)
    emit(v)
}
Troubleshoot slow-running pipelines or lack of output
See the following pages:
Common errors and courses of action
When you know the error that caused the pipeline failure, see the Troubleshoot Dataflow errors page for error troubleshooting guidance.
