Selecciona la base de datos requerida de la lista.
En el menú de navegación, haz clic en Datastore Studio.
Tipos de estadísticas
La página del panel muestra datos de varias maneras:
Un gráfico circular que muestra el espacio utilizado por cada tipo de propiedad, como string, double o blob
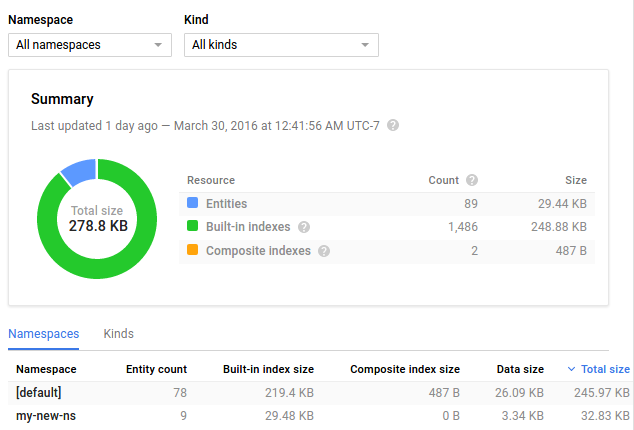
Un gráfico circular que muestra el espacio utilizado por tipo de entidad
Una tabla con el espacio total que usa cada tipo de propiedad. El tipo de propiedad “Metadatos” representa el espacio que consumen las propiedades de almacenamiento de una entrada que las propiedades no utilizan directamente. Si existe, la entidad “Estadísticas de Datastore” muestra el espacio consumido por los datos estadísticos en tu base de datos
Una tabla que muestra el tamaño total, el tamaño promedio, el recuento de entradas y el tamaño de todas las entidades, además de los índices integrados y compuestos
De forma predeterminada, los gráficos circulares muestran las estadísticas para todas las entidades. Puedes restringir los gráficos circulares a una categoría de entidad determinada desde el menú desplegable.
Límites de almacenamiento para las estadísticas
Los datos estadísticos se almacenan en la instancia de Datastore de la aplicación. El espacio que consumen los datos de las estadísticas aumenta en proporción a la cantidad de categorías de entidades y propiedades diferentes que use tu aplicación. Si usas espacios de nombres, cada uno contiene una copia completa de sus estadísticas. A fin de mantener la sobrecarga de almacenamiento y de actualización de las estadísticas dentro de un límite razonable, la base de datos borra las entidades de estadísticas de manera progresiva.
Para obtener más información sobre los datos de estadísticas y cómo Datastore borra las entidades de estadísticas de forma progresiva, consulta las Estadísticas del modo Datastore.
[[["Fácil de comprender","easyToUnderstand","thumb-up"],["Resolvió mi problema","solvedMyProblem","thumb-up"],["Otro","otherUp","thumb-up"]],[["Difícil de entender","hardToUnderstand","thumb-down"],["Información o código de muestra incorrectos","incorrectInformationOrSampleCode","thumb-down"],["Faltan la información o los ejemplos que necesito","missingTheInformationSamplesINeed","thumb-down"],["Problema de traducción","translationIssue","thumb-down"],["Otro","otherDown","thumb-down"]],["Última actualización: 2025-09-05 (UTC)"],[[["\u003cp\u003eThe Datastore Dashboard provides statistics on your application's data, accessible via the Google Cloud console's Databases page and then selecting Datastore Studio.\u003c/p\u003e\n"],["\u003cp\u003eStatistics are displayed through pie charts and tables, showing data usage by property type, entity kind, and overall space consumed by entities and indexes.\u003c/p\u003e\n"],["\u003cp\u003eThe statistics displayed include total space used, average size, entry count, and a breakdown of space usage by various property types, including metadata and datastore statistics themselves.\u003c/p\u003e\n"],["\u003cp\u003eWhile the charts show data for all entities by default, users can filter them to display data for a specific entity kind using a drop-down menu.\u003c/p\u003e\n"],["\u003cp\u003eStorage of statistics data depends on the number of different entity kinds, property types, and namespaces, and the database will progressively drop statistics entities to maintain reasonable storage overhead.\u003c/p\u003e\n"]]],[],null,["# Viewing Statistics in the Console\n\nThis page describes details of the statistics shown in the Datastore\nDashboard.\n\nViewing the statistics\n----------------------\n\nView statistics for your application's data in the Datastore\nDashboard.\n\n1. In the Google Cloud console, go to the **Databases** page.\n\n [Go to Databases](https://console.cloud.google.com/datastore/databases)\n2. Select the required database from the list of databases.\n\n3. In the navigation menu, click **Datastore Studio**.\n\n| **Note:** While Datastore removes individual entities almost immediately, a namespace container may remain visible for several days to a week after the final entity within it is removed.\n\nTypes of statistics\n-------------------\n\nThe Dashboard page displays data in various ways:\n\n- A pie chart that shows space used by each property\n type, such as string, double, or blob.\n\n- A pie chart showing space used by entity kind.\n\n- A table with the total space used by each property type. The \"Metadata\"\n property type represents space consumed by storing\n properties inside an entry that is not used by the properties directly. The\n \"Datastore Stats\" entity, if any, shows the space consumed by the statistics\n data itself in your database.\n\n- A table showing total size, average size, entry count, and the size of all\n entities, and the built-in and composite indexes.\n\n| **Note:** Operations generated by Datastore Statistics count against your [quota](/datastore/docs/pricing).\n\nBy default, the pie charts display statistics for all entities. You can restrict\nthe pie charts to a particular entity kind by choosing from the drop-down menu.\n\nStorage limitations for statistics\n----------------------------------\n\nThe statistics data is stored in your application's Datastore\ninstance. The space consumed by the statistics data increases in proportion to\nthe number of different entity kinds and property types used by your\napplication. If you use namespaces, each namespace contains a complete copy of\nthe stats for that namespace. To keep the overhead of storing and updating the\nstatistics reasonable, the database progressively drops statistics\nentities.\n\nFor details on statistics data and how Datastore progressively\ndrops statistics entities, see [Datastore mode Statistics](/datastore/docs/concepts/stats)."]]