이벤트 타임라인: 시스템 이벤트를 시간순으로 표시합니다.
이 정보는 시스템 이벤트가 인스턴스의 상태와 성능에 미치는 영향을 평가하는 데 도움이 됩니다.
요약 카드: CPU 사용률, 디스크 사용률, 로그 오류 측정항목에 대한 최신 값과 집계된 값을 표시하여 인스턴스 상태 및 성능에 대한 개요를 제공합니다.
측정항목 차트: 처리량, 지연 시간, 비용과 같은 여러 문제에 대한 유용한 정보를 얻는 데 도움이 되는 운영체제 및 데이터베이스 측정항목에 대한 정보를 표시합니다.
대시보드는 다음과 같은 간략한 옵션을 제공합니다.
맞춤설정된 대시보드를 만들려면 대시보드 맞춤설정을 클릭합니다.
대시보드를 최신 상태로 유지하려면 자동 새로고침 옵션을 사용 설정합니다. 자동 새로고침을 사용 설정하면 대시보드 데이터가 1분마다 업데이트됩니다. 이 기능은 맞춤설정된 기간과 호환되지 않습니다.
기본적으로 시간 선택기에는 선택된 1 day가 표시됩니다. 기간을 변경하려면 사전 정의된 다른 기간 중 하나를 선택하거나 커스텀을 클릭하고 시작 및 종료 시간을 정의합니다. 지난 30일 동안의 데이터가 제공됩니다.
대시보드의 절대 링크를 만들려면 링크 복사 버튼을 클릭합니다.
같은 권한이 있는 다른 Cloud SQL 사용자와 이 링크를 공유할 수 있습니다.
특정 이벤트에 대한 알림을 만들려면
notifications 알림을 클릭합니다.
특정 알림을 표시하려면 주석을 클릭합니다.
요약 카드
다음 표에서는 시스템 통계 대시보드 상단에 표시되는 요약 카드를 설명합니다. 이러한 카드에서는 선택한 기간 동안의 인스턴스 상태 및 성능에 대한 간략한 개요를 제공합니다.
요약 카드
설명
CPU 사용률 - P50
P50 CPU 사용률 값입니다.
CPU 사용률 - P99
P99 CPU 사용률 값입니다.
디스크 사용률
최신 디스크 사용률 값입니다.
로그 오류
로깅된 오류 수입니다.
측정항목 차트
각 차트 카드의 툴바는 다음과 같은 표준 옵션 집합을 제공합니다.
선택한 기간의 특정 시점에 대한 측정항목 값을 보려면 커서를 차트 위로 이동합니다.
차트를 확대하려면 차트를 클릭하고 x축을 따라 가로로 또는 y축을 따라 세로로 드래그합니다. 확대/축소 작업을 되돌리려면 확대/축소 재설정을 클릭합니다. 또는 대시보드 상단에 있는 사전 정의된 기간 중 하나를 클릭합니다. 확대/축소 작업은 대시보드의 모든 차트에 동시 적용됩니다.
추가 옵션을 보려면 more_vert차트 옵션 더보기를 클릭합니다. 대부분의 차트에서 다음 옵션을 제공합니다.
차트를 전체 화면 모드로 보려면 전체 화면 보기를 클릭합니다. 전체 화면 모드를 종료하려면 취소를 클릭합니다.
범례를 숨기거나 접습니다.
차트의 PNG 또는 CSV 파일을 다운로드합니다.
측정항목 탐색기에서 보기. 측정항목 탐색기에서 측정항목을 봅니다.
Cloud SQL 데이터베이스 리소스 유형을 선택하면 측정항목 탐색기에서 다른 Cloud SQL 측정항목을 볼 수 있습니다.
커스텀 대시보드를 만들려면 edit대시보드 맞춤설정을 클릭하고 이름을 지정합니다. 또는 사전 정의됨 메뉴를 펼치고 기존 커스텀 대시보드를 선택합니다.
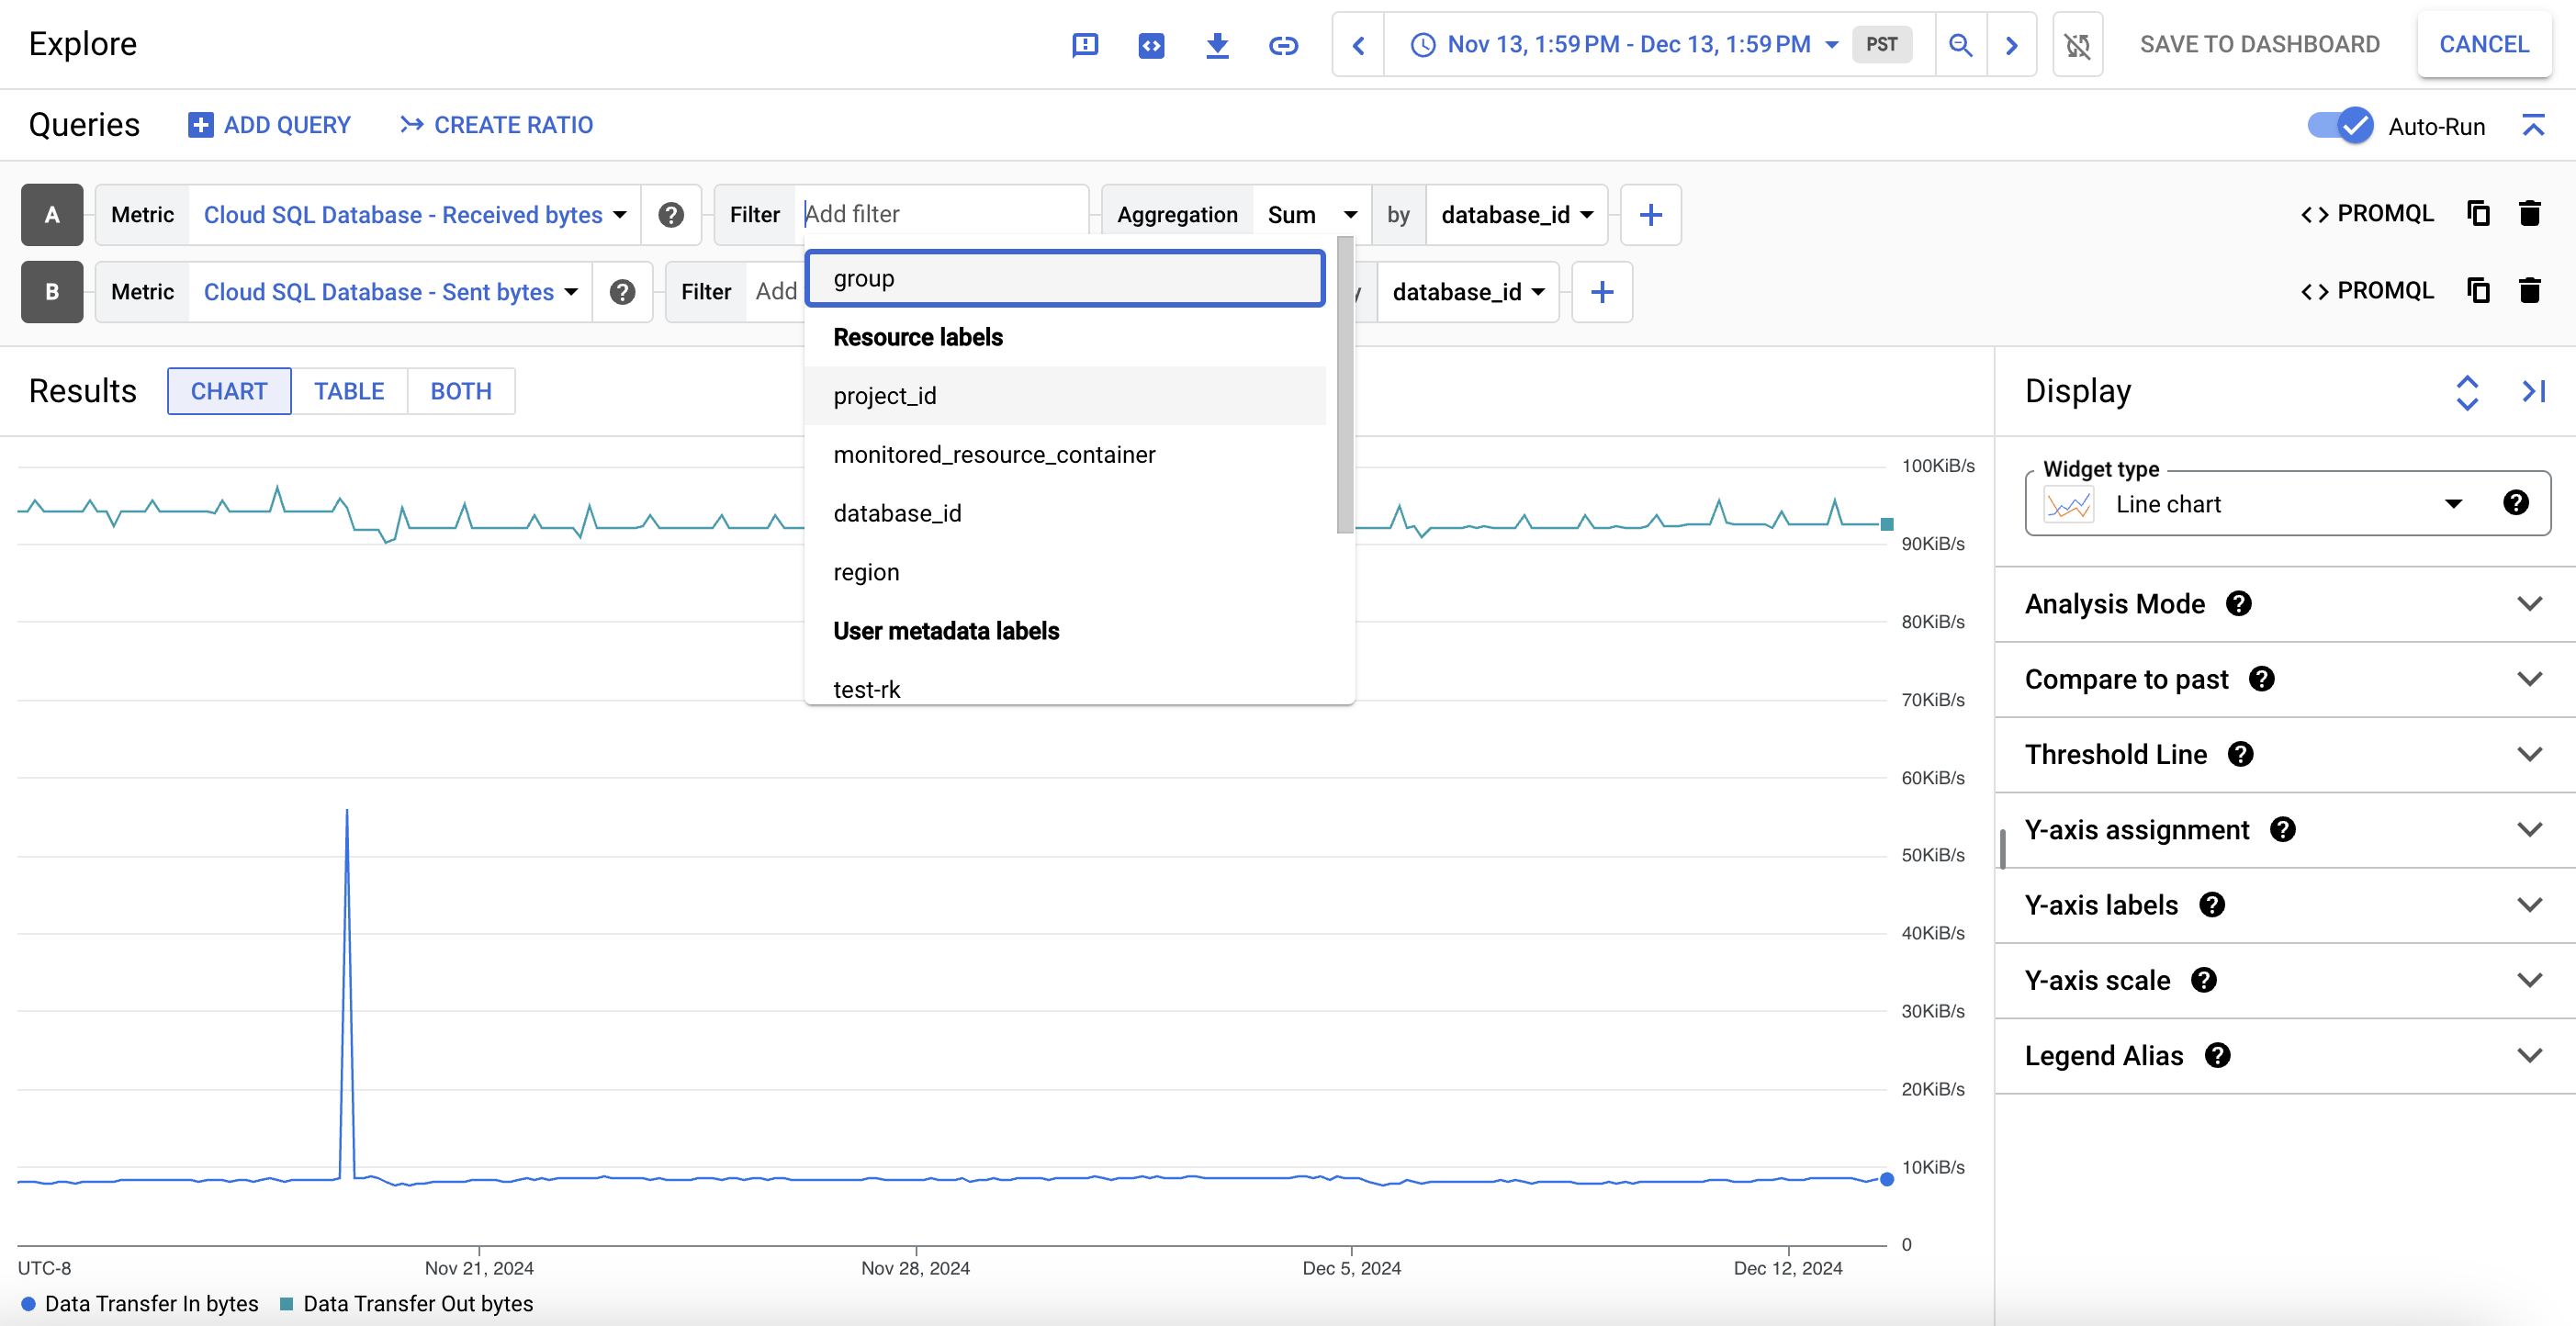
측정항목 차트의 데이터를 자세히 보려면 query_stats데이터 탐색을 클릭합니다. 여기에서 특정 측정항목을 필터링하고 차트 표시 방식을 선택할 수 있습니다.
이 맞춤설정된 뷰를 측정항목 차트로 저장하려면 대시보드에 저장을 클릭합니다.
기본 측정항목
다음 표에서는 Cloud SQL 시스템 통계 대시보드에 기본적으로 표시되는 Cloud SQL 측정항목을 설명합니다.
측정항목 이름 및 유형
설명
쿼리 지연 시간 dbinsights.googleapis.com/ aggregate/latencies
사용자 및 데이터베이스당 P99, P95, P50 기준별로 집계된 쿼리 지연 시간 분포입니다.
open_table_definitions는 현재 열려 있는 테이블 정의의 수입니다.
opened_table_definitions_count는 마지막 샘플 이후 데이터베이스가 테이블 정의를 연 횟수입니다. opened_table_definitions_count 값이 지속적으로 높으면 table_definition_cache 값을 늘리는 것이 좋습니다.
InnoDB 데이터 사전 캐시의 메모리 사용량입니다. InnoDB에는 테이블, 열, 색인, 외래 키 등 데이터베이스 객체에 대한 정보를 저장하기 위한 자체 캐시가 있습니다.
table_definition_cache는 이 캐시의 테이블 수에 대한 소프트 한도를 설정합니다. 그러나 외래 키 관계가 있는 테이블은 데이터베이스가 종료되거나 다시 시작될 때까지 캐시에 유지됩니다. 인스턴스에 외래 키 관계가 있는 테이블이 많은 경우 이 캐시는 상당한 양의 메모리를 소비할 수 있습니다.
유형별 디스크 스토리지 cloudsql.googleapis.com/ database/disk/bytes_used_by_data_type
data, binlog, tmp_data 등 데이터 유형별 인스턴스 디스크 사용량의 분류입니다.
이 측정항목을 사용하면 스토리지 비용을 파악할 수 있습니다. 스토리지 사용 비용에 대한 자세한 내용은 스토리지 및 네트워킹 가격 책정을 참조하세요.
PITR(point-in-time recovery)에서는 바이너리 로그를 사용합니다. Cloud SQL은 정기적으로 새 로그를 생성하며 이러한 로그는 저장공간을 사용합니다. Cloud SQL은 바이너리 로그와 연결된 자동 백업을 자동으로 삭제합니다. 일반적으로 transactionLogRetentionDays에 설정된 보관 값이 충족된 후에 발생합니다.
transactionLogRetentionDays는 Cloud SQL이 트랜잭션 로그를 보관하는 일수입니다. 값의 범위는 1~7입니다.
PITR을 사용하는 동안 예기치 않은 스토리지 문제가 발생하지 않도록 스토리지 자동 증가를 사용 설정하는 것이 좋습니다.
read_ops_count는 디스크 읽기 I/O 작업의 델타 수를 나타냅니다.
이 측정항목을 사용하여 인스턴스 크기가 사용자 환경에 맞게 지정되었는지 파악할 수 있습니다.
필요한 경우 더 큰 머신 유형으로 전환하여 캐시에서 더 많은 요청을 처리하고 지연 시간을 줄일 수 있습니다.
write_ops_count는 디스크 쓰기 I/O 작업의 델타 수를 나타냅니다. Cloud SQL 인스턴스(복제본 제외)는 약 1초 간격으로 시스템 테이블에 쓰기를 수행합니다.
[[["이해하기 쉬움","easyToUnderstand","thumb-up"],["문제가 해결됨","solvedMyProblem","thumb-up"],["기타","otherUp","thumb-up"]],[["이해하기 어려움","hardToUnderstand","thumb-down"],["잘못된 정보 또는 샘플 코드","incorrectInformationOrSampleCode","thumb-down"],["필요한 정보/샘플이 없음","missingTheInformationSamplesINeed","thumb-down"],["번역 문제","translationIssue","thumb-down"],["기타","otherDown","thumb-down"]],["최종 업데이트: 2025-08-13(UTC)"],[],[],null,["# Use system insights to improve system performance\n\n\u003cbr /\u003e\n\nMySQL \\| [PostgreSQL](/sql/docs/postgres/use-system-insights \"View this page for the PostgreSQL database engine\") \\| [SQL Server](/sql/docs/sqlserver/use-system-insights \"View this page for the SQL Server database engine\")\n\n\u003cbr /\u003e\n\n\u003cbr /\u003e\n\n|\n| **Preview**\n|\n|\n| This feature is subject to the \"Pre-GA Offerings Terms\" in the General Service Terms section\n| of the [Service Specific Terms](/terms/service-terms#1).\n|\n| Pre-GA features are available \"as is\" and might have limited support.\n|\n| For more information, see the\n| [launch stage descriptions](/products#product-launch-stages).\n\nThis page describes how you can use the Cloud SQL System insights dashboard.\nThe System insights dashboard displays metrics for the resources that your\ninstance uses and helps you detect and analyze system performance problems.\nYou can use Gemini in Databases assistance to help you observe and troubleshoot your Cloud SQL for MySQL resources. For more information, see [Observe and troubleshoot with Gemini assistance](/sql/docs/mysql/observe-troubleshoot-with-gemini).\n\nView the System insights dashboard\n----------------------------------\n\nTo view the System insights dashboard, do the following:\n\n1. In the Google Cloud console, go to the **Cloud SQL Instances** page.\n\n [Go to Cloud SQL Instances](https://console.cloud.google.com/sql)\n2. Click the name of an instance.\n3.\n Select the **System insights** tab from the SQL navigation panel on the left.\n\nThe System insights dashboard opens.\n\n\u003cbr /\u003e\n\n**Figure 1.** Dashboard image showing events timeline and summary cards.\n\n\u003cbr /\u003e\n\nThe System insights dashboard shows the following information:\n\n1. Your instance details\n\n2. [Events timeline](/sql/docs/mysql/use-system-insights#events_timeline):\n shows the system events, in a chronological order.\n This information helps you evaluate the impact of system events on the health\n and performance of the instance.\n\n3. [Summary cards](/sql/docs/mysql/use-system-insights#summary):\n provide an overview of the instance health and performance by displaying the\n latest and aggregated values for the CPU utilization, disk utilization, and\n log errors metrics.\n\n4. [Metrics charts](/sql/docs/mysql/use-system-insights#metrics): show the\n information about the operating system and database metrics that help you gain\n insight into several issues, such as throughput, latency, and cost.\n\nThe dashboard offers the following high-level options:\n\n- To create a customized dashboard, click **Customize dashboard**.\n\n\u003c!-- --\u003e\n\n- To keep the dashboard up to date, enable the\n\n **Auto Refresh** option. When you enable **Auto Refresh**, the dashboard data\n updates every minute. This feature isn't compatible with customized time\n periods.\n\n- The time selector shows `1 day` selected by default. To change the period,\n select one of the other predefined periods or click **Custom** and define a\n start and end time. Data is available for the last 30 days.\n\n- To create an absolute link to the dashboard, click the **Copy Link** button.\n You can share this link with other Cloud SQL users who have the same\n permissions.\n\n- To create an alert for a specific event, click notifications **Notification**.\n\n- To display specific alerts, click **Annotations**.\n\nSummary cards\n-------------\n\nThe following table describes the summary cards displayed at the top of the System\nInsights dashboard. These cards provide a brief overview of the instance's health\nand performance during the chosen time period.\n\nMetrics charts\n--------------\n\nThe toolbar on each chart card provides the following set of standard options:\n\n- To view metric values for a specific moment in the selected period, move the\n cursor over the chart.\n\n- To zoom in on a chart, click the chart and drag horizontally along the x-axis\n or vertically along the y-axis. To revert the zoom operation, click\n **Reset zoom**. Or, click one of the predefined time periods at the top of the\n dashboard. Zoom operations apply at the same time to all charts on a dashboard.\n\n- To view additional options, click *more_vert*\n **More chart options**. Most charts offer these options:\n\n - To view a chart in full-screen mode, click **View in full screen** . To exit\n full-screen mode, click **Cancel**.\n\n - Hide or collapse the legend.\n\n - Download a PNG or CSV file of the chart.\n\n - **View in Metrics Explorer** . View the metric in [Metrics Explorer](/monitoring/charts/metrics-explorer).\n You can view other Cloud SQL metrics in the Metrics Explorer after\n selecting the **Cloud SQL Database** resource type.\n\n- To create a custom dashboard, click *edit*\n **Customize dashboard** and give it a name. Or, expand the **Predefined** menu\n and select an existing custom dashboard.\n\n- To view a metric chart's data in detail, click *query_stats*\n **Explore data**. Here, you can filter specific metrics and choose how the\n chart displays:\n\n To save this customized view as a metric chart, click **Save to dashboard**.\n\nDefault metrics\n---------------\n\nThe following table describes the Cloud SQL metrics that appear by default\non the Cloud SQL System insights dashboard.\n| **Note:** Cloud SQL for MySQL instances with more than 500 databases report a single aggregated value for database metrics.\n\n\u003cbr /\u003e\n\n\u003cbr /\u003e\n\n\u003cbr /\u003e\n\n\u003cbr /\u003e\n\n\u003cbr /\u003e\n\n\u003cbr /\u003e\n\n\u003cbr /\u003e\n\n\u003cbr /\u003e\n\n\u003cbr /\u003e\n\n\u003cbr /\u003e\n\n\u003cbr /\u003e\n\n\u003cbr /\u003e\n\n\u003cbr /\u003e\n\nFor more information, see [Cloud SQL metrics](/sql/docs/mysql/admin-api/metrics).\n\nEvents timeline\n---------------\n\nThe dashboard provides the details of the following events:\n\nWhat's next\n-----------\n\n- [About instance settings](/sql/docs/mysql/instance-settings)\n- [Cloud SQL metrics](/sql/docs/mysql/admin-api/metrics)\n- [REST Resource: instances](/sql/docs/mysql/admin-api/rest/v1beta4/instances)"]]

 자동 새로고침 옵션을 사용 설정합니다. 자동 새로고침을 사용 설정하면 대시보드 데이터가 1분마다 업데이트됩니다. 이 기능은 맞춤설정된 기간과 호환되지 않습니다.