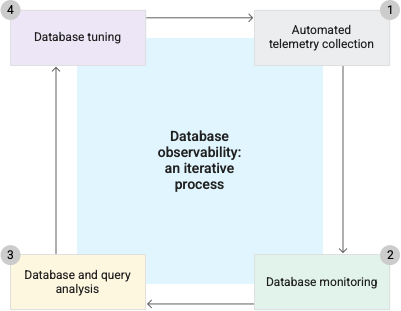
Database observability is a measure of how accurately you can infer the internal state of a database system based on the data, or telemetry, that it generates in logs, metrics, and traces.
Diagnosing and troubleshooting issues in an application can be particularly difficult and time-consuming when a database is involved. Telemetry collection is crucially important. Telemetry, when enriched with application context, can make database instances more understandable, observable, and easier to maintain. You can identify issues and problematic trends easily and remedy them early, without having to incur costly downtime. Moreover, by using such data, you can configure newer database instances to collect the right kind of data from the moment they start.
You can use data effectively and proactively to prevent issues and focus on strategic innovation. Good telemetry collection is particularly useful in the DevOps model, where database generalists need to independently analyze telemetry to monitor, evaluate, and optimize the performance and health of their rapidly evolving applications.
Google Cloud offers several powerful features spanning the four iterative observability stages to help you maintain the health of your Cloud SQL database.

Automated telemetry collection
To achieve observability goals, we start by collecting telemetry, preferably through an automated process. When collected over a period, telemetry helps establish a baseline for metrics under different load conditions.
Google Cloud services automatically generate observability data, including metrics, logs, and traces, which can help provide a complete observability overview.
Cloud Monitoring collects measurements of your service and of the Google Cloud resources that you use. Cloud SQL uses built-in memory custom agents to collect query telemetry, resulting in a lower impact on performance and eliminating the need for agent maintenance or security overhead.
Cloud Logging collects logging data from common application components. For Cloud SQL, see also View instance logs.
Cloud Trace collects latency data and executed query plans from applications to help you track how requests propagate through your application. You can compare these latency distributions over time or across versions. Cloud Trace alerts you when it detects a significant shift in the latency profile of your application when it's instrumented to use Cloud Trace.
Sqlcommenter, an OpenTelemetry library for databases helps you monitor your databases through the lens of an application. Sqlcommenter automatically instruments ORMs to augment SQL statements with tags and allows OpenTelemetry trace context information to be propagated to the database.
With tags and trace application context in databases, it's easy to correlate application code with database performance and troubleshoot microservices-based architectures.
Database monitoring
Proper monitoring helps you determine whether your application is working optimally. Implement monitoring early, such as before you initiate a migration or deploy a new application to a production environment. Disambiguate between application issues and underlying cloud issues.
The Cloud SQL Overview page shows graphs for some of the key metrics.
Cloud SQL also helps you compare metrics for selected instances.
You can use Cloud Monitoring to create custom dashboards that help you monitor metrics and to set up alert policies so that you can receive timely notifications.
Database and query analysis
The Cloud SQL Query Insights tool provides monitoring and diagnostics that let you detect and fix query performance problems.
Query Insights dashboards help you identify query performance problems early and let you move from detection to resolution by using a single interface. Built-in, visual query plans assist you in troubleshooting issues to find the root cause. You can also use in-context, end-to-end application tracing to find the source of a problematic query.
Query Insights provides application-centric monitoring that helps you diagnose performance problems for applications built using object-relational mappings (ORMs). You can tag queries with business logic that the query is associated with, such as payment, inventory, business analytics, or shipping. Query Insights can integrate with your existing APM tools, letting you monitor and troubleshoot query problems using your favorite tool.
The Query Insights tool uses sqlcommenter to automatically instrument your ORMs. This instrumentation helps you identify the application code that's causing problems. Query Insights supports OpenTelemetry standards and makes the query metrics and traces data available for your APM tools through the Google Cloud Observability API.
Query Insights integrates with Cloud Monitoring, letting you create custom dashboards and alerts on query metrics or tags and receive notifications using email, SMS, Slack, PagerDuty, and more.
Database tuning
You can iteratively troubleshoot and tune your database.
Cloud SQL recommenders help you analyze the current usage of your database and provide recommendations and insights based on heuristic methods and machine learning.
Cloud SQL recommenders are briefly described as follows:
| Name | Description |
|---|---|
| Out-of-disk recommender | Reduce the risk of downtime that might be caused by your Cloud SQL instances running out of disk space. |
| Idle instance recommender | Reduce costs by shutting down Cloud SQL instances that are inadvertently idle. |
| Overprovisioned instance recommender | Reduce costs by resizing Cloud SQL instances that are unnecessarily large for a given workload. |
| Underprovisioned instance recommender | Avoid bottlenecks from high CPU and memory usage and minimize the likelihood of out-of-memory events by resizing Cloud SQL instances that have high CPU and/or memory usage. |
| High number of open tables recommender | Optimize the performance of your instance by increasing the size of table open cache for the Cloud SQL instances that have the number of open tables equal to the table open cache and keep opening too many tables concurrently. |
| High number of tables recommender | Optimize the performance of your instance by reducing the number of tables for the Cloud SQL instances whose table count is too high and close to the SLA limit. |
What's next
- View the list of Cloud SQL metrics.
- Learn more about Cloud Logging and Cloud Monitoring. See also View instance logs.
- Troubleshoot and tune your database instance.
- Learn more about Google Cloud recommenders.
