Use case: Troubleshoot hybrid connectivity
In the following use cases, you're a network administrator supporting a network that includes Interconnect connections, VPN tunnels, or router appliance instances to on-premises networks. You want to view bandwidth to on-premises networks and diagnose bottlenecks and other network problems. You want to learn about the network utilization of the VPN tunnels, VLAN attachments and Interconnect connections, or router appliance instances.
The following use cases demonstrate how Network Topology can help you quickly monitor and identify any issues in your network.
Interconnect topology details
In this topology, the node australia-southeast1 is expanded. You can
see the associated Interconnect connections and the (not-yet expanded) node
collecting VPN tunnels. In addition, one Interconnect connection is
expanded, and you can see the associated VLAN attachments. The Interconnect
connection is the enclosing entity and it includes VLAN attachments. Because the
Interconnect connection and VLAN attachments are regional resources, they appear
within the region where they are located. The Interconnect connection has two
endpoints, one in the Google Cloud network and the other in the on-premises
network.
The following topology shows the hierarchy of the network topology.
Interconnect bandwidth throughput
In this scenario, you can perform the following actions:
Monitor the utilization of your VLAN attachments and Interconnect connections so that you can make better-informed decisions when planning for network growth.
Select a VLAN attachment. Click the traffic metrics, such as ingress bytes count, and see the traffic bandwidth traversing the VLAN attachment to Google Cloud from the on-premises network.
Hold the pointer over an entity, such as a VLAN attachment. Click the traffic metrics, such as egress bytes count, to view the bandwidth throughput to on-premises networks and diagnose bottlenecks and any other network problems.
For any entity metrics, expand the time series charts to the required time selection to view any bandwidth bottlenecks.
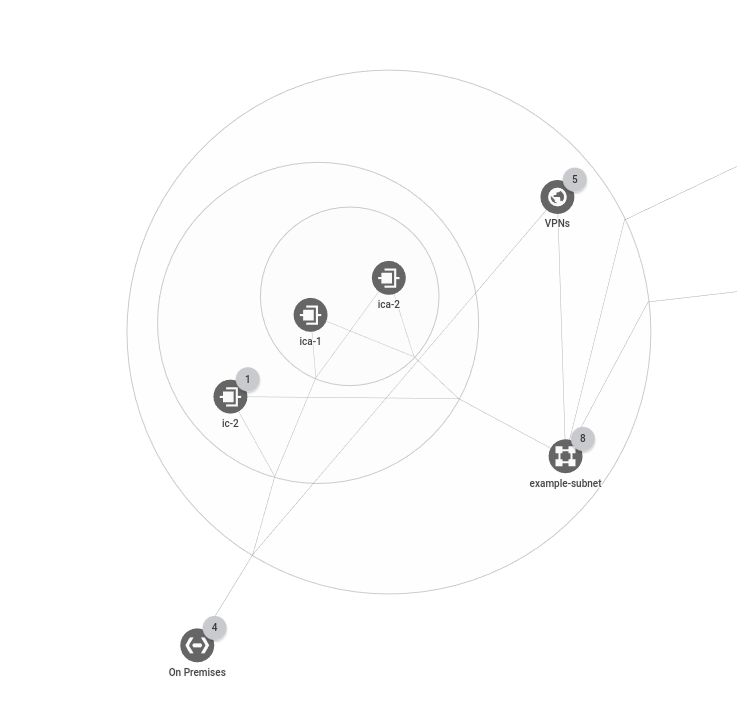
VPN gateway topology details
In this topology, a node that has a VPN gateway and a VPN tunnel is expanded. Hierarchically in the Network Topology topology interface, within each Cloud VPN gateway, you can see one or more VPN tunnels. The Cloud VPN gateway has two endpoints, one in Google Cloud network and the other in the on-premises network.
The following topology shows the hierarchy of the network topology with VPN tunnels:
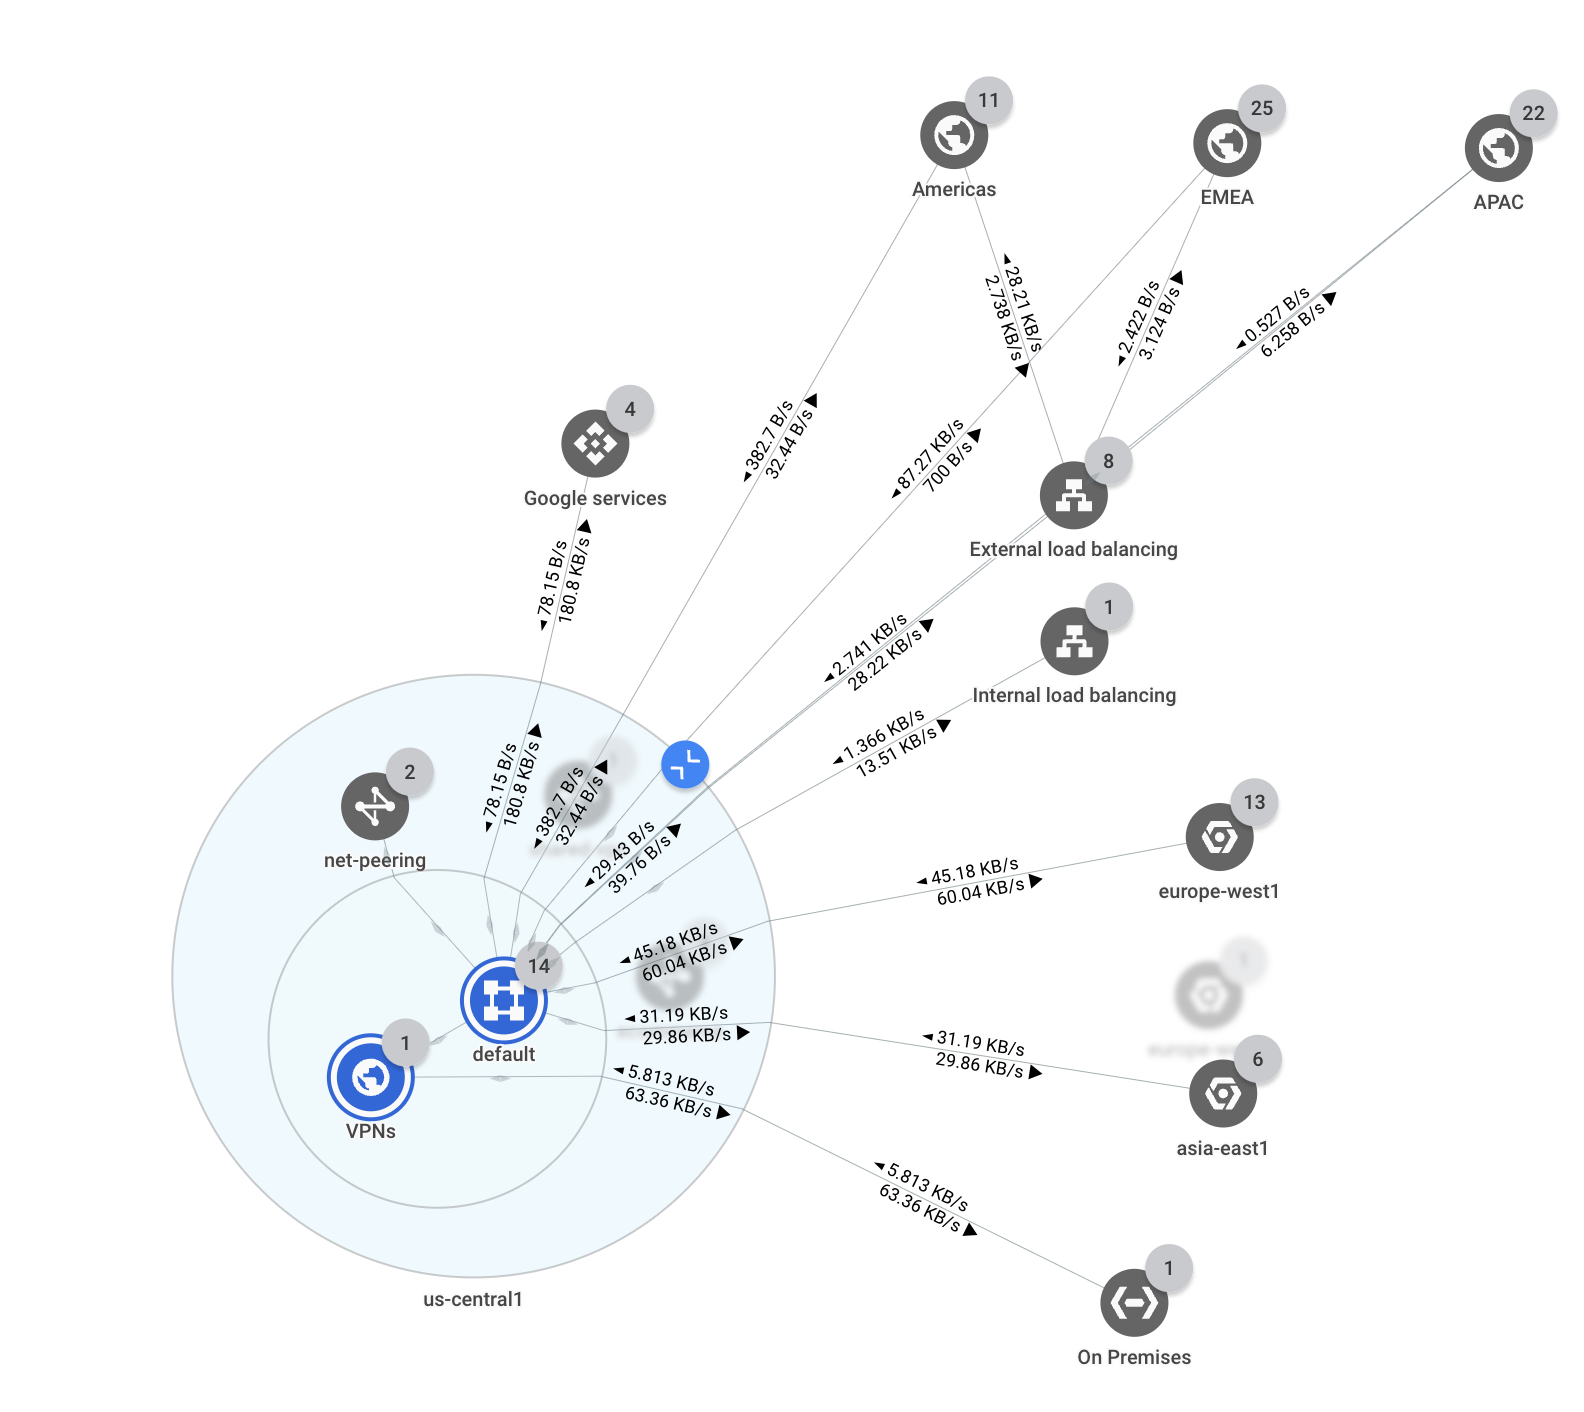
VPN bandwidth throughput
In this topology, the node us-central1 is expanded, and you can see the
associated peering connections, gateways, and VPN tunnels connected to
on-premises networks. An on-premises network can refer to any remote network
that is outside the Google Cloud domain.
In this scenario, you can perform the following actions:
Monitor the network utilization of the VPN tunnel to make empowered decisions for planning your network growth.
Select the VPN tunnel. Click the traffic metrics, such as ingress bytes count, and see the traffic bandwidth traversing the VPN tunnel to Google Cloud from the on-premises network.
Hold the pointer over the VPN tunnel. Click the traffic metrics, such as egress bytes count, to view the bandwidth throughput to on-premises networks and diagnose bottlenecks and any other network problems.
For any entity metrics, expand the time series charts to the required time selection to view any bandwidth bottlenecks.
Router appliance details
In a typical topology that includes a router appliance instance connected to an on-premises network, you can see the router appliance instance. Because the router appliance instances are regional resources, they appear within the region where they are located. The router appliance instance has two endpoints, one in the Google Cloud network and the other in the on-premises network.
Router appliance bandwidth throughput
In this scenario, you can perform the following actions:
Monitor usage of your router appliance instance so that you can make better-informed decisions when planning for network growth.
Select a router appliance instance. Click the traffic metrics, such as ingress bytes count or egress bytes count, and see the traffic bandwidth traversing the router appliance instance between Google Cloud and the on-premises network. Diagnose bottlenecks and any other network problems.
For any entity metrics, expand the time series charts to the required time selection to view any bandwidth bottlenecks.
What's next
- Monitor your networking configuration with Network Topology
- Use case: Audit network performance
- Troubleshoot Network Topology
- Cloud Interconnect quotas and limits
- Cloud VPN quotas and limits