Use case: Troubleshoot GKE connectivity
In this use case, you're a network administrator supporting a network that includes several GKE namespaces. You've been alerted of a latency problem and have been told that your organization's mobile application is intermittently slow and timing out. You know that a number of different users are affected, and that there have been no recent application deployments. The issue is likely related to a specific GKE cluster.
The following use case demonstrates how Network Topology can help you quickly troubleshoot and investigate issues in your GKE deployment.
Topology details
The deployment spans three Google Cloud regions (us-central1,
europe-west1, and asia-east1). All external client requests are served by
the three clusters within the three regions with multiple namespaces. Client requests
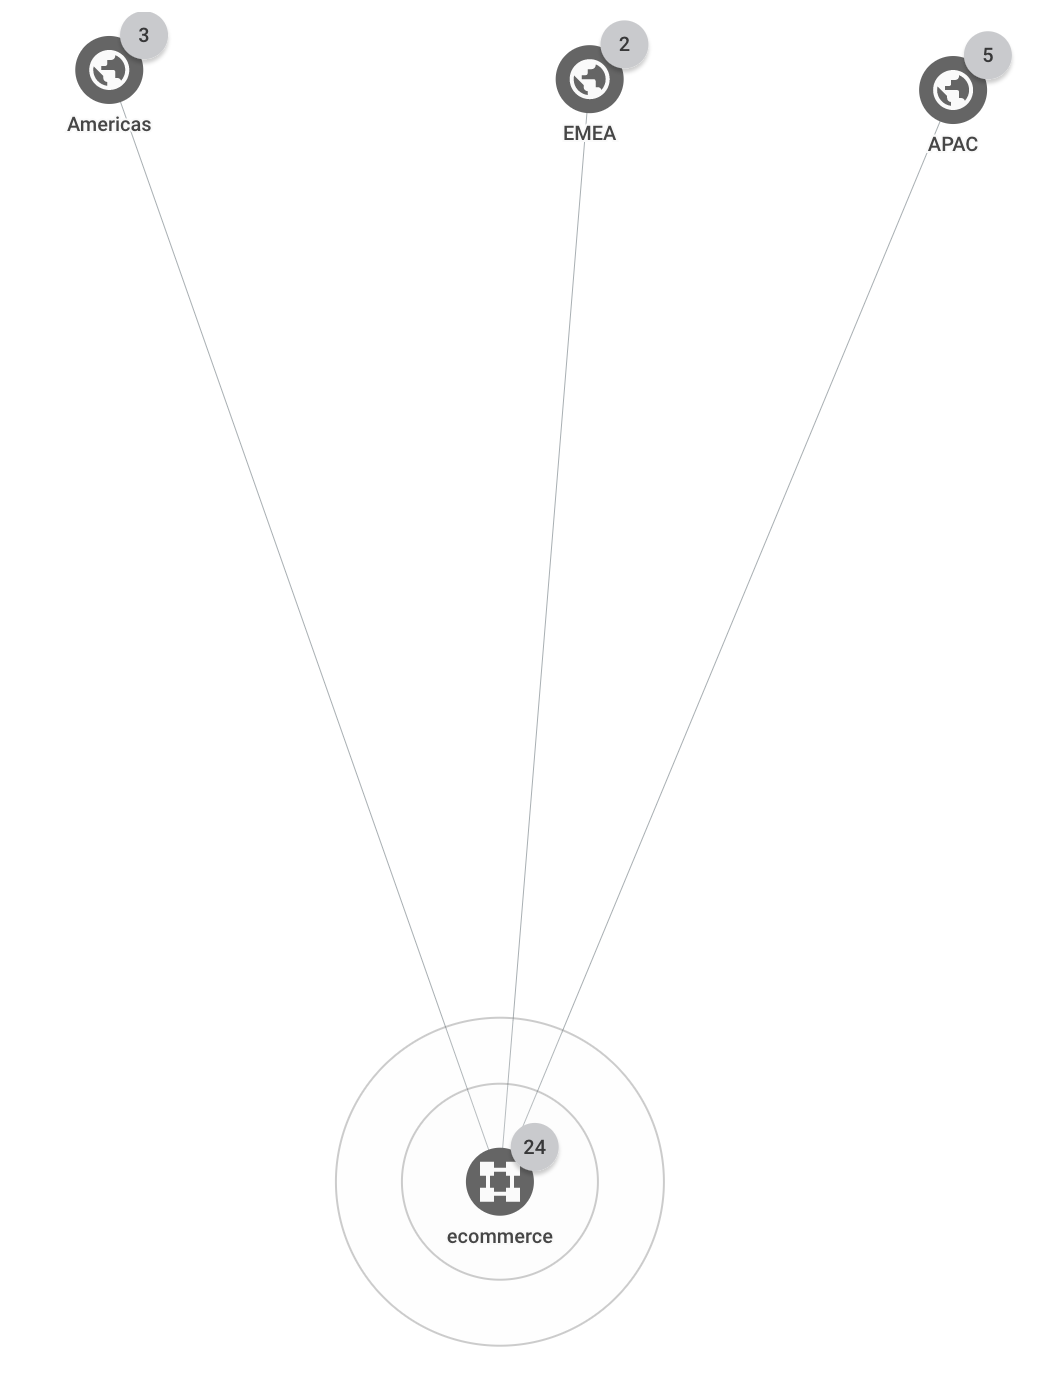
that come from one of three business regions (Americas,
EMEA, and APAC) are served by application instances in the closest
Google Cloud region.
The following topology shows the top-level hierarchy for the deployment:
Network latency
In this scenario, assume that you have a GKE cluster named online-boutique. You check the latency between external clients and the GKE cluster to see if the latency between them has changed. You discover that it has changed and decide to further investigate the cluster's nodes.
You filter the topology to show only the traffic for your cluster
online-boutique.In the Filter section, you can add a filter to select nodes and its peers. This section is available only for metric views and not for the insights views. Click Add filter and select the type of node and the node.
After you apply the filter, Network Topology shows only the connections related to the cluster, as shown in the following example.
Starting with the external clients in Americas, you click the traffic metrics between the Americas business region and the GKE cluster. Network Topology shows charts in the details pane. The information includes ingress and egress traffic between your selected entity and the connected entity. For example, Network Topology provides the latest values for queries per second (QPS) and the HTTP request latency. In the request latency chart, you see values for the 50th, 95th, and 99th percentiles. In this example, assume that all of the latency values are higher than you expected.
To expand the time series charts to 6 weeks, at the top of the details pane, you select 6 weeks.
You see a significant jump that happened about two hours ago, roughly when the first issues were reported. You're confident that the issue is related to increased latency with a GKE Pod.
Having a high-level view of the issue, you investigate the GKE nodes further. For more information about troubleshooting GKE nodes, see Troubleshooting GKE connectivity issues.
What's next
- Monitor your networking configuration with Network Topology
- Use case: Audit network performance
- Troubleshoot Network Topology
- Cloud Interconnect quotas and limits
- Cloud VPN quotas and limits