This document describes how to group and view log entries in a "parent-child"
format using the Logs Explorer. Usually when you write log entries to
Cloud Logging, each log entry appears separately and uncorrelated. However,
you can group, or correlate your log entries by using the trace field in the
LogEntry object.
When you correlate log entries, you can view a parent log entry with multiple child log entries in the Logs Explorer.
Set up correlated log entries
To set up correlated log entries, you can manually populate the trace field,
or you can instrument your application to submit traces to Cloud Trace by
using Google client libraries. The following configurations automatically
capture your trace data:
App Engine standard environment
Cloud Run functions and Cloud Run
For information on instrumenting your application to collect trace data, see Overview to instrumenting for Cloud Trace.
For Logs Explorer to correlate a collection of log entries, the log entries must meet the following requirements:
The
tracefield in theLogEntryobject is set to a string with the following format:projects/PROJECT_ID/traces/TRACE_IDwhere PROJECT_ID is your Google Cloud project project ID and TRACE_ID is the trace identifier.
The
tracefields in the log entries are the same.Each log entry belongs to a unique log. That is, the value of the
logNamefields must be different.
View correlated log entries in the Logs Explorer
To view the child log entries correlated with a parent log entry that you are viewing in the Logs Explorer, expand the log entry.
For example, to display your App Engine request log entry and application log entries, do the following:
-
In the Google Cloud console, go to the Logs Explorer page:
If you use the search bar to find this page, then select the result whose subheading is Logging.
In the Resource drop-down menu, select GAE Application.
In the Log Name drop-down menu, select
request_log.In the Query results pane, to expand a log entry, click chevron_right Expand.
Application log entries correlated to the request log entry are nested in the request log entry:
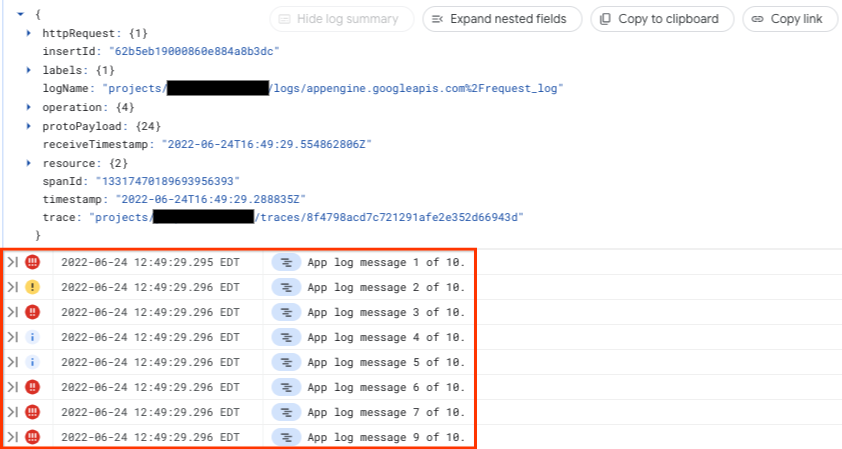
In the previous screenshot, the parent log entry has 10 child log entries. You can expand these child log entries to view their details.
Search correlated log entries
Correlated search lets you search both parent and child log entries with a query. The result of the search is a list of parent log entries that match the query in either the parent or child log entries. For example, to search for the string "app log message" in both the child and parent log entries, do the following:
-
In the Google Cloud console, go to the Logs Explorer page:
If you use the search bar to find this page, then select the result whose subheading is Logging.
Enter
"app log message" in the search field, and click Run query. Child log entries containing "app log message" are listed in the Query results pane.In the Query results pane, click Correlate by and select a parent log. To view App Engine request logs, select
request_log, and click Apply.In the Query results pane, all parent log entries that contain the string
"app log message"or that have a child that contain the string are listed.To view nested child log entries, tp expand the parent log entry, click chevron_right Expand.
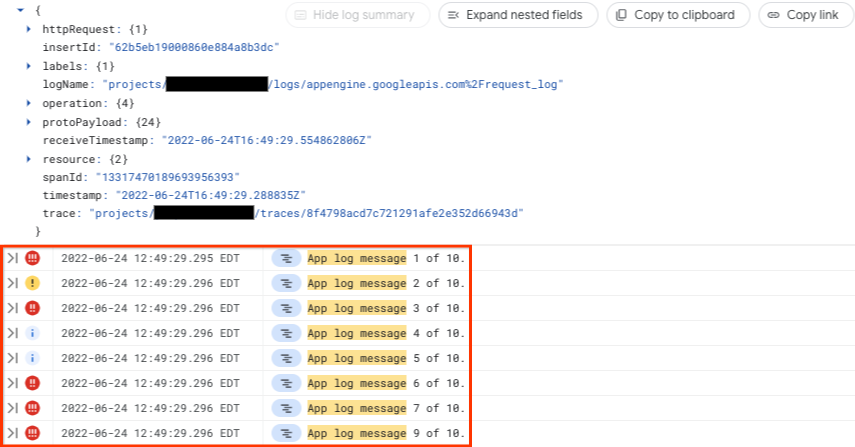
In the previous screenshot, the parent log entry has 10 child log entries that contain the string "app log message". You can expand these child log entries to view their details.
If you selected a parent log and see no log entries in the Query results pane, then there are no correlated parent and child entries that match your query.
What's next
For information about instrumenting your application for Cloud Trace, see Overview to instrumenting for Cloud Trace.
For information about App Engine request logs and application logs, see Reading and writing application logs.