本文档介绍了如何使用 Log Analytics 估算日志条目的计费量。您可以编写查询,按不同的维度(例如资源类型或应用名称)报告和汇总您的计费量,然后绘制图表并查看查询结果。
如何查询计费量
日志条目的计费量(即向 Cloud Billing 报告的大小)可通过 storage_bytes 字段获取。在查询中,您可以像使用数据类型为 INTEGER 的任何架构字段一样使用 storage_bytes 字段。例如,您可以在 SELECT 子句、CASE 语句和常见的表表达式中包含该字段。如需详细了解如何查询日志,请参阅以下文档:
由于 Cloud Billing 在确定费用时会使用计费量,因此您可以编写查询,以便了解费用的来源。例如,您可以编写查询,以帮助您确定哪些应用正在写入最多的日志条目。如需了解如何将计费量与费用相关联,请参阅 Google Cloud Observability 价格页面的 Cloud Logging 部分。
日志条目的计费量不是发送到 Cloud Logging API 的 LogEntry 对象的大小。计费量包括序列化和元数据所需的字节数。
准备工作
本部分介绍了在使用 Log Analytics 之前必须完成的步骤。
配置日志存储桶
确保您的日志存储桶已升级为使用 Log Analytics:
-
在 Google Cloud 控制台中,前往日志存储页面:
如果您使用搜索栏查找此页面,请选择子标题为 Logging 的结果。
- 对于包含您要查询的日志视图的每个日志存储桶,请确保 Log Analytics 可用列显示打开。如果显示升级,请点击升级并完成对话框。
配置 IAM 角色和权限
本部分介绍了使用 Log Analytics 所需的 IAM 角色或权限:
-
如需获得使用 Log Analytics 和查询日志视图所需的权限,请让您的管理员为您授予项目的以下 IAM 角色:
-
查询
_Required和_Default日志存储桶:Logs Viewer (roles/logging.viewer) -
查询项目中的所有日志视图:Logs View Accessor (
roles/logging.viewAccessor)
您可以通过以下方式限制主账号只能查看特定日志视图:向项目级别授予的 Logs View Accessor 角色添加 IAM 条件,或者向日志视图的政策文件添加 IAM 绑定。如需了解详情,请参阅控制对日志视图的访问权限。
这些权限与您在 Logs Explorer 页面上查看日志条目时需要的权限相同。如需了解您需要哪些额外角色才能查询用户定义的存储桶的视图,或者查询
_Default日志存储桶的_AllLogs视图,请参阅 Cloud Logging 角色。 -
查询
-
如需获得查询分析视图所需的权限,请让您的管理员为您授予项目的 Observability Analytics User (
roles/observability.analyticsUser) IAM 角色。
查询示例
本部分提供了用于分析单个日志视图中的数据的示例查询。如果您将数据存储在多个日志视图中,并且想要计算这些视图中存储的数据的汇总值,则需要使用 UNION 语句。
您可以使用 Log Analytics 页面或任何可以查询 BigQuery 数据集的位置(包括 BigQuery Studio 和 Looker Studio 页面以及 bq 命令行工具)来查询日志条目。
如需使用示例查询,请执行以下操作:
Log Analytics 页面:将 VIEW 替换为日志视图的名称。格式为
project_ID.region.bucket_ID.view_ID。BigQuery 数据集:将 VIEW 替换为关联数据集中的表路径。
按应用查询日志量
如需计算针对 Google Kubernetes Engine 资源写入且具有 JSON 载荷的日志条目的每应用每日总字节数,请使用以下查询:
SELECT
  timestamp_trunc(timestamp,DAY) as day,
  JSON_VALUE(labels["k8s-pod/app"]) as app_id,
  SUM(storage_bytes) as total_bytes
FROM
  `VIEW`
WHERE
  json_payload IS NOT NULL
  AND resource.type="k8s_container"
GROUP BY ALL
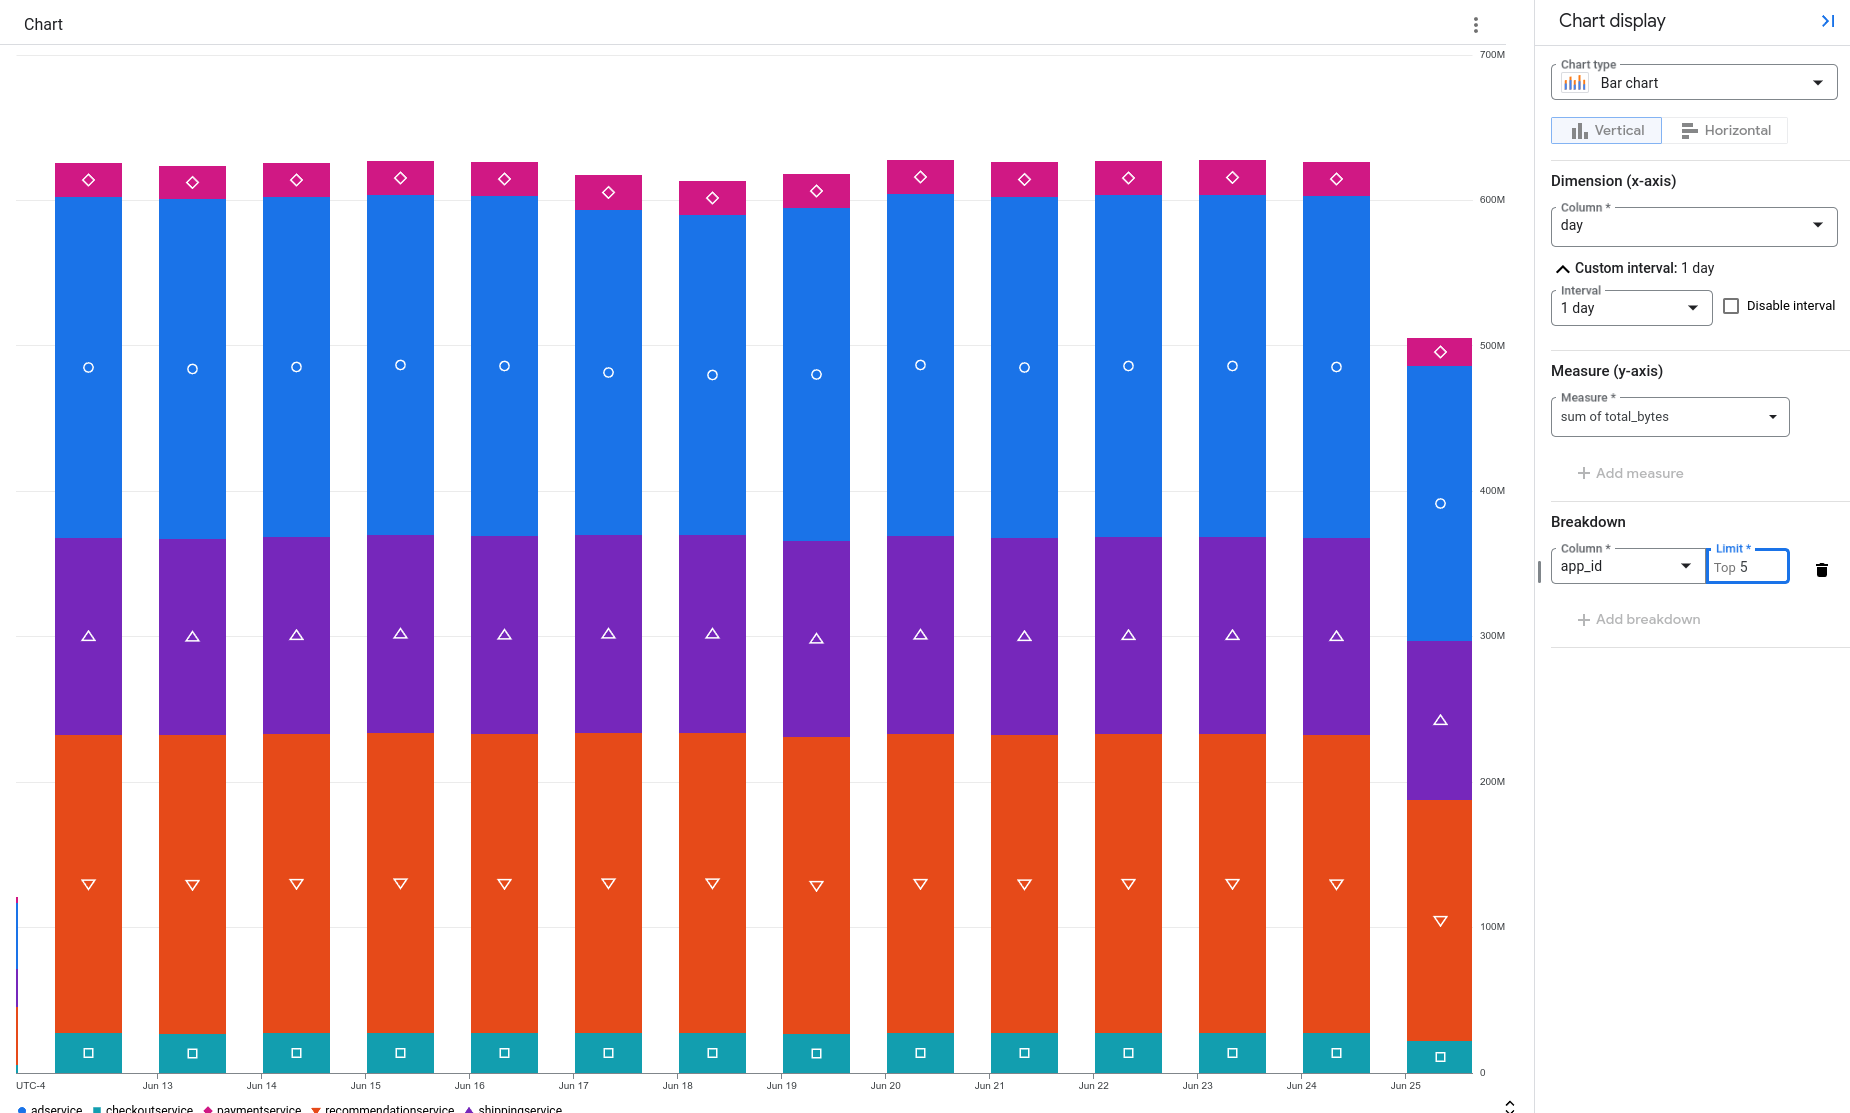
如需直观呈现数据,您可以创建图表。
在以下示例中,数据以堆叠条形图的形式显示。图表上的每个条形都显示了按应用整理的存储总字节数。在此示例中,frontend 应用生成的日志数据最多:
按日志名称查询日志量
如需列出针对 Google Kubernetes Engine 资源写入且具有 JSON 载荷的每个日志条目的存储字节数和日志名称,请使用以下查询:
SELECT
  log_id AS log_name,
  storage_bytes
FROM
  `VIEW`
WHERE
  json_payload IS NOT NULL
  AND resource.type="k8s_container"
上一个查询不会汇总结果,而是为每个日志条目生成一行,该行包含日志名称和存储的字节数。如果您将此数据绘制成图表,则可以直观呈现写入不同日志的日志数据部分:
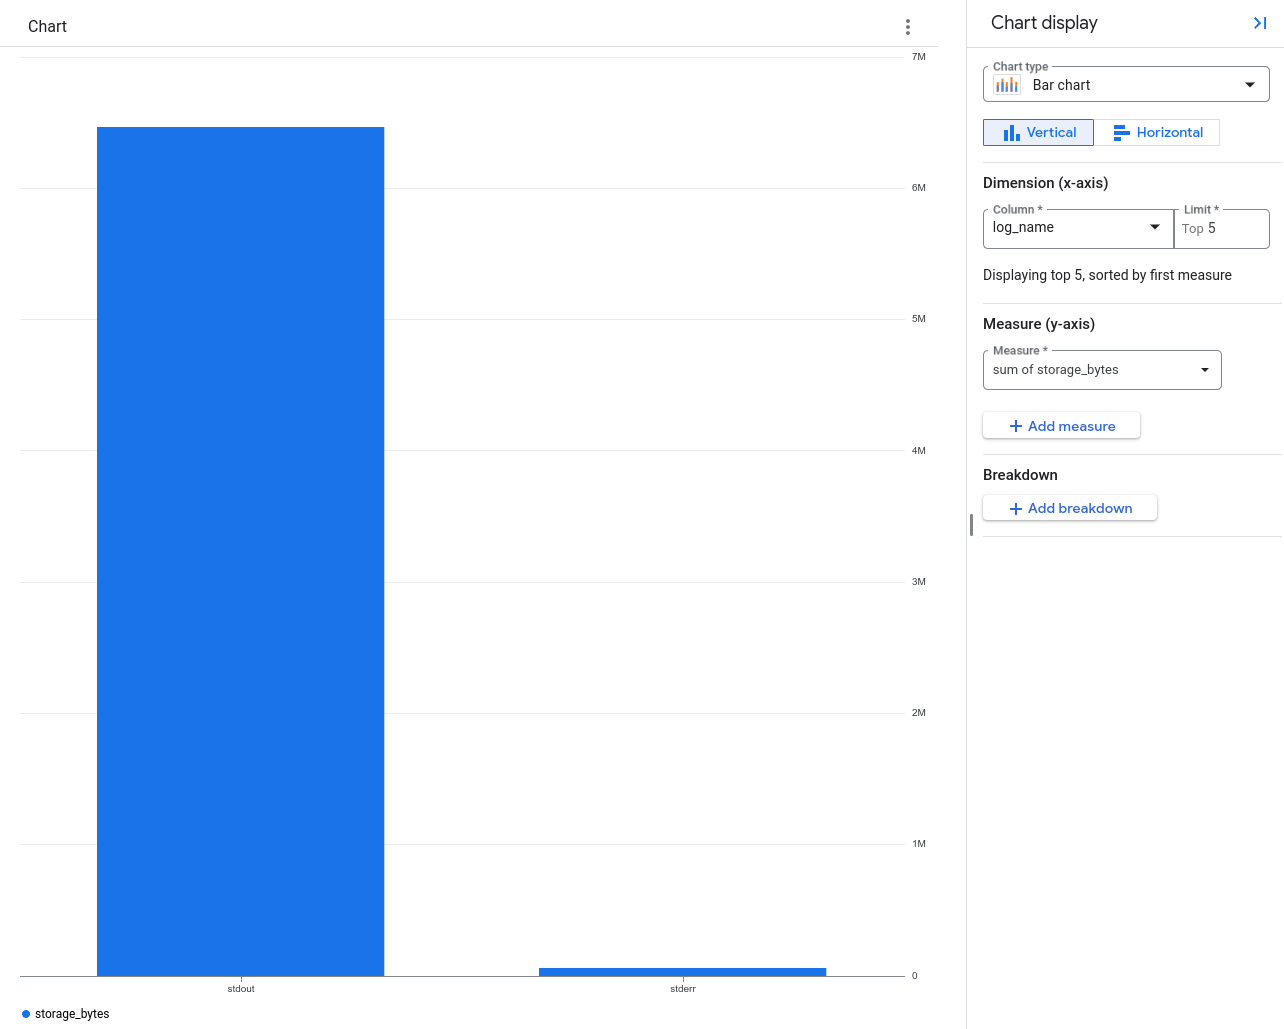
上图显示,大多数日志数据都写入了名为 stdout 的日志。
使用 bq 命令行工具按日志名称查询日志量
您可以在通过 BigQuery Studio 页面或使用 bq 命令行工具运行的查询中添加 storage_bytes 字段。
以下查询会报告每个日志条目的日志名称和存储的字节数:
bq query --use_legacy_sql=false  'SELECT log_id as log_name,
  storage_bytes FROM `VIEW`'
此查询的结果类似于以下内容:
+----------+---------------+
| log_name | storage_bytes |
+----------+---------------+
| stdout   |           716 |
| stdout   |           699 |
| stdout   |           917 |
| stdout   |           704 |
每一行都对应一个日志条目。storage_bytes 列的值是该日志条目的计费量。
限制
仅当满足以下条件时,storage_bytes 字段才可用:
- 日志存储桶已升级为使用 Log Analytics。
您的查询会在 Log Analytics 页面或您可以查询 BigQuery 数据集的任何位置执行,包括 BigQuery Studio 和 Looker Studio 页面,以及 bq 命令行工具。
日志条目是在 2024 年 1 月 1 日当天或之后写入的。