Understand performance monitoring in Firestore
Cloud Monitoring collects metrics, events, and metadata from Google Cloud products. The data that is reported on the Usage dashboard and Security rule usage can also be accessed through Cloud Monitoring for more detailed analysis. With Cloud Monitoring, you can also set up custom dashboards and usage alerts.
This document guides you through using metrics, learning about custom metrics dashboard, and setting alerts.
Monitored Resources
A monitored resource in Cloud Monitoring represents a logical or physical entity, such as a virtual machine, a database, or an application. Monitored resources contain a unique set of metrics that can be explored, reported through a dashboard, or used to create alerts. Each resource also has a set of resource labels, which are key-value pairs that hold additional information about the resource. Resource labels are available for all metrics associated with the resource.
Using the Cloud Monitoring API, Firestore performance is monitored with the following resources:
| Resources | Description | Supported database mode |
firestore.googleapis.com/Database (recommended) | Monitored
resource type that provides breakdowns for project,
location* , and database_id . The
database_id label will be (default) for databases created
without a specific name. |
Applies to both modes. |
firestore_instance | Monitored resource type for Firestore projects and does not provide breakdown for databases. | Applies to Firestore Native |
datastore_request | Monitored resource type for Datastore projects and does not provide breakdown for databases. | Applies to both modes. |
Metrics
Firestore is available in two different modes, Firestore Native and Firestore in Datastore mode. For a feature comparison between these two modes, see Choose between database modes.
For a complete list of metrics for both modes, see the following links:
Service runtime metrics
The serviceruntime
metrics provide a high-level overview of a project's traffic. These metrics are
available for most Google Cloud APIs. The
consumed_api
monitored resource type contains these common metrics. These metrics are sampled
every 30 minutes resulting in data being smoothed out.
An important resource label for the serviceruntime metrics is method. This label
represents the underlying RPC method called. The SDK method that you call may
not necessarily be named the same as the underlying RPC method. The reason is
that the SDK provides high-level API abstraction. However, when trying to
understand how your application interacts with Firestore, it is
important to understand the metrics based on the name of the RPC method.
If you need to know what the underlying RPC method is for a given SDK method, see the API documentation.
Use the following service runtime metrics to monitor your database.
api/request_count
This metric provides the count of completed requests, across protocol(request protocol, such as http, gRPC, etc.),
response code (HTTP response code), response_code_class (response code class, such as 2xx, 4xx,etc.), and grpc_status_code (numeric gRPC response code). Use this metric to
observe the overall API request and calculate the error rate.
In figure 1, requests that return a 2xx code grouped by service and method can be seen. 2xx codes are HTTP status codes that indicate the request was successful.
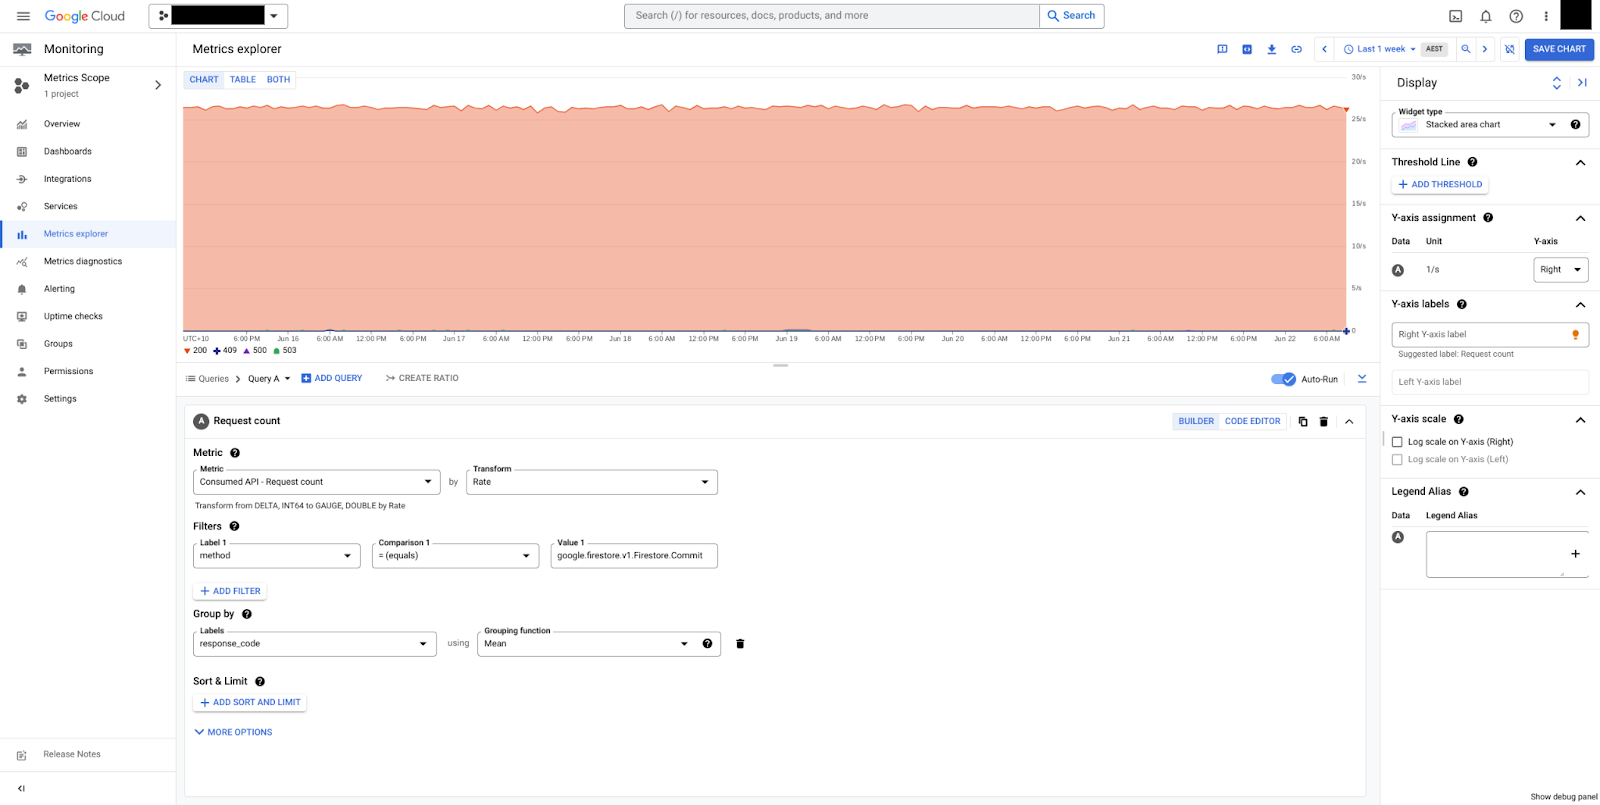
In figure 2, commits grouped by response_code can be seen. In this example, we only see HTTP 200 responses which implies that the database is healthy.
api/request_latencies
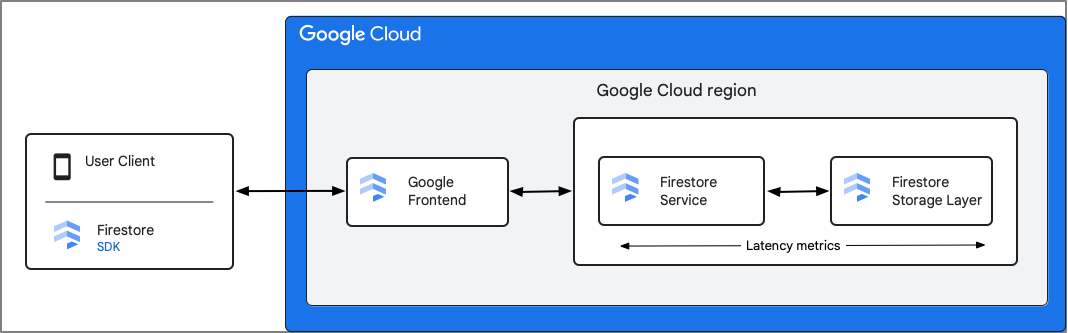
The api/request_latencies metric provides latency distributions across all completed requests.
Firestore records metrics from the Firestore Service component. Latency metrics include the time that Firestore receives the request to the time that Firestore finishes sending the response, including interactions with the storage layer. Due to this, round-trip latency (rtt) between the client and the Firestore service is not included in these metrics.
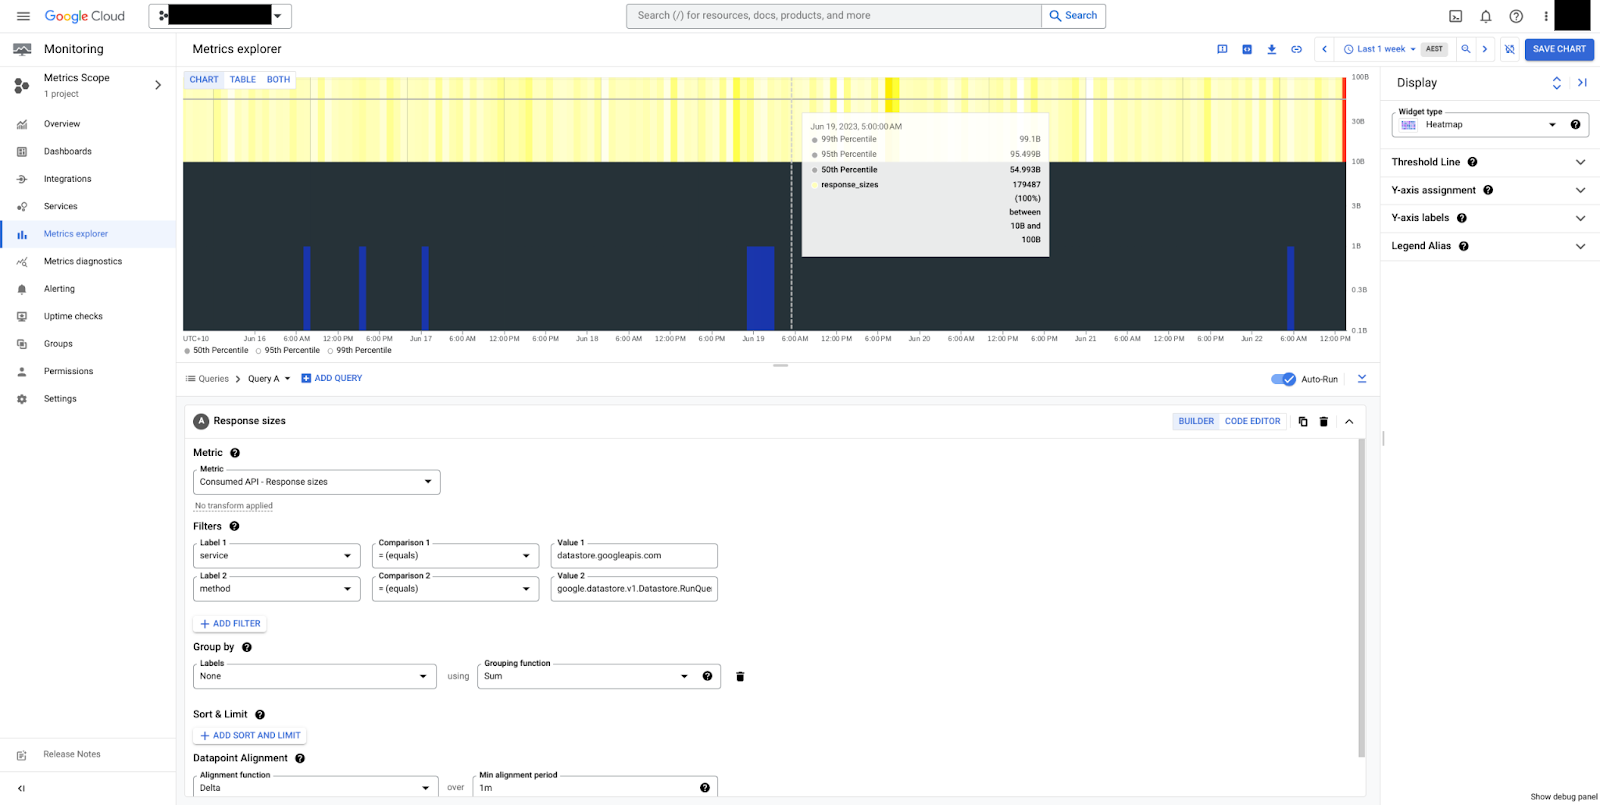
api/request_sizes and api/response_sizes
The api/request_sizes and api/response_sizes metrics respectively provide
insights into payload sizes (in bytes). These can be useful for understanding
write workloads that send large amounts of data or queries that are too broad,
and return large payloads.
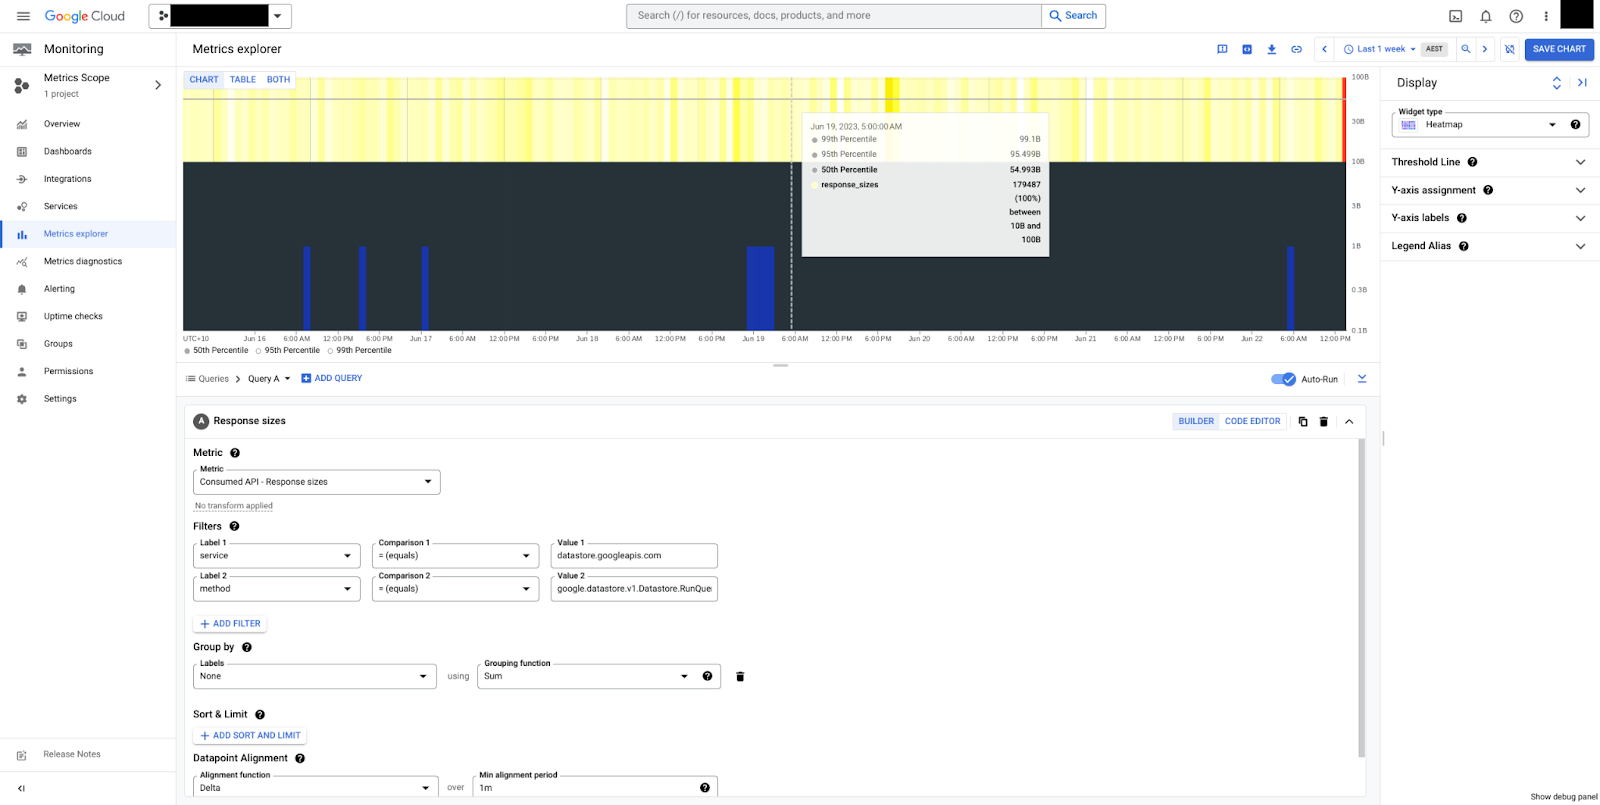
In figure 5, a heatmap for response sizes for the RunQuery method can be seen.
We can see that sizes are steady, 50 bytes median, and overall between 10 bytes
and 100 bytes. Note that payload sizes are always measured in uncompressed
bytes, exclusive of transmission control overheads.
Document operation metrics
Firestore provides read, write, and delete counts. The write metric provides a breakdown between the 'CREATE' and 'UPDATE' operation. These metrics are aligned with CRUD operations.
The following metrics can be used to understand whether your database is read heavy or write heavy, and the rate of new documents vs. deleted documents.
document/delete_ops_count: The number of successful document deletes.document/read_ops_count: The number of successful document reads from queries or lookups.document/write_ops_count: The number of successful document writes.
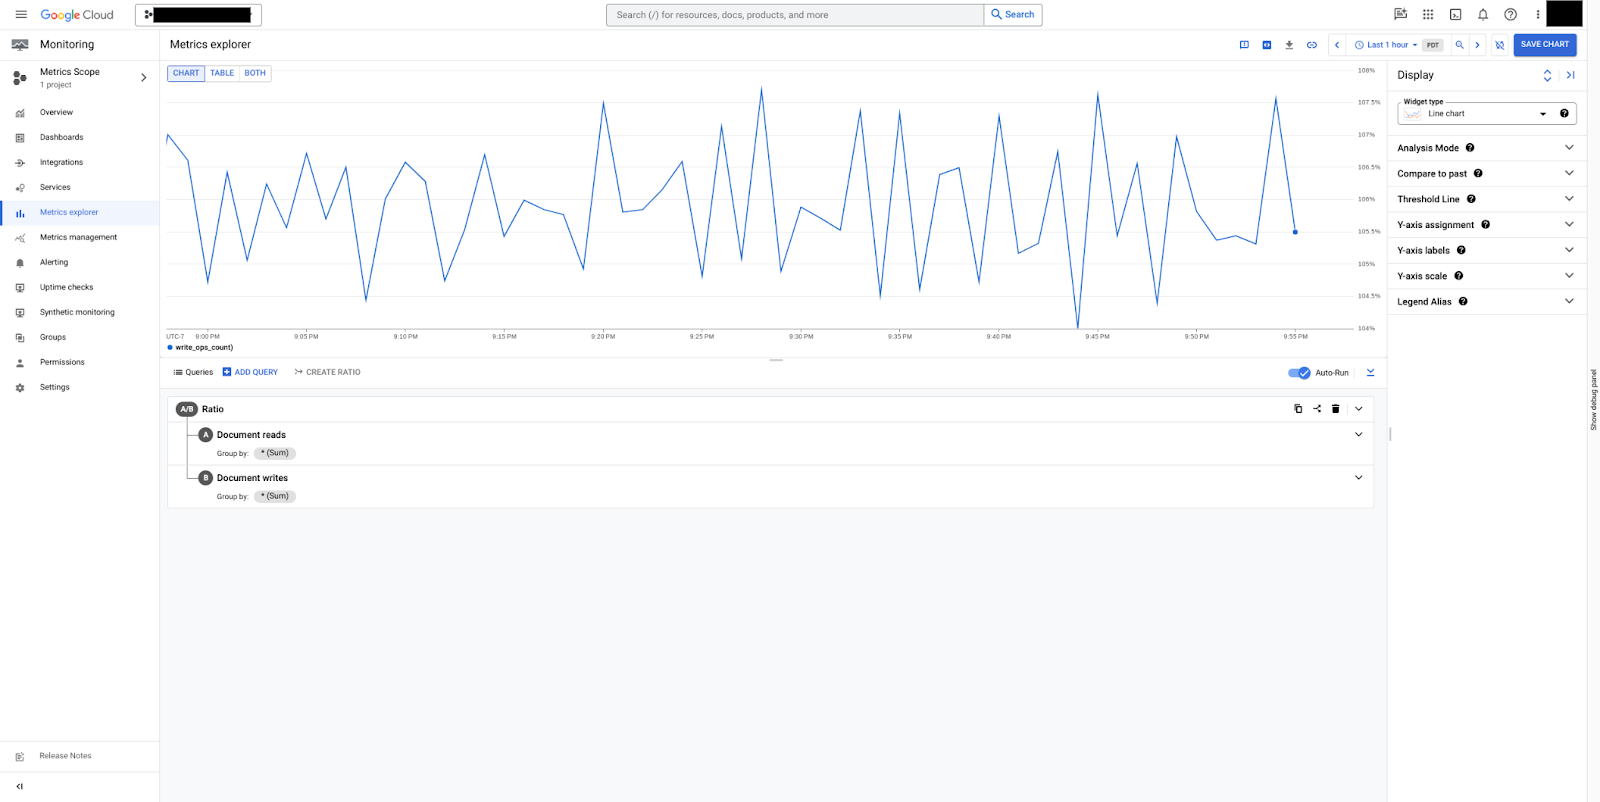
In figure 6, you can see how to create a ratio that shows the ratio of documents read vs. documents written. In this example, the number of documents being read is around 6% more than the number of documents being written.
Document operation metrics
These metrics provide distributions in bytes of payload sizes for reads (lookups
and queries) and writes to a Firestore database. The values represent
the total size of the payload. For example, any results returned by a query.
These metrics are similar to the api/request_sizes and api/response_sizes metrics
with the main difference being the document operation metrics provide more
granular sampling, but less granular breakdowns.
For example, the document operation metrics use the datastore_request monitored
resource so there is no service or method breakdown.
entity/read_sizes: Distribution of sizes of read documents.entity/write_sizes: Distribution of sizes of written documents.
Index metrics
Index write rates can be contrasted with the document/write_ops_count metric
to understand the index fanout
ratio.
index/write_count: Count of index writes.
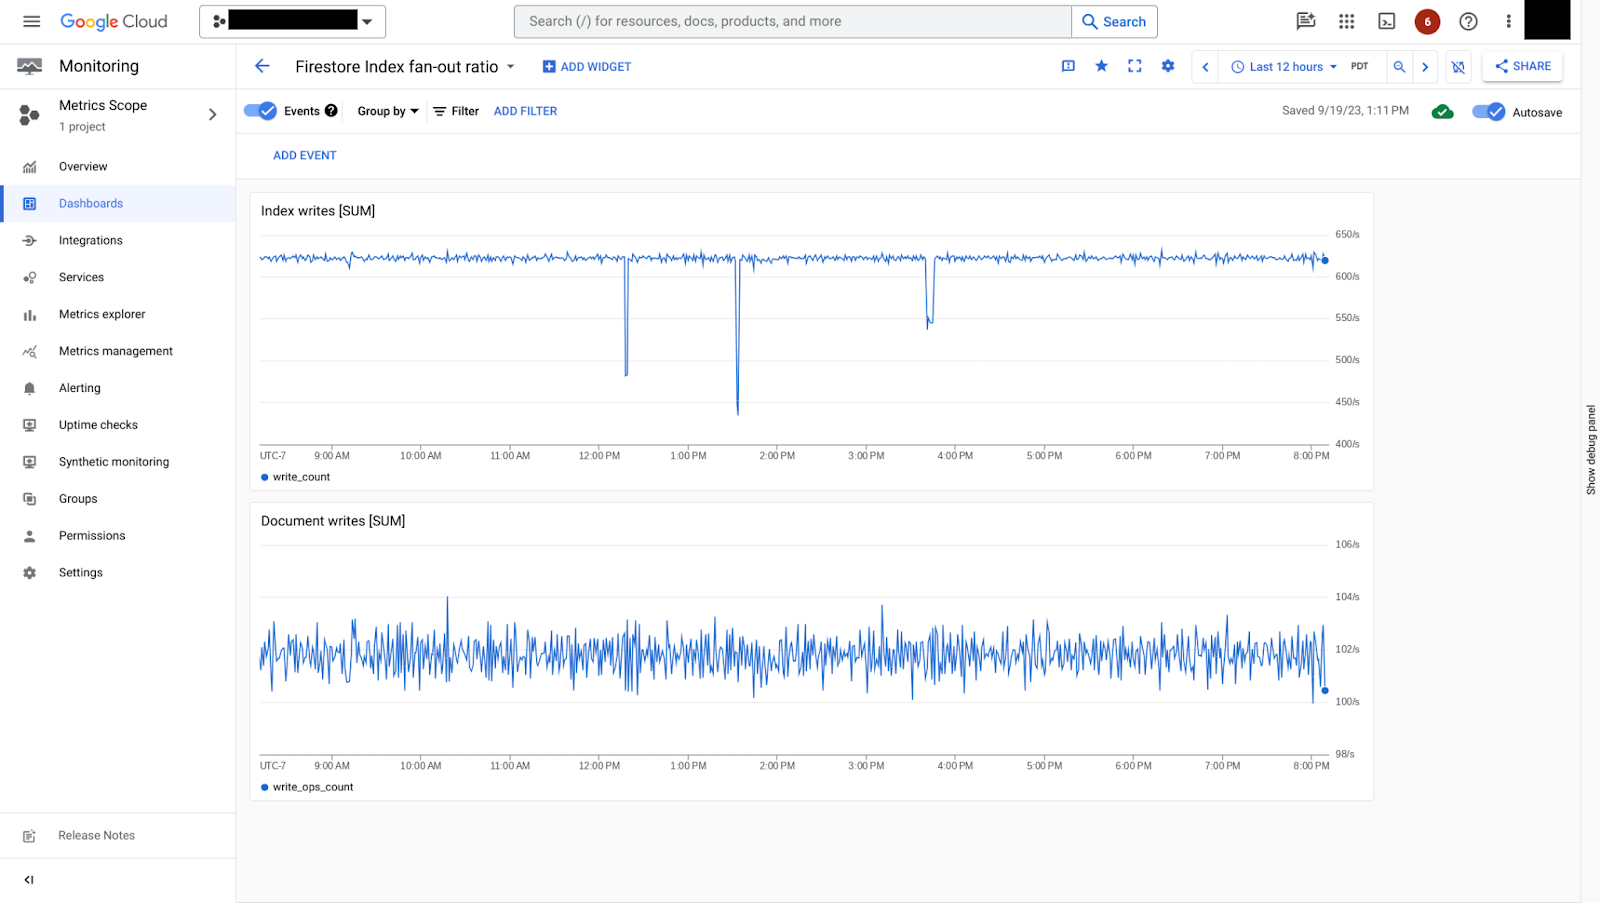
In figure 7, you can see how index write rate can be contrasted with document write rate. In this example, for every document write, there are approximately 6 index writes, which is a relatively small index fanout rate.
Clients connected directly to the database using Firebase SDKs
Two gauge metrics are available to track activity from clients connected directly to Firestore databases through either Mobile SDKs, Web SDKs, or both. These metrics include a functionality related to real time snapshot listeners where relevant changes in the database are immediately streamed back to clients.
network/active_connections: The number of active connections at the point in time. Each web or mobile client has one connection.network/snapshot_listeners: The number of snapshot listeners currently registered across all connected clients. There may be multiple connections per-client.
You can view these metrics in the Usage tab within the Firestore database in the Firebase console.

TTL Metrics
The TTL metrics are available for both Firestore Native and Firestore in Datastore mode databases. Use these metrics to monitor the effect of the TTL policy enforced.
document/ttl_deletion_count: Total count of documents deleted by TTL services.

In figure 9, you can see the rate of documents deleted every minute over a period of days.
document/ttl_expiration_to_deletion_delays: Time elapsed between when a document with a TTL expired, and when it was actually deleted.
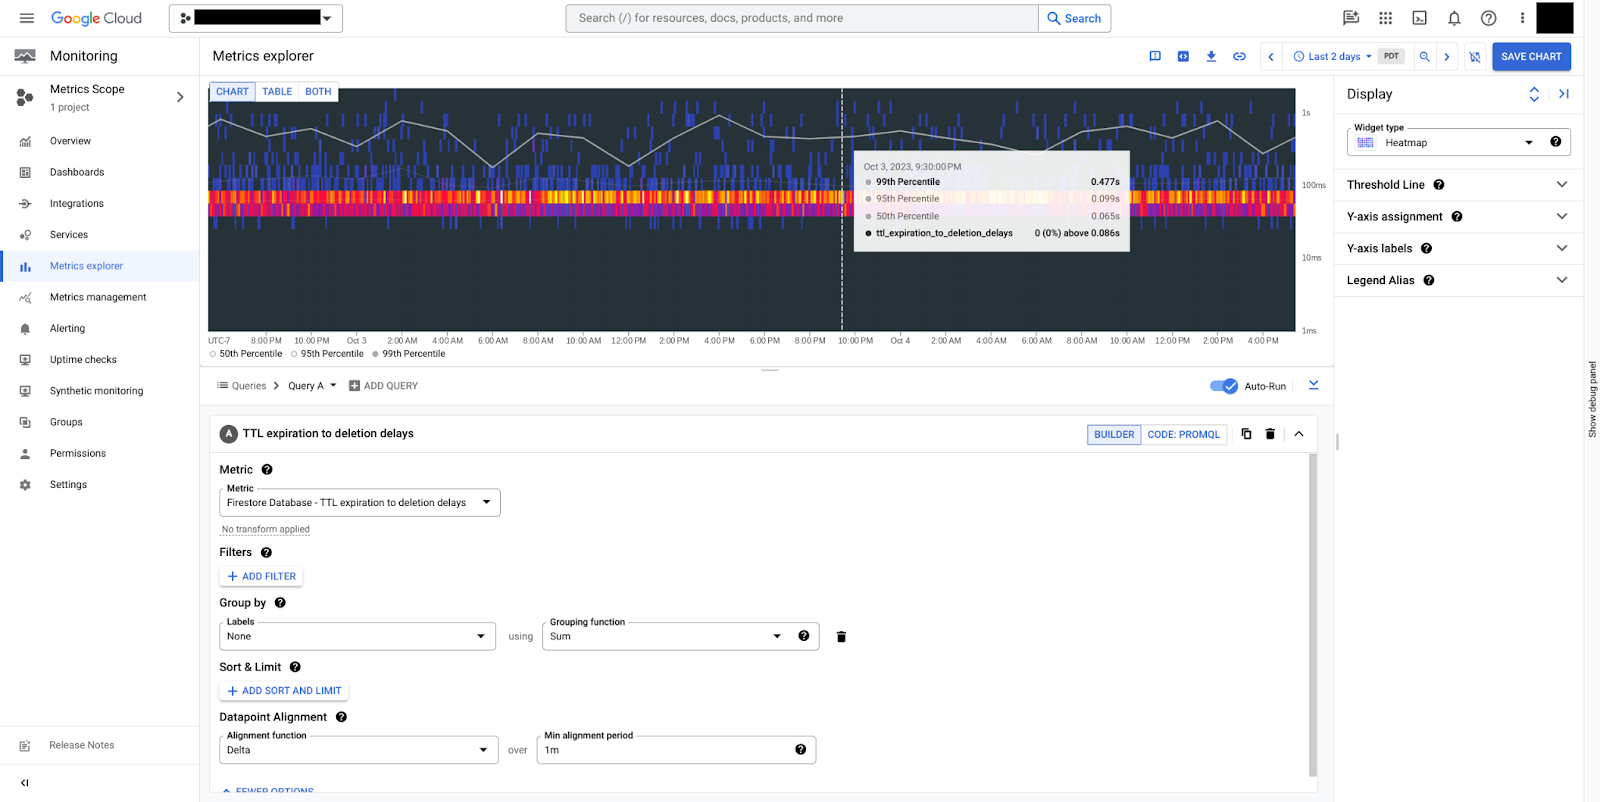
In figure 10, you can see that this metric provides a distribution of the time in seconds that it took for Firestore to delete documents with TTL policies. It takes less than 0.5 seconds to delete TTL-expired documents at the 99th percentile. This implies the system is functioning normally. Firestore typically deletes expired documents within 24 hours, but this is not guaranteed. If you see it taking longer than 24 hours, contact support.
What' next
- Learn about using the Cloud Monitoring dashboard to view metrics.
- Monitor usage to identify document reads, writes, and deletes over time.