Monitor usage
This page describes how you can monitor your Firestore usage and spot potential problems in your app.
Usage dashboard
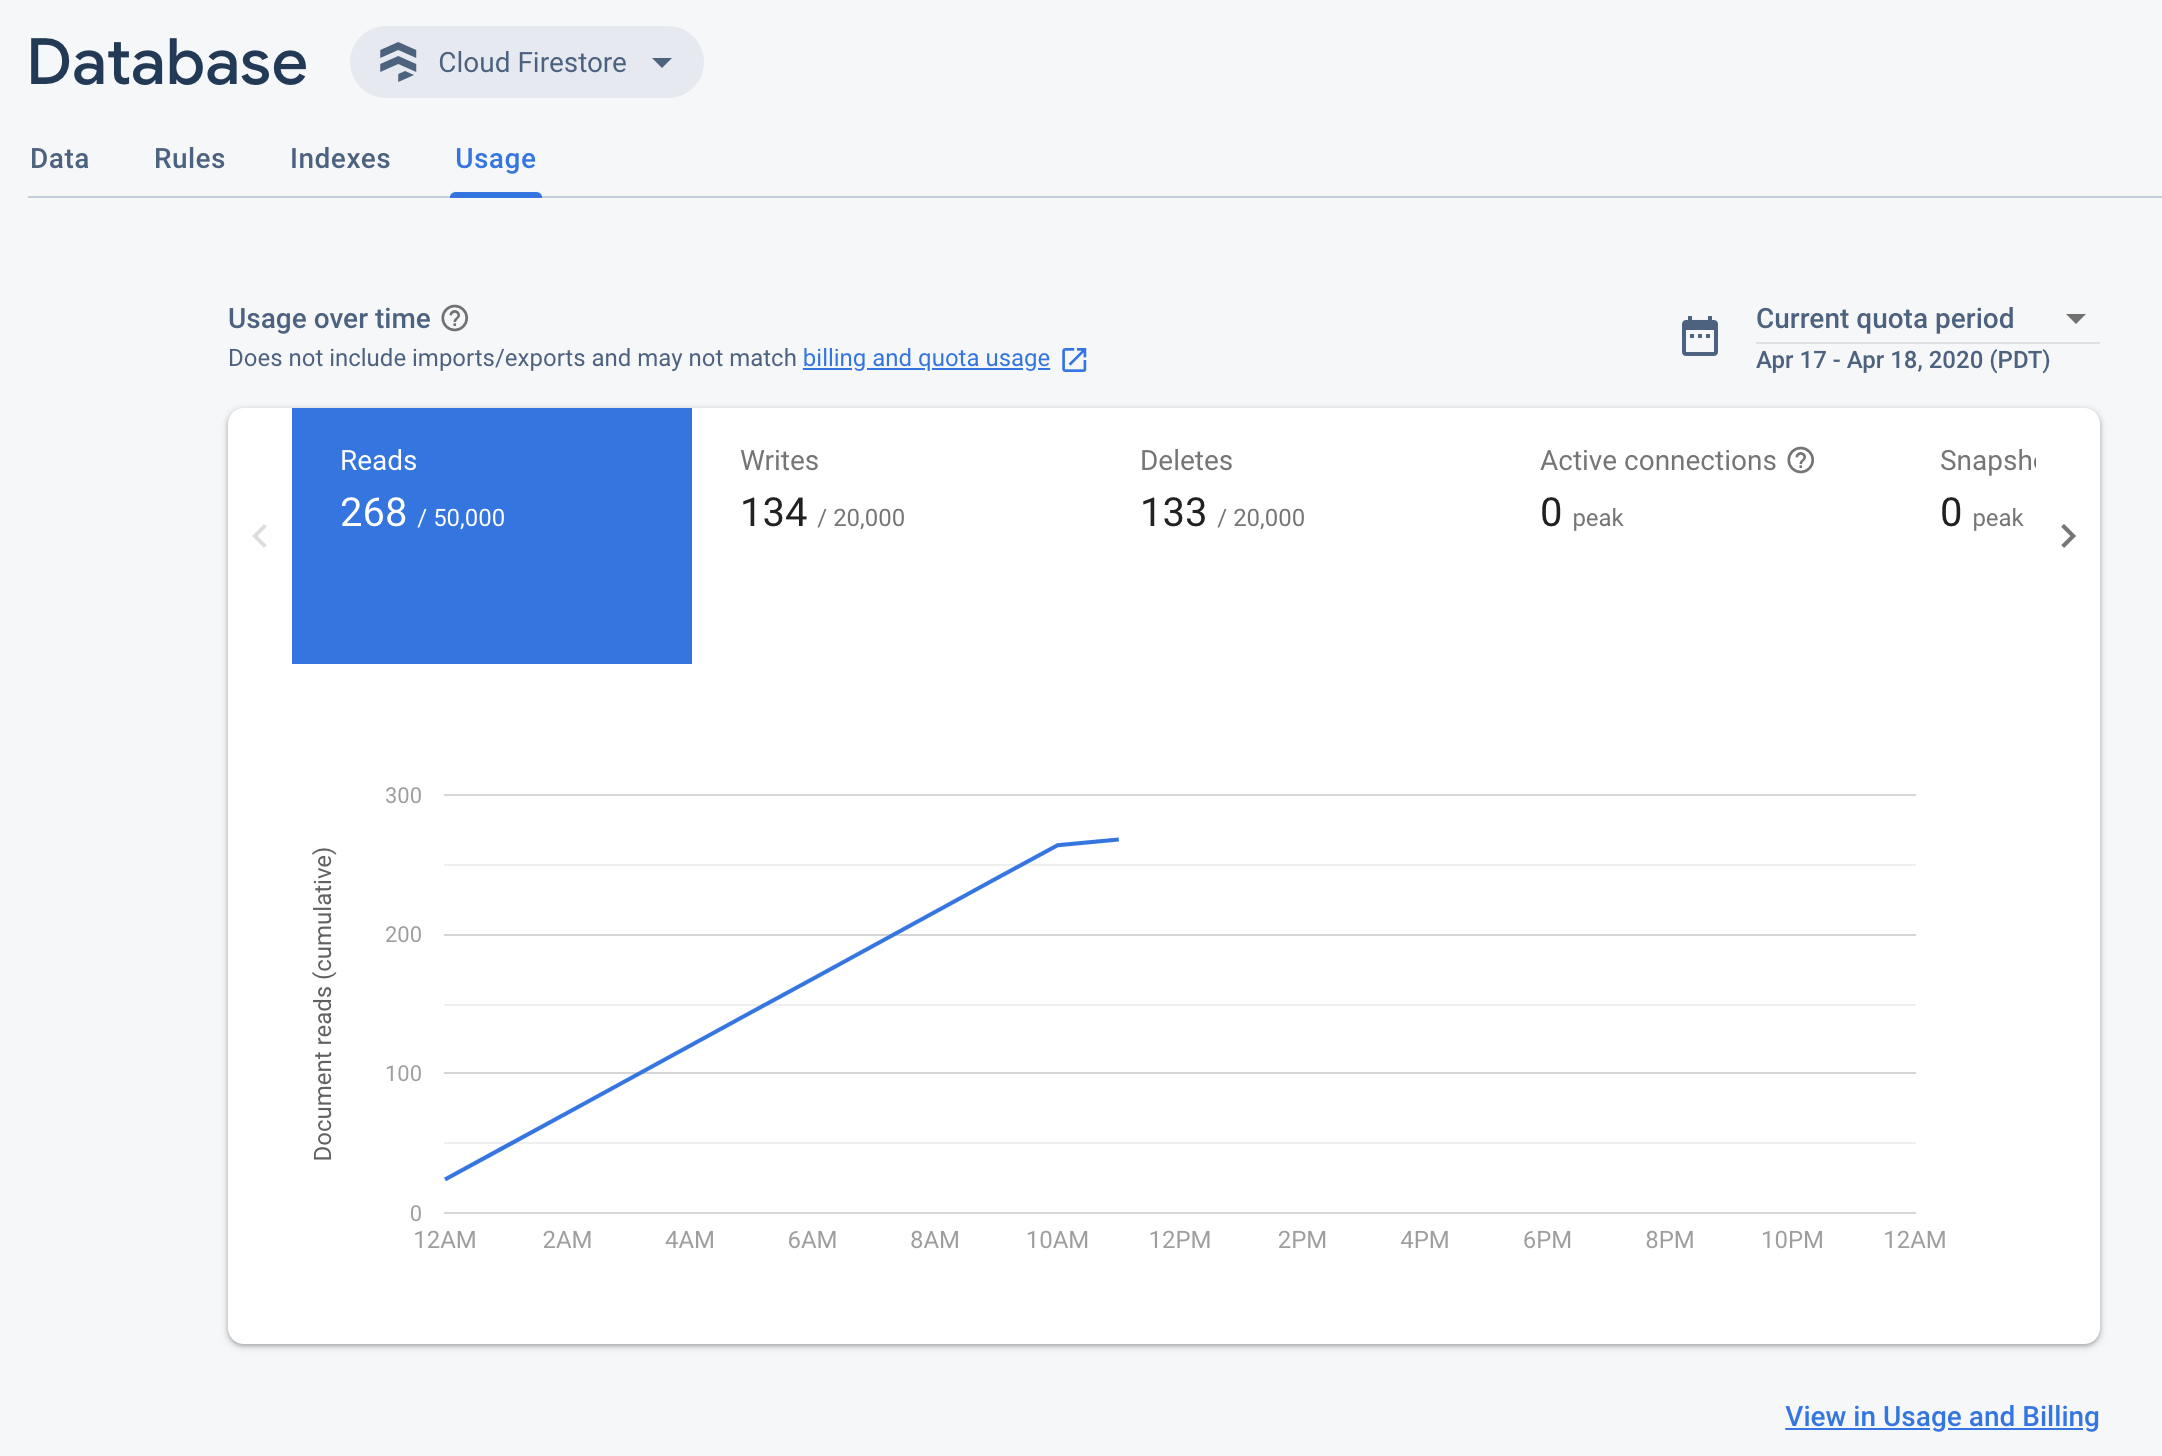
Use the usage dashboards in the Google Cloud console and Firebase console to view document reads, writes, and deletes over time.
Access control
The usage dashboards require the monitoring.timeSeries.list IAM permission.
The Project Owner, Editor, and Viewer roles grant this permission. You can also grant this permission
through a Cloud Monitoring role
or a custom role.
Database usage dashboard
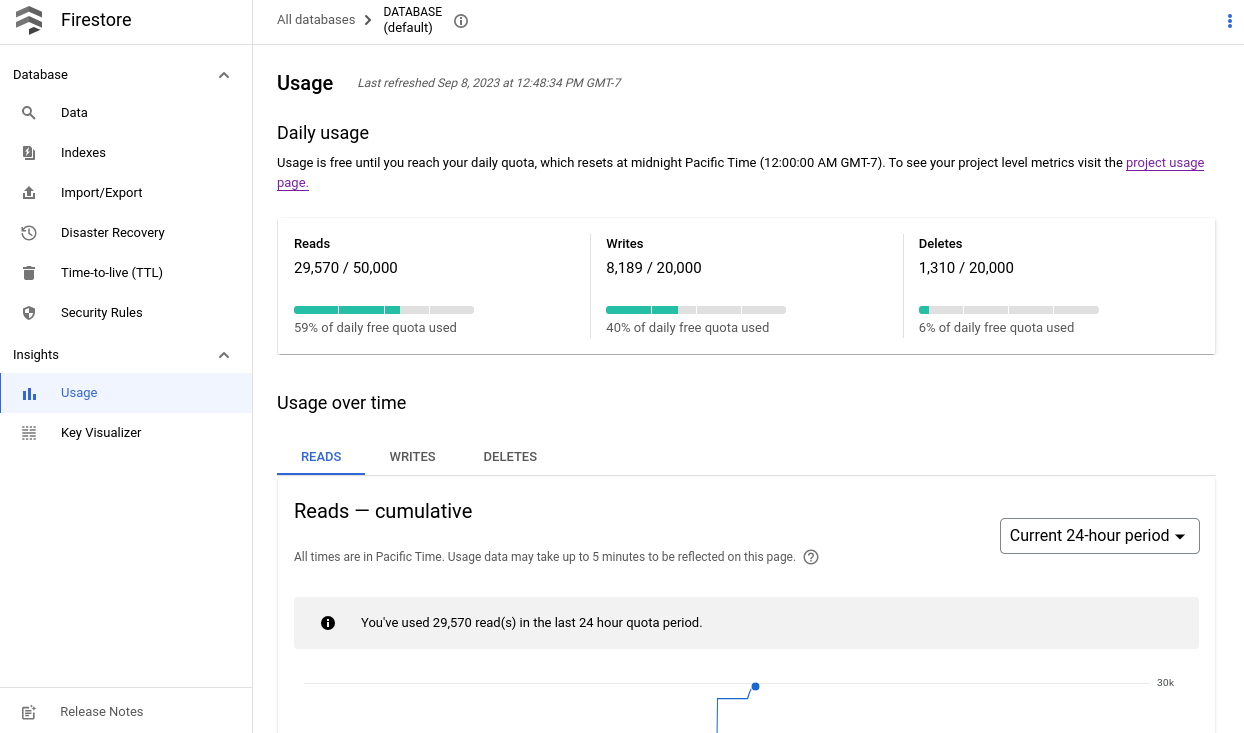
To view usage metrics for a Firestore database, open the database Usage page in the Google Cloud console.
In the Google Cloud console, go to the Databases page.
Select the required database from the list of databases.
In the navigation menu, click Usage.
Click the link in the message that appears on the page to view your database usage.
Aggregated usage dashboard
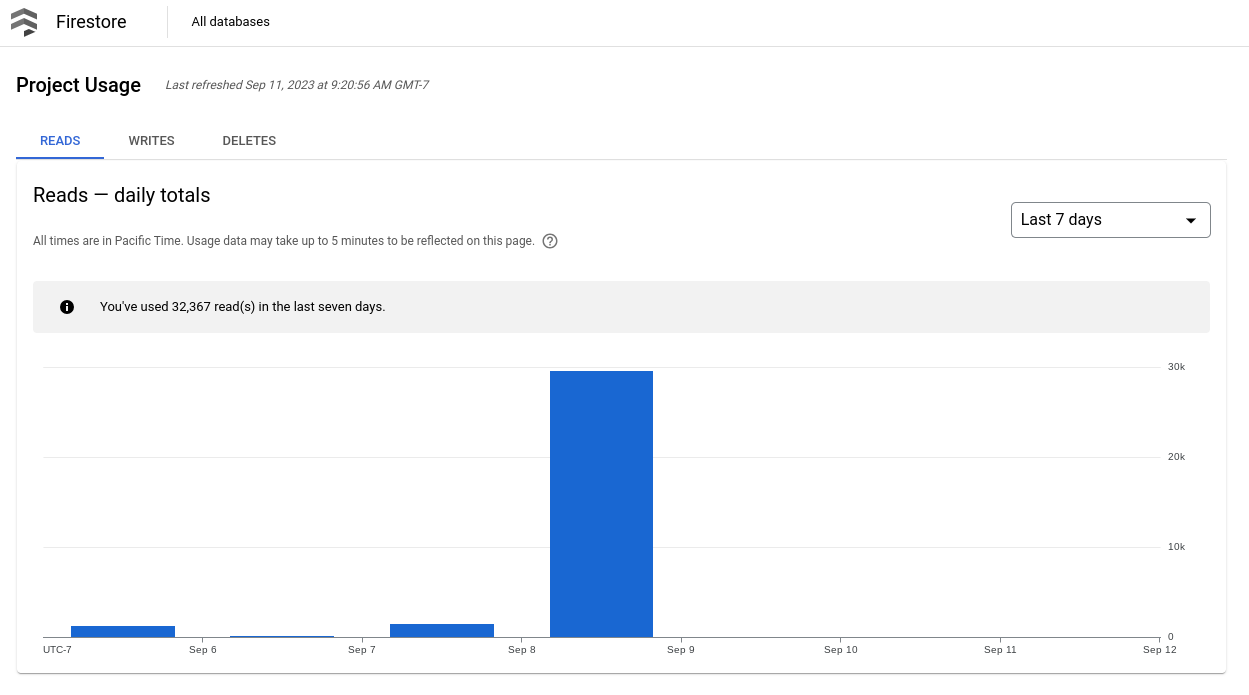
If your project has multiple Firestore databases, you can view aggregated usage metrics in the Google Cloud console or Firebase console.
Google Cloud console
In the Google Cloud console, go to the Project usage page.
Go to Google Cloud project project usage
The project usage dashboard shows document operations over time as follows:
Firebase console
Go to the Firestore usage page (Firebase console)
Usage dashboard and billing reports
The Firestore usage dashboards in the Firebase and Cloud consoles provide an estimate of usage. They can help you identify spikes in usage. However, the dashboard is not an exact view of billed operations. Billed usage is likely higher. In all cases of discrepancy, the billing report takes precedence over the usage dashboard.
Operations that cause discrepancies between the usage dashboard and billed usage include:
- Import and export operations. Reads and writes performed by these operations do not show up in the usage dashboard.
- No-op verify-only writes. Writes that only verify the existence or non-existence of a document contribute to billed read operations, but they show as `UPDATE_NOOP` and `DELETE_NOOP` respectively in the write usage dashboard.
- No-op writes. Operations that do not result in a change to the database, such as an update that does not change field values or a write to a deleted document may show in the usage dashboard as `UPDATE_NOOP` or `DELETE_NOOP`. Even though they show as `NOOP`, they still contribute to billed operations.
Collapsed writes. In cases with multiple writes to the same document in quick succession, the usage dashboard might collapse multiple writes together and count them as one. When billing usage, each write is still counted separately.
The usage dashboard also collapses writes for field transforms like server timestamps, numeric increments, and array union operations. For field transforms, the usage dashboard might count multiple operations as a single operation.
- Queries that return zero results. Queries with zero results incur a cost of one read operation. This usage is billed but does not appear in the usage dashboard.
- Read operations from index entries read. This usage is billed but does not appear in the usage dashboard. For example, aggregation queries bill for index entries read but this usage does not appear in the usage dashboard.
The usage dashboard for deletes does not capture automatic expiration operations performed by Time-to-live (TTL) policies. Please refer to the TTL metrics from Cloud Monitoring.
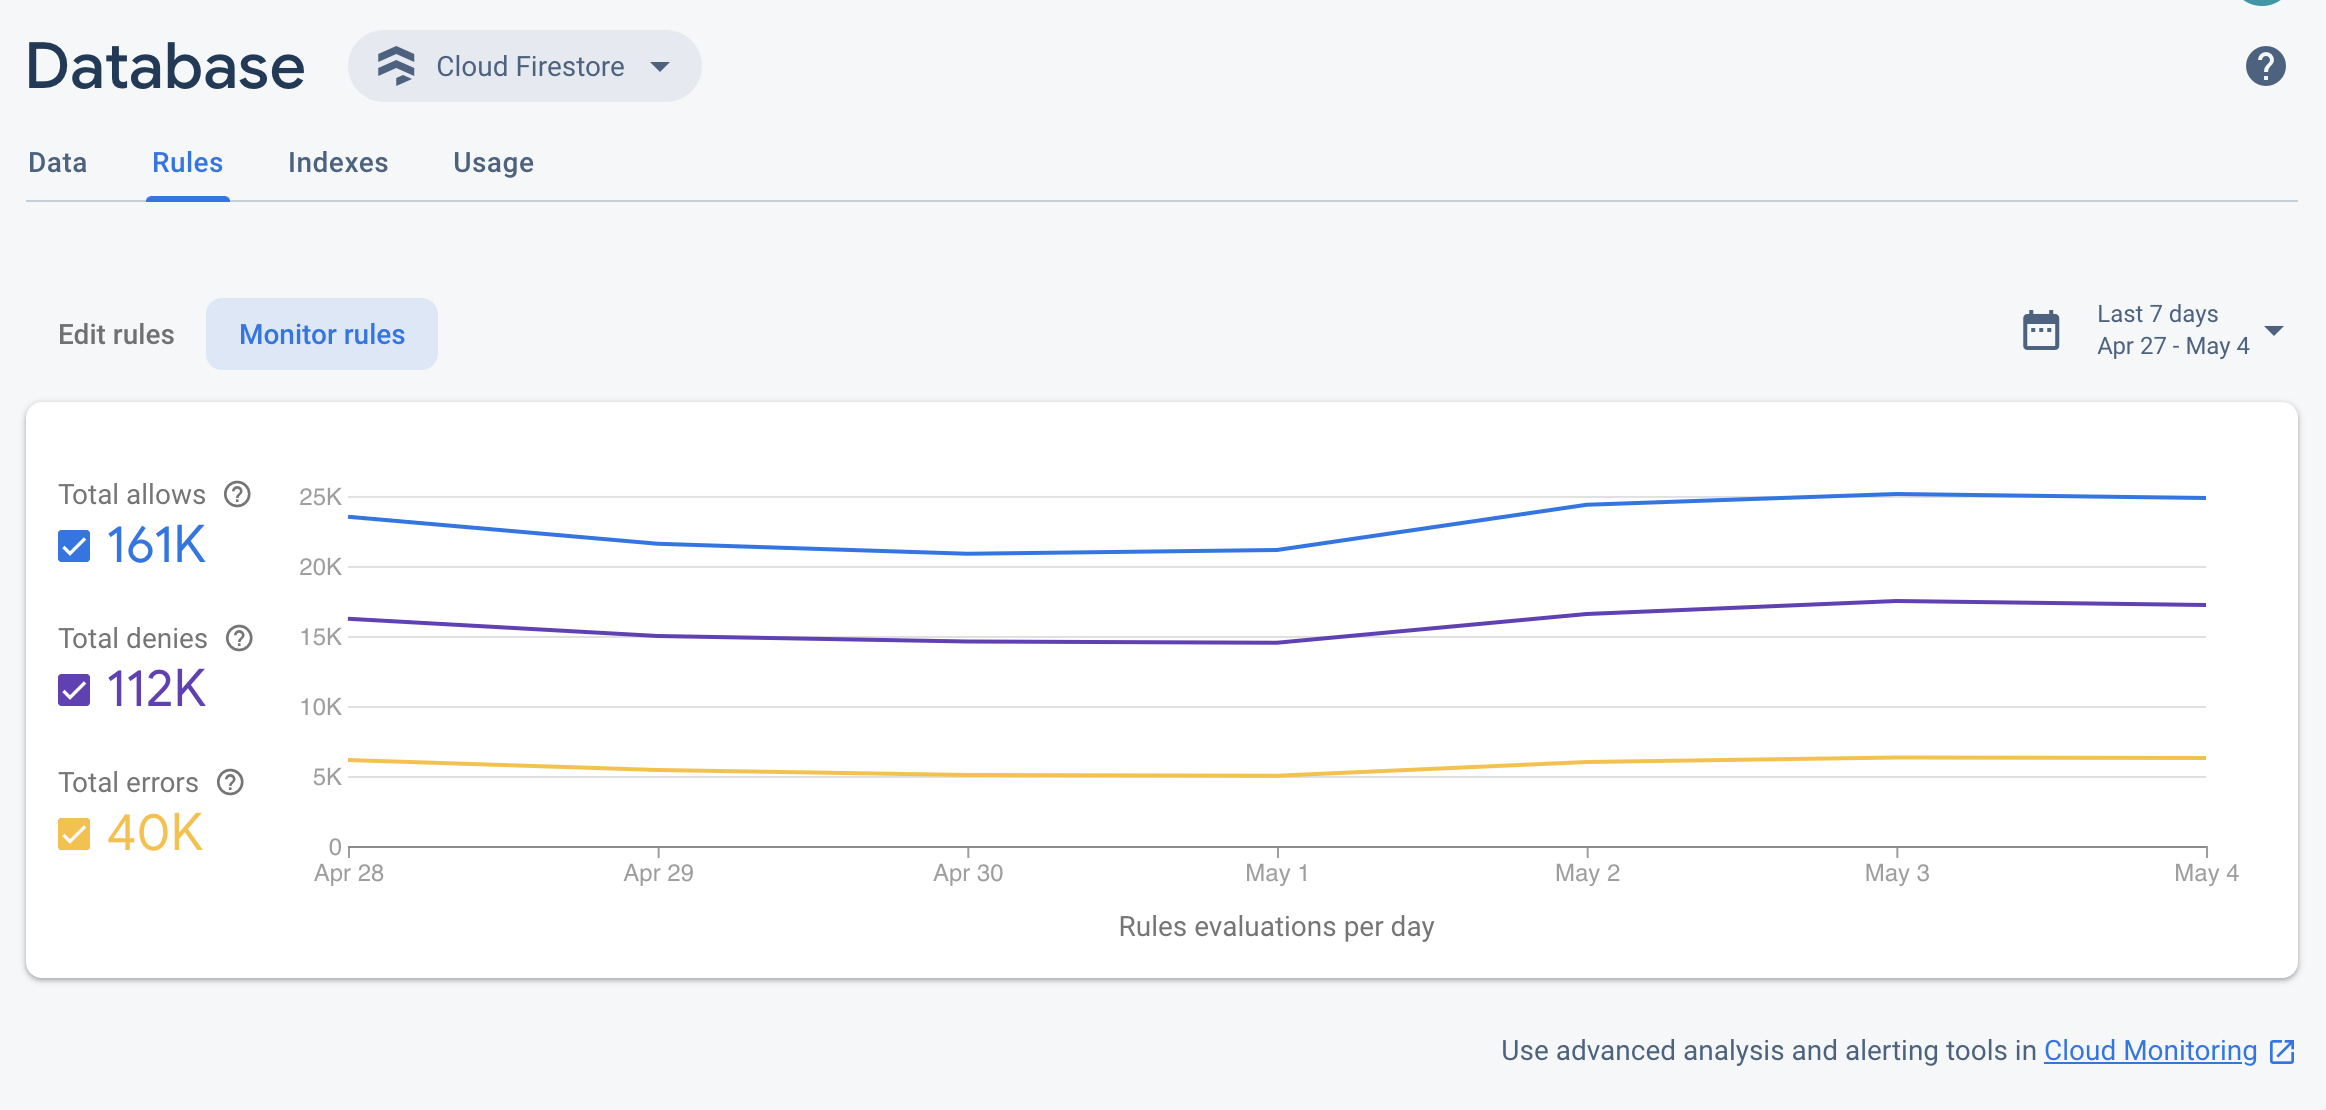
Security rule usage
Additionally, the Firebase console provides a Firebase Security Rules evaluation dashboard, a useful, at-a-glance view of rules invocations. You can also monitor Firebase Security Rules usage through Cloud Monitoring. This provides the same rule evaluation metrics, along with the ability to build custom dashboards, analyze trends, and configure alerts (for example, when denied requests spike). See the Cloud Monitoring metrics reference for the complete list of available metrics.
Cloud Monitoring metrics
Cloud Monitoring collects metrics, events, and metadata from Google Cloud products. The usage dashboard in the Firestore console reports the same metrics data. To set up custom dashboards and usage alerts, use Cloud Monitoring.
Cloud Monitoring includes the following Firestore metrics:
| Metric Name | Description |
|---|---|
| Document Reads |
The number of successful document reads. You can break this metric down by the type of read: LOOKUP or QUERY. This metric does not include reads from managed export or bulk delete operations. |
| Document Writes |
The number of successful document writes. You can break the metric down by the type of write: CREATE or UPDATE. This metric does not include writes from managed import operations. |
| Document Deletes | The number of successful document deletes. |
| Active Connections |
The number of active connections to your database. Each active mobile and web SDK maintains a single connection, which can be shared across multiple snapshot listeners. The server client libraries create one connection per snapshot listener. |
| Snapshot Listeners |
The number of snapshot listeners across all active connections. |
| Time-to-live deletion count |
Total count of documents deleted by Time-to-live (TTL) policies. |
| Time-to-live expiration to deletion delays |
Time elapsed between when a document expired under a Time-to-live (TTL) policy and when it was actually deleted. |
- Realtime updates usage
Use the active connections and snapshot listeners metrics to measure your usage of realtime updates.
Let's say a user opens your app on their phone. The app then connects to Firestore and subscribes to 10 queries. This increases your metrics by 1 active connection and 10 snapshot listeners.
- Sampling rate
The Firestore metrics are sampled every minute, but updates may take up to 4 minutes to show up in your dashboards.
Latency metrics
Backend latency metrics are available through common Google Cloud firestore metrics.
For example, a graph of p50 latency can be found in the Cloud Console's metrics explorer view.
Set up a Cloud Monitoring dashboard
To view a pre-defined dashboard or to set up a dashboard, see Use the monitoring dashboard.