Cloud Monitoring provides powerful logging and diagnostics. Dataflow integration with Monitoring lets you access Dataflow job metrics such as job status, element counts, system lag (for streaming jobs), and user counters from the Monitoring dashboards. You can also use Monitoring alerts to notify you of various conditions, such as long streaming system lag or failed jobs.
Before you begin
Follow the Java tutorial, Python tutorial, or Go tutorial to set up your Dataflow project. Then, construct and run your pipeline.
To see logs in Metrics Explorer, the
worker service account
must have the roles/monitoring.metricWriter role.
Custom metrics
Any metric that you define in your Apache Beam pipeline is reported by
Dataflow to Monitoring as a custom metric.
Apache Beam has
three types of pipeline metrics:
Counter, Distribution, and Gauge.
- Dataflow reports
CounterandDistributionmetrics to Monitoring. Distributionis reported as four submetrics suffixed with_MAX,_MIN,_MEAN, and_COUNT.- Dataflow doesn't support creating a histogram from
Distributionmetrics. - Dataflow reports incremental updates to Monitoring approximately every 30 seconds.
- To avoid conflicts, all Dataflow custom metrics are
exported as a
doubledata type. For simplicity, all Dataflow custom metrics are exported as a
GAUGEmetric kind. You can monitor the delta over a time window for aGAUGEmetric, as shown in the following Monitoring Query Language example:fetch dataflow_job | metric 'dataflow.googleapis.com/job/user_counter' | filter (metric.job_id == '[JobID]') | delta 1m | group_by 1m, [value_user_counter_mean: mean(value.user_counter)] | every 1m | group_by [metric.ptransform, metric.metric_name], [value_user_counter_mean_aggregate: aggregate(value_user_counter_mean)]The Dataflow custom metrics appear in Monitoring as
dataflow.googleapis.com/job/user_counterwith the labelsmetric_name: metric-nameandptransform: ptransform-name.For backward compatibility, Dataflow also reports custom metrics to Monitoring as
custom.googleapis.com/dataflow/metric-name.The Dataflow custom metrics are subject to the limitation of cardinality in Monitoring.
Each project has a limit of 100 Dataflow custom metrics. These metrics are published as
custom.googleapis.com/dataflow/metric-name.
Custom metrics that are reported to Monitoring incur charges based on the Cloud Monitoring pricing.
Use Metrics Explorer
Use Monitoring to explore Dataflow metrics. Follow the steps in this section to observe the standard metrics that are provided for each of your Apache Beam pipelines. For more information about using Metrics Explorer, see Create charts with Metrics Explorer.
In the Google Cloud console, select Monitoring:
In the navigation pane, select Metrics explorer.
In the Select a metric pane, enter
Dataflow Jobin the filter.From the list that appears, select a metric to observe for one of your jobs.
When running Dataflow jobs, you might also want to monitor metrics for your sources and sinks. For example, you might want to monitor BigQuery Storage API metrics. For more information, see Create dashboards, charts, and alerts and the complete list of metrics from the BigQuery Data Transfer Service.
Create alerting policies and dashboards
Monitoring provides access to Dataflow-related metrics. Create dashboards to chart the time series of metrics, and create alerting policies that notify you when metrics reach specified values.
Create groups of resources
To make it easier to set alerts and build dashboards, create resource groups that include multiple Apache Beam pipelines.
In the Google Cloud console, select Monitoring:
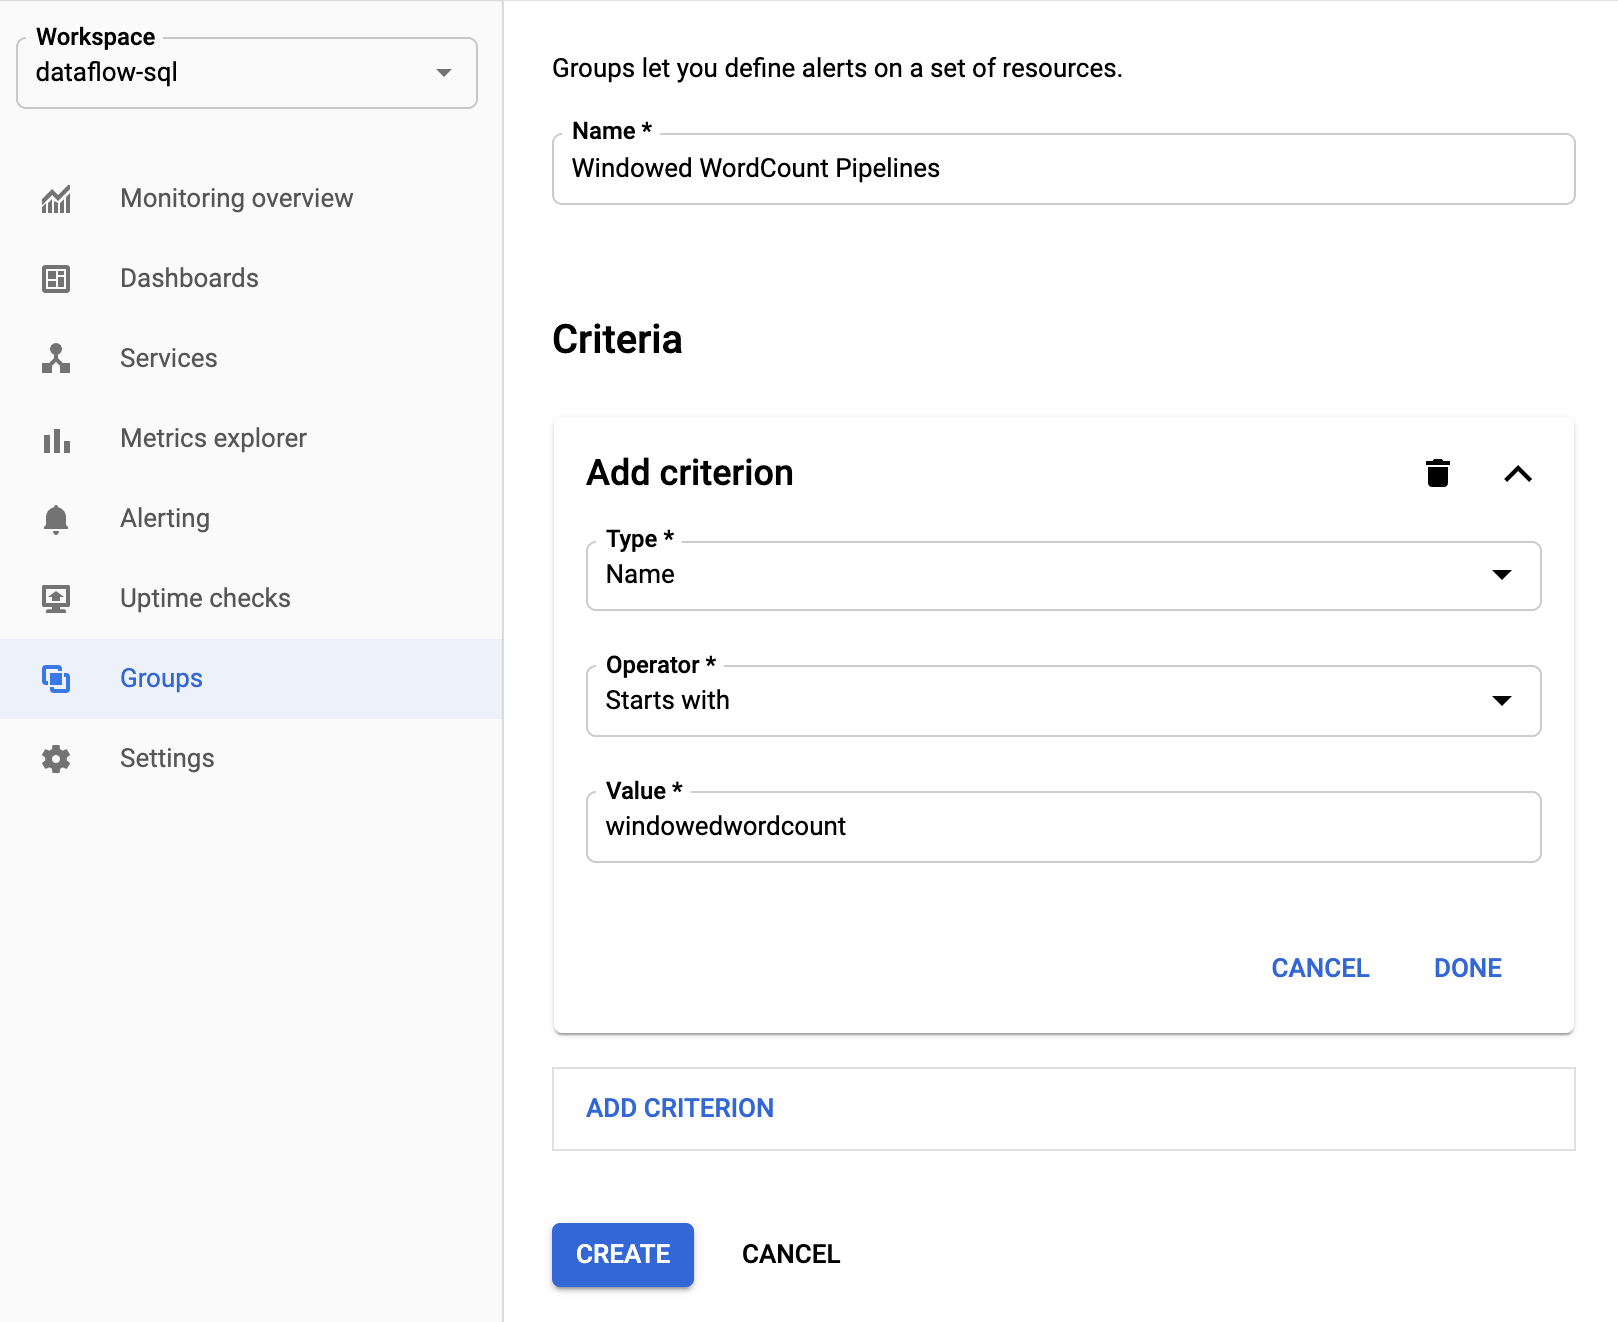
In the navigation pane, select Groups.
Click Create group.
Enter a name for your group.
Add filter criteria that define the Dataflow resources included in the group. For example, one of your filter criteria can be the name prefix of your pipelines.

After the group is created, you can see the basic metrics related to resources in that group.
Create alerting policies for Dataflow metrics
Monitoring lets you create alerts and receive notifications when a metric crosses a specified threshold. For example, you can receive a notification when system lag of a streaming pipeline increases above a predefined value.
In the Google Cloud console, select Monitoring:
In the navigation pane, select Alerting.
Click Create policy.
On the Create new alerting policy page, define the alerting conditions and notification channels.
For example, to set an alert on the system lag for theWindowedWordCountApache Beam pipeline group, complete the following steps:- Click Select a metric.
- In the Select a metric field, enter
Dataflow Job. - For Metric Categories, select Job.
- For Metrics, select System lag.
Every time an alert is triggered, an incident and a corresponding event are created. If you specified a notification mechanism in the alert, such as email or SMS, you also receive a notification.
Build custom monitoring dashboards
You can build Monitoring dashboards with the most relevant Dataflow-related charts. To add a chart to a dashboard, follow these steps:
In the Google Cloud console, select Monitoring:
In the navigation pane, select Dashboards.
Click Create dashboard.
Click Add widget.
In the Add widget window, for Data, select Metric.
In the Select a metric pane, for Metric, enter
Dataflow Job.Select a metric category and a metric.
You can add as many charts to the dashboard as you like.
Receive worker VM metrics from the Monitoring agent
You can use the Monitoring to monitor persistent disk, CPU, network, and process metrics. When you run your pipeline, from your Dataflow worker VM instances, enable the Monitoring agent. See the list of available Monitoring agent metrics.
To enable the Monitoring agent, use the --experiments=enable_stackdriver_agent_metrics
option when running your pipeline. The
worker service account
must have the roles/monitoring.metricWriter role.
To disable the Monitoring agent without stopping your pipeline,
update your pipeline by
launching a replacement job
without the --experiments=enable_stackdriver_agent_metrics parameter.
Storage and retention
Information about completed or cancelled Dataflow jobs is stored for 30 days.
Operational logs are stored in the
_Default log bucket.
The logging API service name is dataflow.googleapis.com. For more information about
the Google Cloud Platform monitored resource types and services used in Cloud Logging,
see Monitored resources and services.
For details about how long log entries are retained by Logging, see the retention information in Quotas and limits: Logs retention periods.
For information about viewing operational logs, see Monitor and view pipeline logs.
What's next
To learn more, consider exploring these other resources:
