Cloud Profiler is a statistical, low-overhead profiler that continuously gathers CPU usage and memory allocation information from your production applications. For more details, see Profiling concepts. To troubleshoot or monitor pipeline performance, use Dataflow integration with Cloud Profiler to identify the parts of the pipeline code consuming the most resources.
For troubleshooting tips and debugging strategies for building or running your Dataflow pipeline, see Troubleshooting and debugging pipelines.
Before you begin
Understand profiling concepts and familiarize yourself with the Profiler interface. For information about how to get started with the Profiler interface, see Select the profiles to analyze.
The Cloud Profiler API must be enabled for your project before your job is started.
It is enabled automatically the first time you visit the Profiler
page.
Alternatively, you can enable the Cloud Profiler API by using the
Google Cloud CLI gcloud command-line tool or the Google Cloud console.
To use Cloud Profiler, your project must have enough quota.
In addition, the
worker service account
for the Dataflow job must have
appropriate permissions for Profiler. For example, to create
profiles, the worker service account must have the cloudprofiler.profiles.create
permission, which is included in the Cloud Profiler Agent
(roles/cloudprofiler.agent) IAM role.
For more information, see Access control with IAM.
Enable Cloud Profiler for Dataflow pipelines
Cloud Profiler is available for Dataflow pipelines written in Apache Beam SDK for Java and Python, version 2.33.0 or later. Python pipelines must use Dataflow Runner v2. Cloud Profiler can be enabled at pipeline start time. The amortized CPU and memory overhead is expected to be less than 1% for your pipelines.
Java
To enable CPU profiling, start the pipeline with the following option.
--dataflowServiceOptions=enable_google_cloud_profiler
To enable heap profiling, start the pipeline with the following options. Heap profiling requires Java 11 or higher.
--dataflowServiceOptions=enable_google_cloud_profiler
--dataflowServiceOptions=enable_google_cloud_heap_sampling
Python
To use Cloud Profiler, your Python pipeline must run with Dataflow Runner v2.
To enable CPU profiling, start the pipeline with the following option. Heap profiling is not yet supported for Python.
--dataflow_service_options=enable_google_cloud_profiler
Go
To enable CPU and heap profiling, start the pipeline with the following option.
--dataflow_service_options=enable_google_cloud_profiler
If you deploy your pipelines from Dataflow templates and want to enable Cloud Profiler,
specify the enable_google_cloud_profiler and
enable_google_cloud_heap_sampling flags as additional experiments.
Console
If you use a Google-provided template, you can specify the flags on the Dataflow Create job from template page in the Additional experiments field.
gcloud
If you use the Google Cloud CLI to run
templates, either gcloud
dataflow jobs run or gcloud dataflow flex-template run, depending on
the template type, use the --additional-experiments
option to specify the flags.
API
If you use the REST
API to run templates, depending on the template type, specify the flags using the
additionalExperiments field of the runtime environment, either RuntimeEnvironment or FlexTemplateRuntimeEnvironment.
View the profiling data
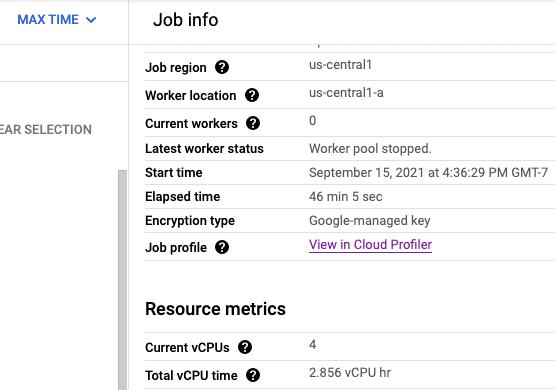
If Cloud Profiler is enabled, a link to the Profiler page is shown on the job page.

On the Profiler page, you can also find the profiling data for your Dataflow pipeline. The Service is your job name and the Version is your job ID.

Using the Cloud Profiler
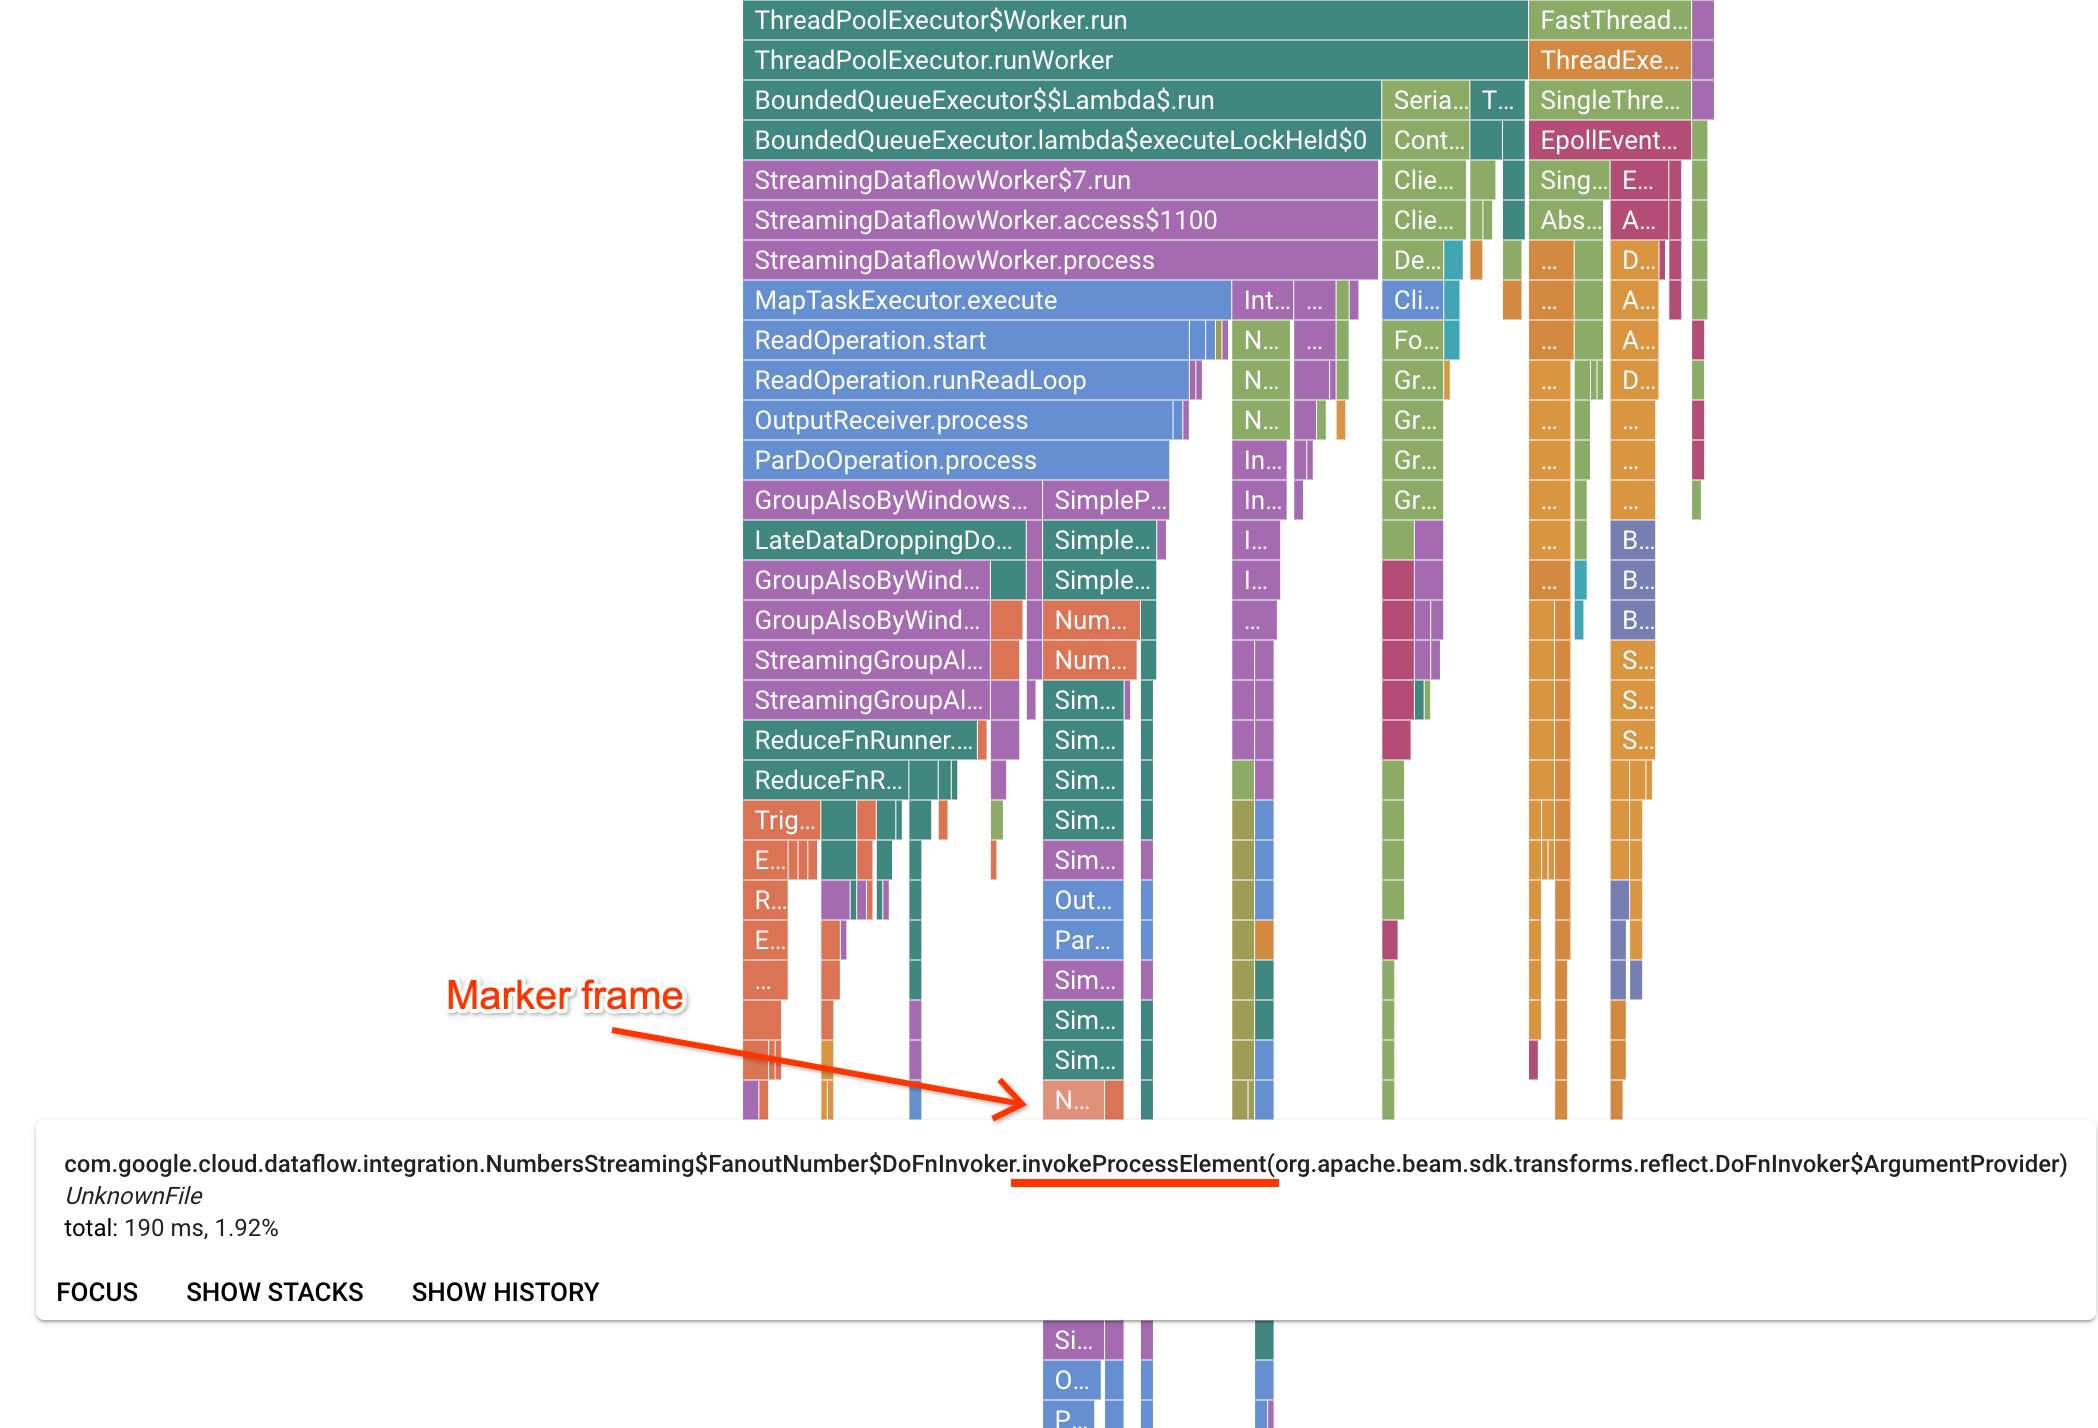
The Profiler page contains a flame graph which displays statistics for each frame running on a worker. In the horizontal direction, you can see how long each frame took to execute in terms of CPU time. In the vertical direction, you can see stack traces and code running in parallel. The stack traces are dominated by runner infrastructure code. For debugging purposes we are usually interested in user code execution, which is typically found near the bottom tips of the graph. User code can be identified by looking for marker frames, which represent runner code that is known to only call into user code. In the case of the Beam ParDo runner, a dynamic adapter layer is created to invoke the user-supplied DoFn method signature. This layer can be identified as a frame with the invokeProcessElement suffix. The following image shows a demonstration of finding a marker frame.

After clicking on an interesting marker frame, the flame graph focuses on that stack trace, giving a good sense of long running user code. The slowest operations can indicate where bottlenecks have formed and present opportunities for optimization. In the following example, it is possible to see that Global Windowing is being used with a ByteArrayCoder. In this case, the coder might be a good area for optimization because it is taking up significant CPU time compared to the ArrayList and HashMap operations.

Troubleshoot Cloud Profiler
If you enable Cloud Profiler and your pipeline doesn't generate profiling data, one of the following conditions might be the cause.
Your pipeline uses an older Apache Beam SDK version. To use Cloud Profiler, you need to use Apache Beam SDK version 2.33.0 or later. You can view your pipeline's Apache Beam SDK version on the job page. If your job is created from Dataflow templates, the templates must use the supported SDK versions.
Your project is running out of Cloud Profiler quota. You can view the quota usage from your project's quota page. An error such as
Failed to
collect and upload profile whose profile type is WALL
can occur if the Cloud Profiler quota is exceeded. The Cloud Profiler service rejects the profiling data if you've reached your quota. For more information about Cloud Profiler quotas, see Quotas and Limits.Your job didn't run long enough to generate data for Cloud Profiler. Jobs that run for short durations, such as less than five minutes, might not provide enough profiling data for Cloud Profiler to generate results.
The Cloud Profiler agent is installed during Dataflow worker
startup. Log messages generated by Cloud Profiler are available in the log
type dataflow.googleapis.com/worker-startup.

Sometimes, profiling data exists but Cloud Profiler does not display any
output. The Profiler displays a message similar to, There were
profiles collected for the specified time range, but none match the current
filters.
To resolve this issue, try the following troubleshooting steps.
Make sure that the timespan and end time in the Profiler are inclusive of the job's elapsed time.
Confirm that the correct job is selected in the Profiler. The Service is your job name.
Confirm that the
job_namepipeline option has the same value as the job name on the Dataflow job page.If you specified a service-name argument when you loaded the Profiler agent, confirm that the service name is configured correctly.
