Cloud Profiler는 오버헤드가 낮은 통계 프로파일러로, 프로덕션 애플리케이션에서 CPU 사용량과 메모리 할당 정보를 지속적으로 수집합니다. 자세한 내용은 프로파일링 개념을 참조하세요.
파이프라인 성능 문제를 해결하거나 모니터링하려면 Cloud Profiler와 Dataflow 통합을 사용하여 가장 많은 리소스를 소비하는 파이프라인 코드 부분을 식별합니다.
Dataflow 파이프라인을 빌드하거나 실행하기 위한 문제해결 팁과 디버깅 전략은 파이프라인 문제해결 및 디버깅을 참조하세요.
시작하기 전에
프로파일링 개념을 이해하고 Profiler 인터페이스를 숙지해야 합니다.
Profiler 인터페이스를 시작하는 방법은 분석할 프로필 선택을 참조하세요.
작업이 시작되기 전에 프로젝트에 Cloud Profiler API를 사용 설정해야 합니다.
처음 Profiler 페이지를 방문할 때 자동으로 사용 설정됩니다.
또는 Google Cloud CLIgcloud 명령줄 도구 또는 Google Cloud 콘솔을 사용하여 Cloud Profiler API를 사용 설정할 수 있습니다.
Cloud Profiler를 사용하려면 프로젝트에 있는 할당량이 충분해야 합니다.
또한 Dataflow 작업의 작업자 서비스 계정에는 Profiler에 대한 적절한 권한이 있어야 합니다. 예를 들어 프로필을 만들려면 작업자 서비스 계정에 Cloud Profiler Agent(roles/cloudprofiler.agent) IAM 역할에 포함된 cloudprofiler.profiles.create 권한이 있어야 합니다.
자세한 내용은 IAM으로 액세스 제어를 참조하세요.
Dataflow 파이프라인에 Cloud Profiler 사용 설정
Cloud Profiler는 Java 및 Python용 Apache Beam SDK 버전 2.33.0 이상으로 작성된 Dataflow 파이프라인에 사용할 수 있으며, Python 파이프라인에서는 Dataflow Runner v2를 사용해야 합니다. Cloud Profiler는 파이프라인 시작 시 사용 설정할 수 있습니다. 분할 상쇄된 CPU와 메모리 오버헤드는 파이프라인의 1% 미만일 것으로 예상됩니다.
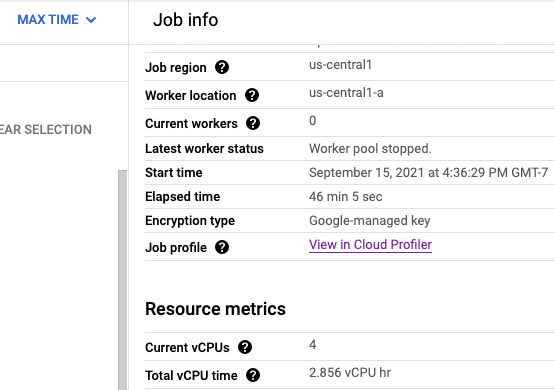
Cloud Profiler가 사용 설정되면 작업 페이지에 Profiler 페이지 링크가 표시됩니다.
또한 프로파일러 페이지에서 Dataflow 파이프라인에 대한 프로파일링 데이터를 찾을 수도 있습니다. 서비스는 작업 이름이고 버전은 작업 ID입니다.
Cloud Profiler 사용
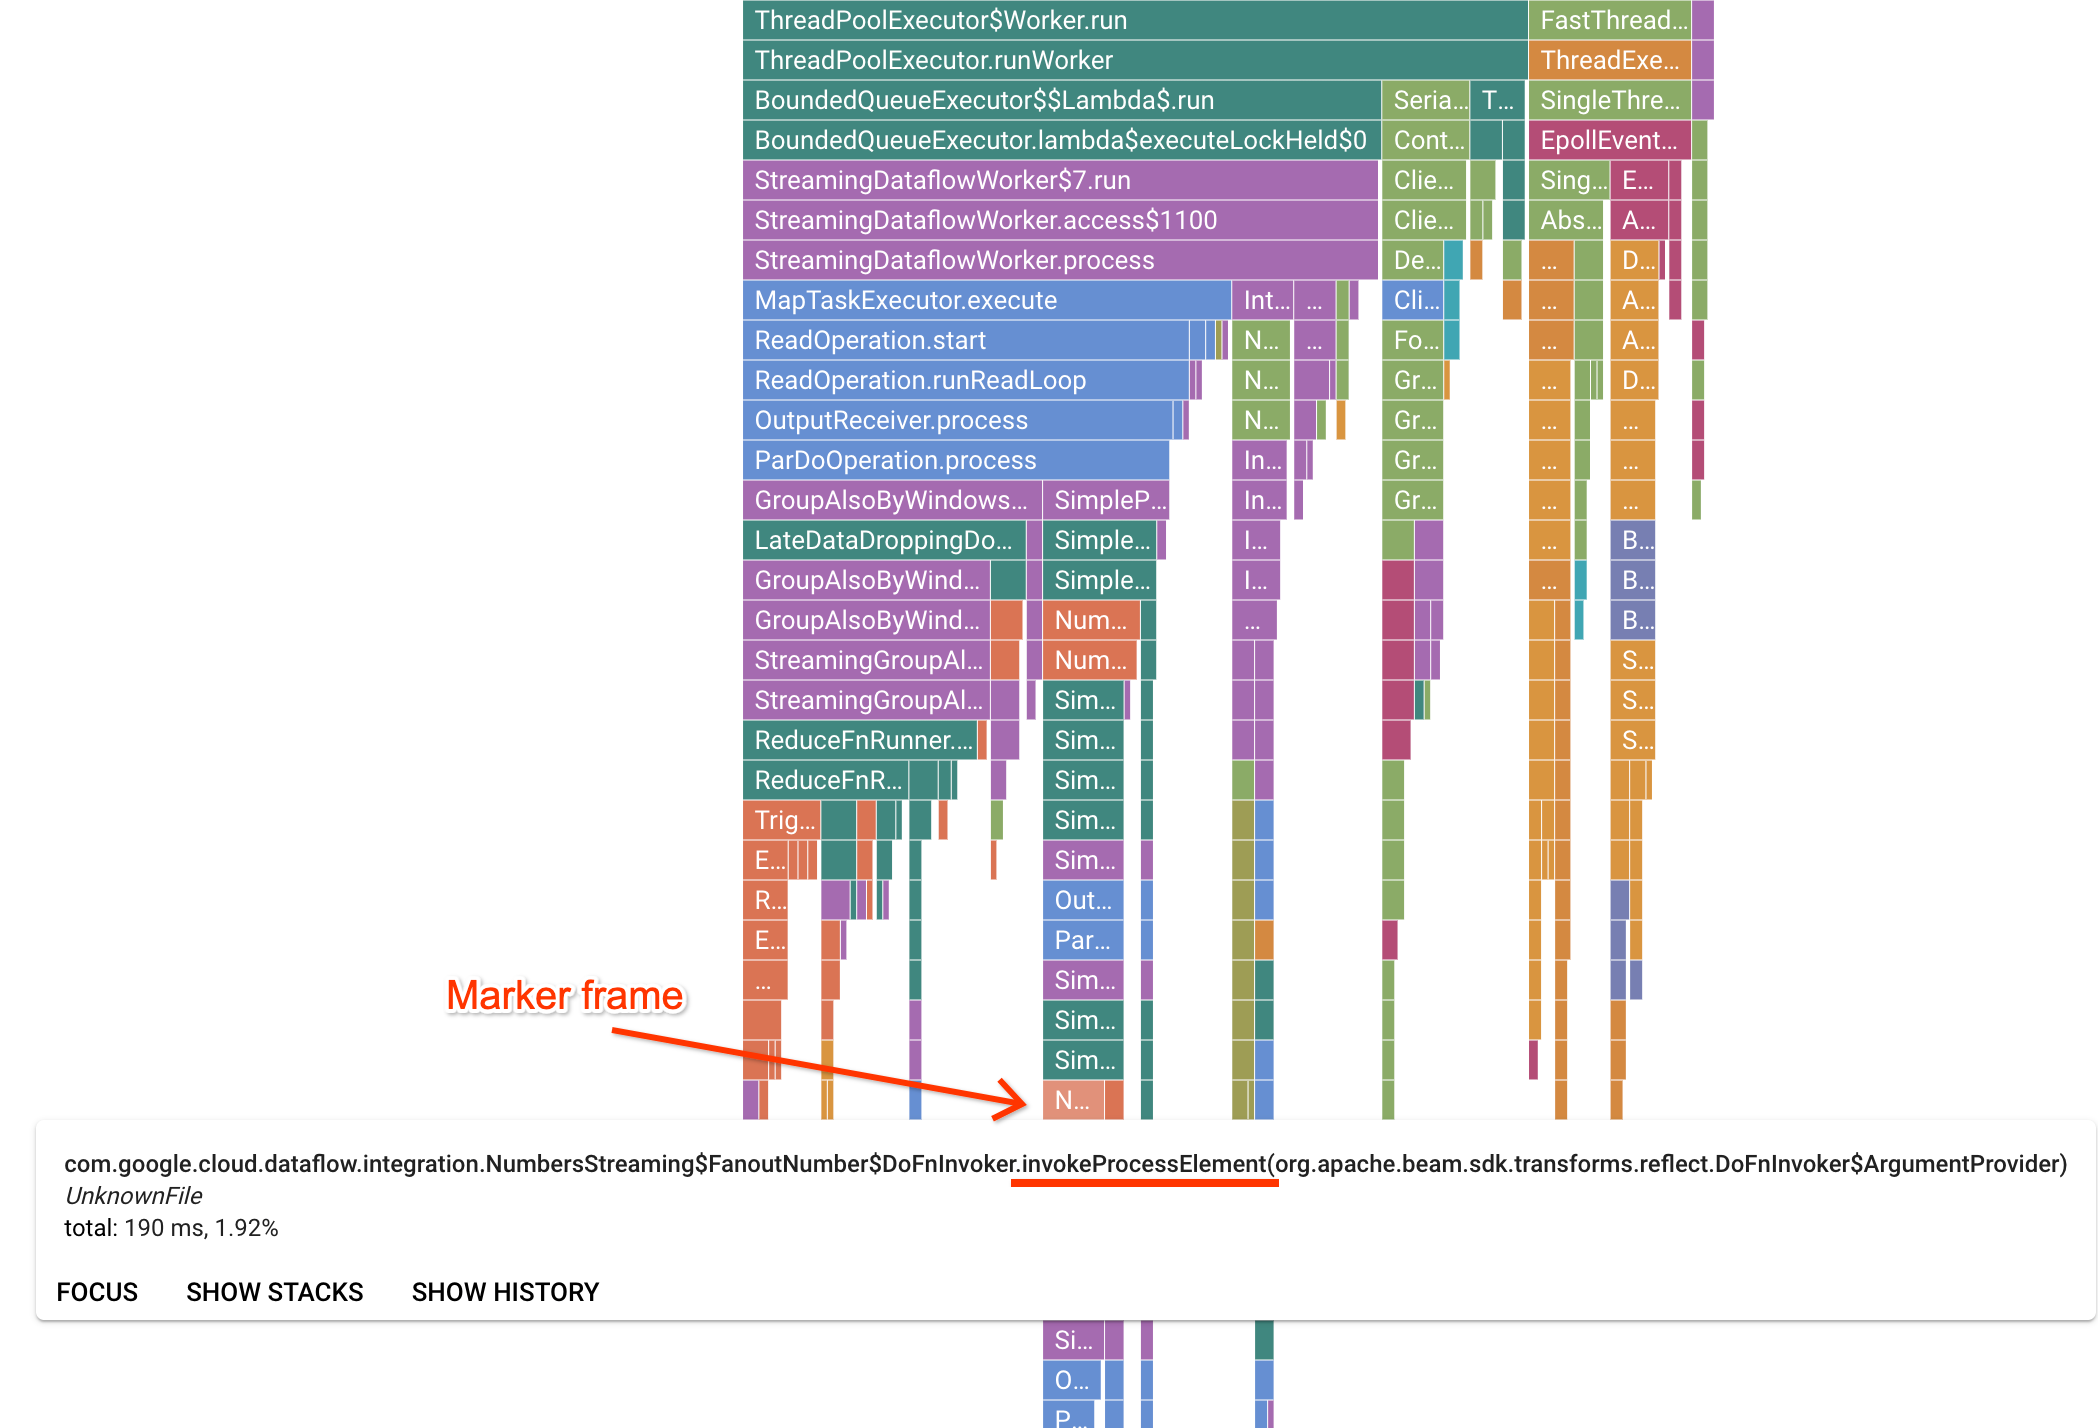
Profiler 페이지에는 작업자에서 실행 중인 각 프레임의 통계를 표시하는 Flame 그래프가 포함되어 있습니다.
가로 방향에서는 각 프레임을 실행하는 데 걸린 시간을 CPU 시간 관점에서 확인할 수 있습니다.
수직 방향으로는 스택 트레이스와 코드가 동시에 실행되는 것을 볼 수 있습니다.
스택 트레이스는 실행기 인프라 코드에서 사용됩니다. 디버깅을 위해 Google은 일반적으로 사용자 코드 실행에 관심이 있으며 사용자 코드는 보통 그래프 하단 팁 근처에 있습니다.
사용자 코드만 호출하는 것으로 알려진 실행기 코드를 나타내는 마커 프레임을 찾아서 사용자 코드를 식별할 수 있습니다.
Beam ParDo 실행기의 경우 사용자가 제공한 DoFn 메서드 서명을 호출하도록 동적 어댑터 레이어가 생성됩니다.
이 레이어는 invokeProcessElement 서픽스가 있는 프레임으로 식별될 수 있습니다.
다음 이미지에서는 마커 프레임을 찾는 방법을 보여줍니다.
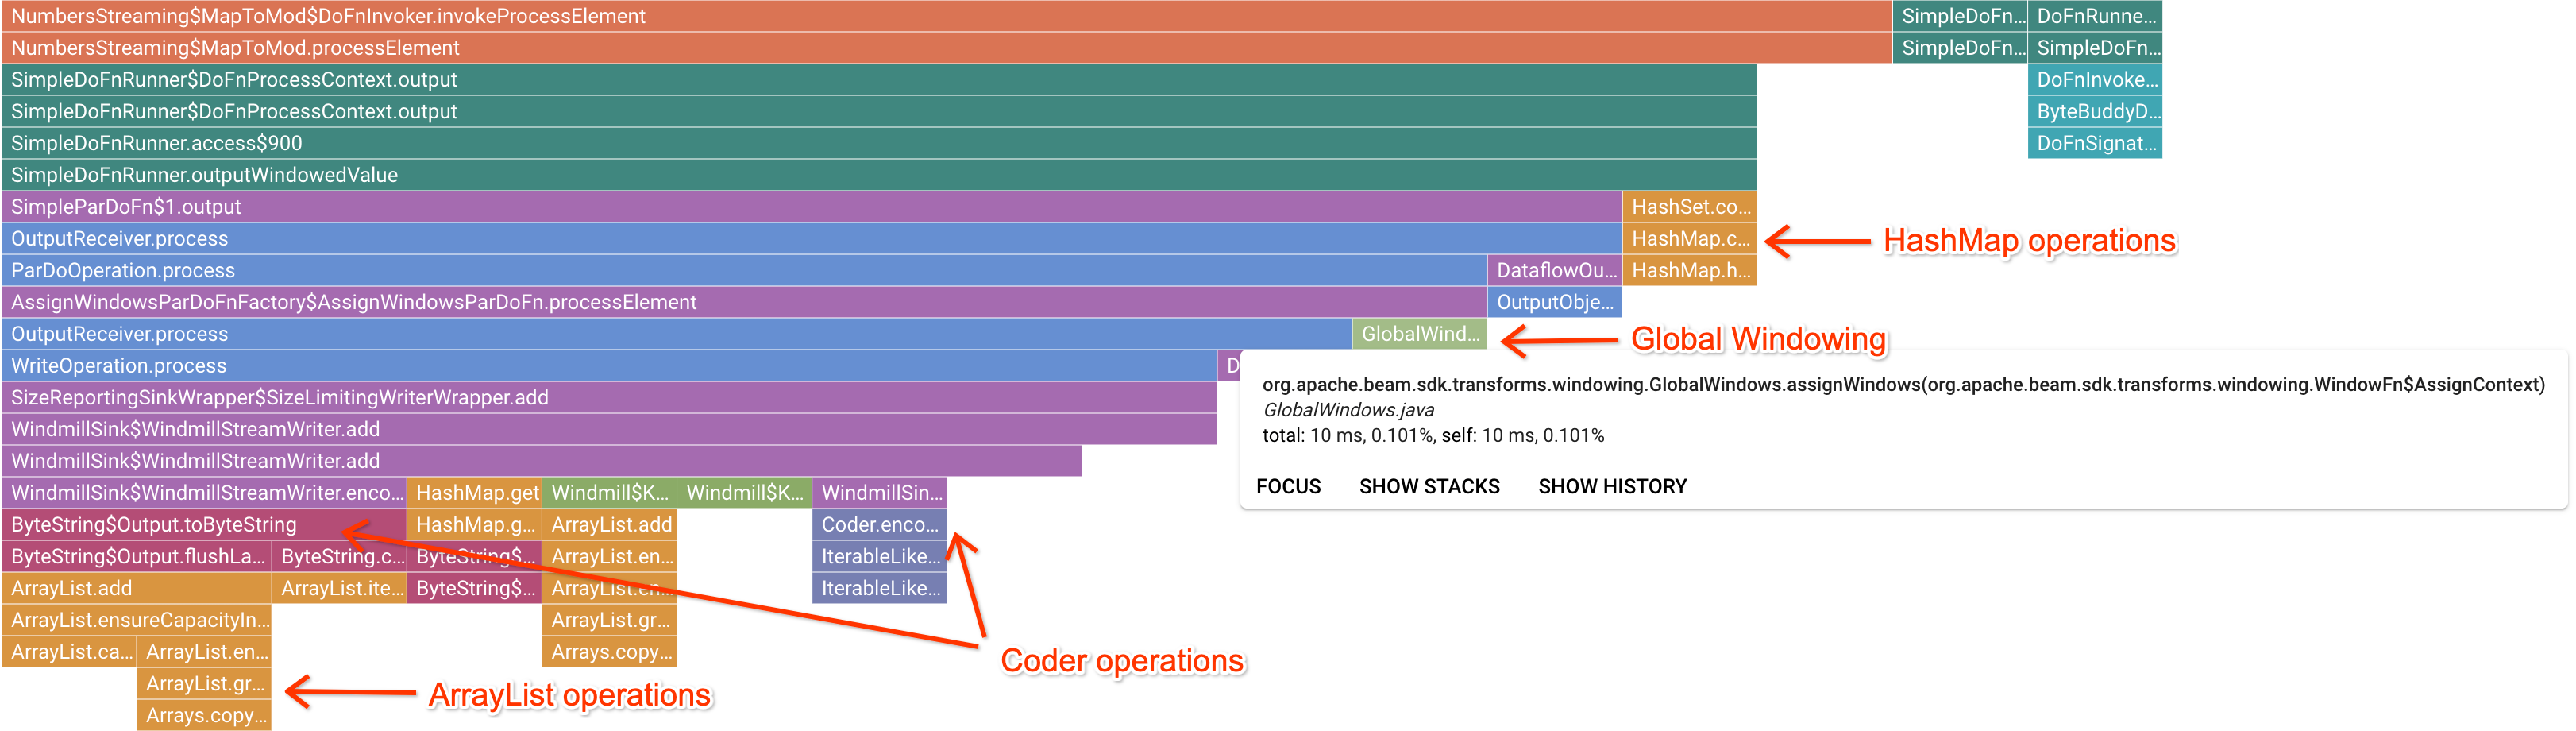
흥미로운 마커 프레임을 클릭하면 Flame 그래프에서 해당 스택 트레이스를 집중적으로 표시하므로 장기간 실행 중인 사용자 코드를 파악할 수 있습니다.
가장 느린 작업은 병목 현상이 발생한 지점과 현재의 최적화 기회를 나타낼 수 있습니다.
다음 예시에서는 ByteArrayCoder와 함께 전역 윈도우가 사용되고 있는 것을 확인할 수 있습니다.
이 경우 코더가 ArrayList 및 HashMap 작업에 비해 상당한 CPU 시간을 소모하므로 최적화용으로 적합할 수 있습니다.
Cloud Profiler 문제 해결
Cloud Profiler를 사용 설정해도 파이프라인이 프로파일링 데이터를 생성하지 않으면 다음 조건 중 하나가 원인일 수 있습니다.
파이프라인에서 이전 Apache Beam SDK 버전을 사용합니다. Cloud Profiler를 사용하려면 Apache Beam SDK 버전 2.33.0 이상을 사용해야 합니다.
작업 페이지에서 파이프라인의 Apache Beam SDK 버전을 볼 수 있습니다. 작업이 Dataflow 템플릿에서 생성된 경우에는 템플릿에 지원되는 SDK 버전이 사용되어야 합니다.
프로젝트의 Cloud Profiler 할당량이 부족합니다. 프로젝트의 할당량 페이지에서 할당량 사용량을 볼 수 있습니다. Cloud Profiler 할당량이 초과되면 Failed to
collect and upload profile whose profile type is WALL과 같은 오류가 발생할 수 있습니다. 할당량에 도달하면 Cloud Profiler 서비스가 프로파일링 데이터를 거부합니다. Cloud Profiler 할당량에 대한 자세한 내용은 할당량 및 한도를 참고하세요.
작업이 Cloud Profiler의 데이터를 생성하기에 충분히 오래 실행되지 않았습니다.
짧은 시간(예: 5분 미만) 동안 실행되는 작업은 Cloud Profiler에서 결과를 생성하는 데 충분한 프로파일링 데이터를 제공하지 못할 수 있습니다.
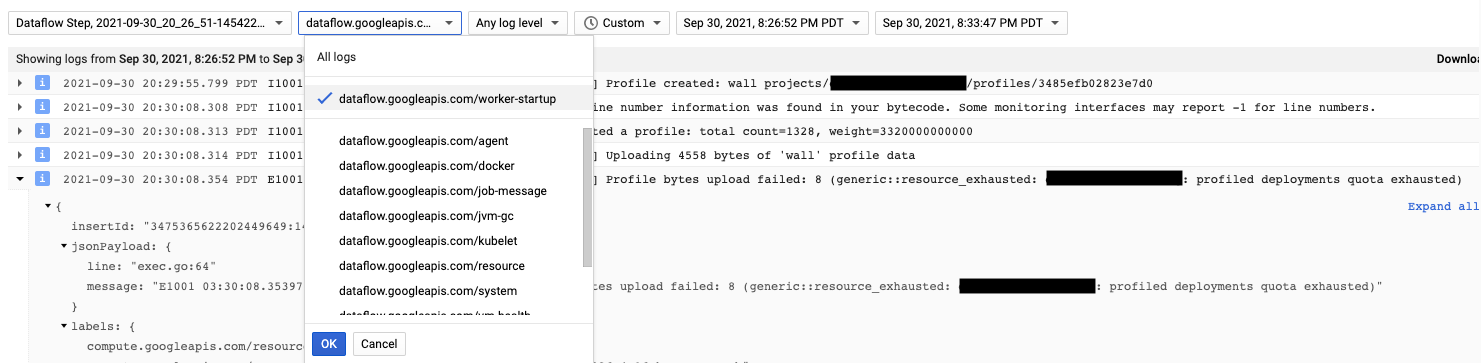
Cloud Profiler 에이전트는 Dataflow 작업자 시작 중에 설치됩니다. Cloud Profiler에서 생성한 로그 메시지는 dataflow.googleapis.com/worker-startup 로그 유형에서 확인할 수 있습니다.
프로파일링 데이터가 있지만 Cloud Profiler에 출력이 표시되지 않는 경우가 있습니다. 프로파일러에 There were
profiles collected for the specified time range, but none match the current
filters와 유사한 메시지가 표시됩니다.
이 문제를 해결하려면 다음 문제 해결 단계를 시도해 보세요.
Profiler의 기간 및 종료 시간이 작업의 경과 시간을 포함하는지 확인합니다.
Profiler에서 올바른 작업이 선택되어 있는지 확인합니다. 서비스는 작업 이름입니다.
job_name 파이프라인 옵션에 Dataflow 작업 페이지의 작업 이름과 동일한 값이 있는지 확인합니다.
Profiler 에이전트를 로드할 때 service-name 인수를 지정한 경우 서비스 이름이 올바르게 구성되었는지 확인합니다.
[[["이해하기 쉬움","easyToUnderstand","thumb-up"],["문제가 해결됨","solvedMyProblem","thumb-up"],["기타","otherUp","thumb-up"]],[["이해하기 어려움","hardToUnderstand","thumb-down"],["잘못된 정보 또는 샘플 코드","incorrectInformationOrSampleCode","thumb-down"],["필요한 정보/샘플이 없음","missingTheInformationSamplesINeed","thumb-down"],["번역 문제","translationIssue","thumb-down"],["기타","otherDown","thumb-down"]],["최종 업데이트: 2025-04-21(UTC)"],[[["\u003cp\u003eCloud Profiler is a tool that continuously gathers CPU and memory usage data from production applications, and integrates with Dataflow to help identify resource-intensive parts of pipelines.\u003c/p\u003e\n"],["\u003cp\u003eTo enable Cloud Profiler for Dataflow pipelines, you must use Apache Beam SDK version 2.33.0 or later, and start the pipeline with specific options like \u003ccode\u003e--dataflowServiceOptions=enable_google_cloud_profiler\u003c/code\u003e for CPU profiling.\u003c/p\u003e\n"],["\u003cp\u003eYour project needs sufficient Cloud Profiler quota, and the Dataflow worker service account requires appropriate permissions, such as \u003ccode\u003ecloudprofiler.profiles.create\u003c/code\u003e, to create profiles.\u003c/p\u003e\n"],["\u003cp\u003eThe Profiler page displays a flame graph that allows you to visualize the execution time of code frames, while the use of marker frames, like those with the suffix \u003ccode\u003einvokeProcessElement\u003c/code\u003e help to pinpoint user code.\u003c/p\u003e\n"],["\u003cp\u003eIf profiling data is not displayed, check the Apache Beam SDK version, ensure the project has enough quota, verify the job ran long enough, confirm the correct job is selected, and review the service name.\u003c/p\u003e\n"]]],[],null,["Cloud Profiler is a statistical, low-overhead profiler that continuously\ngathers CPU usage and memory allocation information from your production\napplications. For more details, see [Profiling concepts](/profiler/docs/concepts-profiling).\nTo troubleshoot or monitor pipeline performance, use Dataflow\nintegration with Cloud Profiler to identify the parts of the pipeline code\nconsuming the most resources.\n\nFor troubleshooting tips and debugging strategies for building or running your\nDataflow pipeline, see\n[Troubleshooting and debugging pipelines](/dataflow/docs/guides/troubleshooting-your-pipeline).\n\nBefore you begin\n\nUnderstand [profiling concepts](/profiler/docs/concepts-profiling) and\nfamiliarize yourself with the Profiler interface.\nFor information about how to get started with the Profiler\ninterface, see\n[Select the profiles to analyze](/profiler/docs/selecting-profiles).\n\nThe Cloud Profiler API must be enabled for your project before your job is started.\nIt is enabled automatically the first time you [visit the Profiler\npage](/profiler/docs/measure-app-performance#before_you_begin).\nAlternatively, you can enable the Cloud Profiler API by using the\n[Google Cloud CLI](/profiler/docs/profiling-python#enabling-profiler) `gcloud` command-line tool or the Google Cloud console.\n\nTo use Cloud Profiler, your project must have enough [quota](/profiler/quotas).\nIn addition, the\n[worker service account](/dataflow/docs/concepts/security-and-permissions#worker-service-account)\nfor the Dataflow job must have\nappropriate permissions for Profiler. For example, to create\nprofiles, the worker service account must have the `cloudprofiler.profiles.create`\npermission, which is included in the Cloud Profiler Agent\n(`roles/cloudprofiler.agent`) IAM role.\nFor more information, see [Access control with IAM](/profiler/docs/iam).\n\nEnable Cloud Profiler for Dataflow pipelines\n\nCloud Profiler is available for Dataflow pipelines written in\nApache Beam SDK for Java and Python, version 2.33.0 or later. Python\npipelines must use Dataflow Runner v2. Cloud Profiler can be\nenabled at pipeline start time. The amortized CPU and memory overhead is\nexpected to be less than 1% for your pipelines. \n\nJava\n\n\nTo enable CPU profiling, start the pipeline with the following option.\n\n\n`--dataflowServiceOptions=enable_google_cloud_profiler`\n\nTo enable heap profiling, start the pipeline with the following options. Heap profiling\nrequires Java 11 or higher.\n\n`--dataflowServiceOptions=enable_google_cloud_profiler`\n\n`--dataflowServiceOptions=enable_google_cloud_heap_sampling`\n| Note: The pipeline option `--dataflowServiceOptions` is the\n| Dataflow preferred way to enable Dataflow\n| features. Alternatively, you can use `--experiments`.\n\nPython\n\nTo use Cloud Profiler, your Python pipeline must run with Dataflow\n[Runner v2](/dataflow/docs/runner-v2).\n\nTo enable CPU profiling, start the pipeline with the following option. Heap profiling is not yet supported for Python.\n\n`--dataflow_service_options=enable_google_cloud_profiler`\n| Note: The pipeline option `--dataflow_service_options` is\n| the Dataflow preferred way to enable Dataflow\n| features. Alternatively, you can use `--experiments`.\n\nGo\n\nTo enable CPU and heap profiling, start the pipeline with the following option.\n\n`--dataflow_service_options=enable_google_cloud_profiler`\n| Note: The pipeline option `--dataflow_service_options` is\n| the Dataflow preferred way to enable Dataflow\n| features. Alternatively, you can use `--experiments`.\n\nIf you deploy your pipelines from [Dataflow templates](/dataflow/docs/concepts/dataflow-templates) and want to enable Cloud Profiler,\nspecify the `enable_google_cloud_profiler` and\n`enable_google_cloud_heap_sampling` flags as additional experiments. \n\nConsole\n\nIf you use a [Google-provided\ntemplate](/dataflow/docs/guides/templates/provided-templates), you can specify the flags on the Dataflow **Create\njob from template** page in the **Additional experiments** field.\n\ngcloud\n\nIf you use the Google Cloud CLI to run\ntemplates, either [`gcloud\ndataflow jobs run`](/sdk/gcloud/reference/dataflow/jobs/run) or [`gcloud dataflow flex-template run`](/sdk/gcloud/reference/dataflow/flex-\ntemplate/run), depending on\nthe template type, use the `--additional-experiments`\noption to specify the flags.\n\nAPI\n\nIf you use the REST\nAPI to run templates, depending on the template type, specify the flags using the\n`additionalExperiments` field of the runtime environment, either [`RuntimeEnvironment`](/dataflow/docs/reference/rest/v1b3/RuntimeEnvironment) or [`FlexTemplateRuntimeEnvironment`](/dataflow/docs/reference/rest/v1b3/projects.locations.flexTemplates/launch\n#FlexTemplateRuntimeEnvironment).\n\nView the profiling data\n\nIf Cloud Profiler is enabled, a link to the Profiler page is\nshown on the job page.\n\nOn the Profiler page, you can also find the profiling data for\nyour Dataflow pipeline. The **Service** is your job name and the\n**Version** is your job ID.\n\nUsing the Cloud Profiler\n\nThe Profiler page contains a [flame graph](/profiler/docs/concepts-flame) which displays statistics for each frame running on a worker.\nIn the horizontal direction, you can see how long each frame took to execute in terms of CPU time.\nIn the vertical direction, you can see stack traces and code running in parallel.\nThe stack traces are dominated by runner infrastructure code. For debugging purposes we are usually interested in user code execution, which is typically found near the bottom tips of the graph.\nUser code can be identified by looking for **marker frames** , which represent runner code that is known to only call into user code.\nIn the case of the Beam ParDo runner, a dynamic adapter layer is created to invoke the user-supplied DoFn method signature.\nThis layer can be identified as a frame with the **invokeProcessElement** suffix.\nThe following image shows a demonstration of finding a **marker frame**.\n\nAfter clicking on an interesting marker frame, the flame graph focuses on that stack trace, giving a good sense of long running user code.\nThe slowest operations can indicate where bottlenecks have formed and present opportunities for optimization.\nIn the following example, it is possible to see that Global Windowing is being used with a ByteArrayCoder.\nIn this case, the coder might be a good area for optimization because it is taking up significant CPU time compared to the ArrayList and HashMap operations.\n| **Note:** The following filter can be applied to quickly find and isolate all marker frames: `Show from frame: invokeProcessElement`.\n\nTroubleshoot Cloud Profiler\n\nIf you enable Cloud Profiler and your pipeline doesn't generate profiling\ndata, one of the following conditions might be the cause.\n\n- Your pipeline uses an older Apache Beam SDK version. To use\n Cloud Profiler, you need to use Apache Beam SDK version 2.33.0 or later.\n You can view your pipeline's Apache Beam SDK version on the job page. If\n your job is created from Dataflow templates, the templates must\n use the [supported SDK versions](/dataflow/docs/support/sdk-version-support-status).\n\n- Your project is running out of Cloud Profiler quota. You can view the\n quota usage from your project's quota page. An error such as `Failed to\n collect and upload profile whose profile type is WALL` can occur if the\n Cloud Profiler quota is exceeded. The Cloud Profiler service\n rejects the profiling data if you've reached your quota. For more information about Cloud Profiler quotas, see [Quotas and Limits](/profiler/quotas).\n\n- Your job didn't run long enough to generate data for Cloud Profiler.\n Jobs that run for short durations, such as less than five minutes, might not\n provide enough profiling data for Cloud Profiler to generate results.\n\nThe Cloud Profiler agent is installed during Dataflow worker\nstartup. Log messages generated by Cloud Profiler are available in the log\ntype `dataflow.googleapis.com/worker-startup`.\n\nSometimes, profiling data exists but Cloud Profiler does not display any\noutput. The Profiler displays a message similar to, `There were\nprofiles collected for the specified time range, but none match the current\nfilters`.\n\nTo resolve this issue, try the following troubleshooting steps.\n\n- Make sure that the timespan and end time in the Profiler are inclusive of the job's elapsed time.\n\n- Confirm that the correct job is selected in the Profiler. The **Service** is your job name.\n\n- Confirm that the `job_name` pipeline option has the same value as the job name on the Dataflow job page.\n\n- If you specified a [service-name argument](/profiler/docs/profiling-python#svc-name-and-version) when you loaded the Profiler agent, confirm that the service name is configured correctly."]]