이 페이지에서는 Dataflow 모니터링 인터페이스의 실행 세부정보 탭을 사용하는 방법을 설명합니다.
개요
Dataflow가 작업을 실행하면 파이프라인의 단계가 스테이지로 변환됩니다. 각 단계는 개별 변환을 나타내는 반면, 스테이지는 Dataflow에서 실행되는 단일 작업 단위를 나타냅니다. 파이프라인을 최적화하기 위해 Dataflow는 여러 단계를 하나의 스테이지로 융합할 수 있습니다.
Dataflow 모니터링 인터페이스의 실행 세부정보 탭에는 작업의 스테이지에 관한 정보가 표시됩니다. 실행 세부정보 탭을 사용하여 다음과 같은 성능 문제를 해결할 수 있습니다.
- 성능 병목 현상을 일으키는 느린 스테이지
- 진행되지 않는 멈춘 스테이지
- 다른 작업자보다 뒤처지는 작업자 VM
실행 세부정보 보기
작업의 실행 세부정보를 보려면 다음 단계를 따르세요.
Google Cloud 콘솔에서 Dataflow > 작업 페이지로 이동합니다.
작업을 선택합니다.
실행 세부정보 탭을 클릭합니다.
다음 보기 중 하나를 선택합니다.
- 스테이지 진행 상황
- 스테이지 워크플로
- 작업자 진행 상황(일괄 작업만 해당)
다음 섹션에서는 이러한 각 뷰를 설명합니다.
스테이지 진행 상황 뷰
스테이지 진행 상황 뷰를 사용하면 작업의 전체 진행 상황을 관찰하고 스테이지 간의 상대적 진행 상황을 비교할 수 있습니다. 스테이지 진행 상황 뷰의 레이아웃은 일괄 작업과 스트리밍 작업 간에 다릅니다.
일괄 작업의 스테이지 진행 상황
일괄 작업의 경우 스테이지 진행 상황 뷰는 시작 시간 순으로 작업 스테이지를 보여줍니다. 각 스테이지에 대해 다음 요소가 표시됩니다.
- 정지 시간과 종료 시간을 보여주는 막대
- 시간 경과에 따른 스테이지 진행률을 해당 스테이지의 총 작업의 비율로 보여주는 선 차트
- 스테이지에서 보낸 총 시간
표시할 스테이지를 필터링하려면 스테이지 필터링을 클릭합니다. 중요 경로를 보려면 중요 경로를 전환합니다. 중요 경로는 전체 작업 런타임에 기여하는 스테이지의 시퀀스입니다. 예를 들어 전체 작업보다 앞서 완료된 브랜치와 다운스트림 처리를 지연시키지 않은 입력은 제외됩니다.
Stage Info 패널에는 스테이지에 대한 자세한 정보가 표시됩니다. 스테이지의 세부정보를 보려면 해당 스테이지의 진행률 표시줄을 클릭합니다. 스테이지 정보 패널에는 스테이지에 관한 다음 정보가 표시됩니다.
- 상태
- 진행률(백분율)
- 시작 시간 및 종료 시간
- 이 스테이지에 포함되는 파이프라인 단계
- 실제 경과 시간별 가장 느린 단계
- 낙오 항목에 관한 세부정보
패널이 표시되지 않으면 "스테이지 정보" 패널 전환을 클릭합니다.
스트리밍 작업의 스테이지 진행 상황
스트리밍 작업의 경우 스테이지 진행 상황 뷰에는 데이터 업데이트 빈도를 시각화한 두 가지가 있습니다. 데이터 최신 상태는 데이터 요소의 타임스탬프와 요소가 처리되는 시간 간의 차이입니다. 값이 클수록 파이프라인에서 입력 데이터를 처리하는 데 시간이 오래 걸립니다.
첫 번째 시각화는 스테이지별 데이터 최신 상태를 선 그래프로 보여줍니다. 특정 시점의 데이터 최신 상태를 확인하려면 그래프 위로 마우스를 가져갑니다. 기간을 선택하려면 시간 선택 도구를 사용하거나 그래프를 클릭하고 드래그하여 범위를 선택합니다. 표시할 스테이지를 필터링하려면 스테이지 필터링을 클릭합니다.
그래프에는 데이터의 이상치도 강조 표시됩니다.
- 잠재적 느림: 데이터 최신 상태가 선택한 기간의 95번째 백분위수를 초과합니다.
- 잠재적 중단: 데이터 최신 상태가 선택한 기간의 99번째 백분위수를 초과합니다.
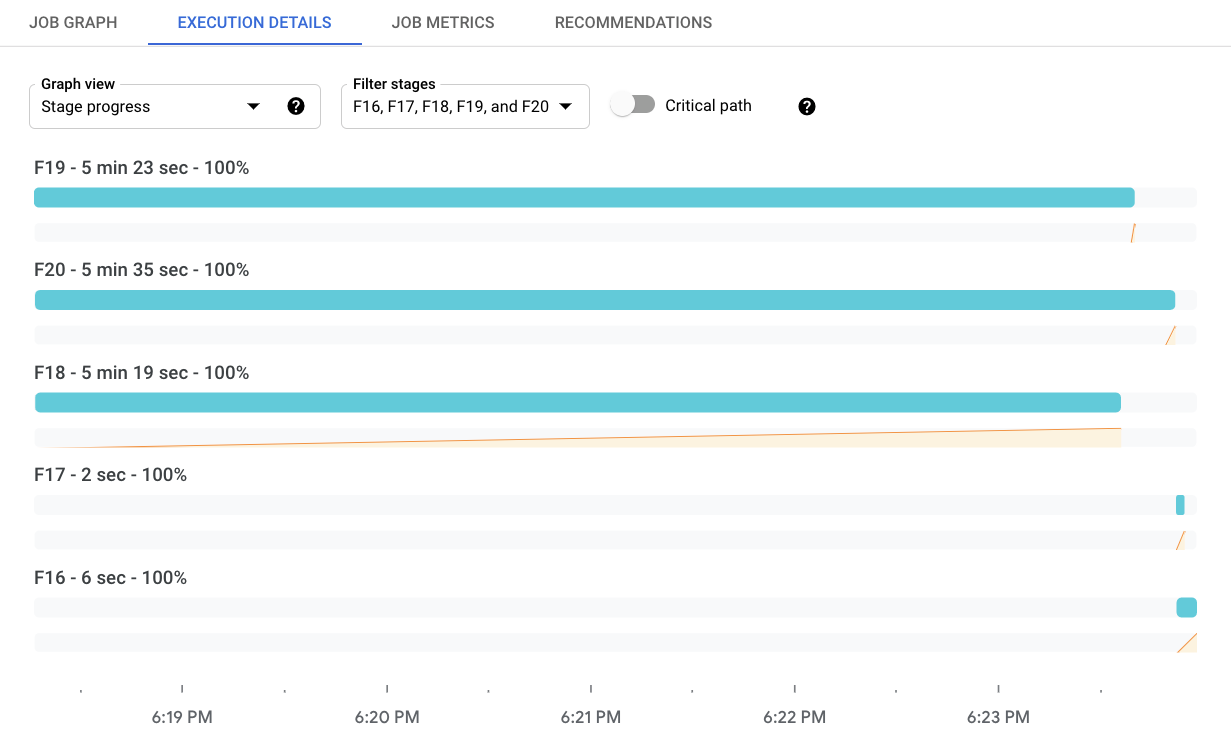
두 번째 시각화는 스테이지를 일련의 막대로 표시합니다. 스테이지는 토폴로지 순서로 정렬됩니다. 하위 항목이 없는 스테이지가 먼저 표시되고 그 뒤에 하위 항목이 표시됩니다. 막대의 길이는 데이터 최신 상태를 나타냅니다. 특정 시점의 데이터 최신 상태 값을 보려면 그래프를 클릭합니다. 막대가 업데이트되어 선택한 시간의 데이터 최신 상태를 표시합니다.
다음 이미지는 4 스테이지가 있는 작업을 보여줍니다. 선택한 타임스탬프에서 데이터 업데이트 빈도는 9초에서 13초 사이입니다.
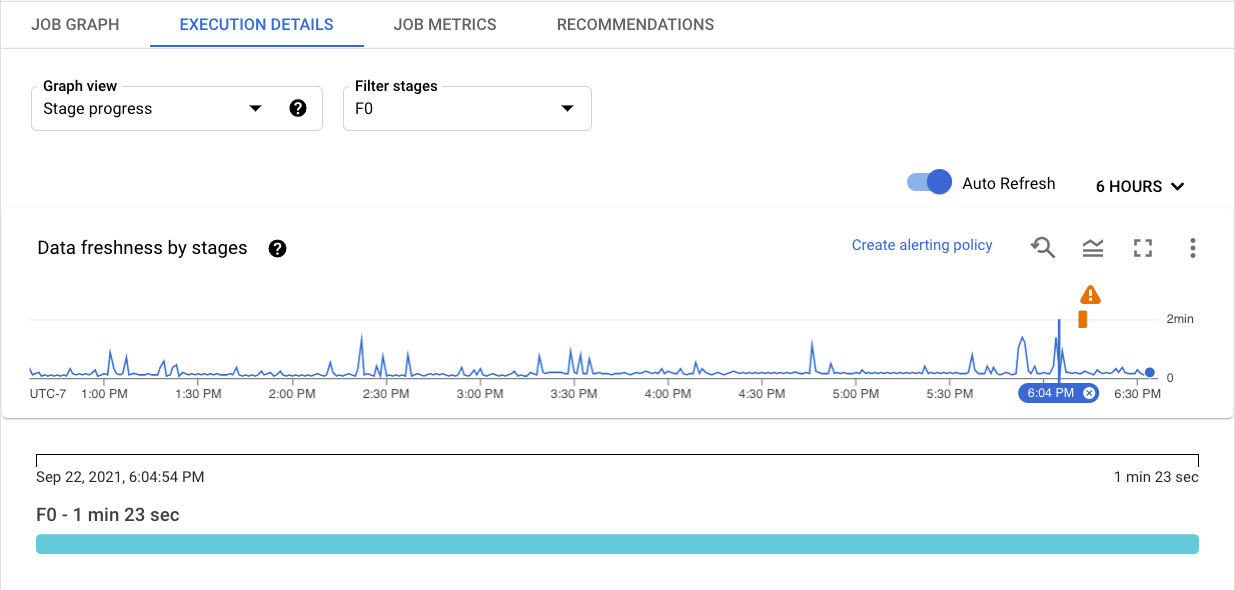
다음 이미지는 다른 타임스탬프가 선택된 동일한 작업을 보여줍니다. 이 시점에서 모든 스테이지의 데이터 업데이트 빈도가 4분을 초과하여 파이프라인이 멈췄을 수 있음을 나타냅니다.

Stage Info 패널에는 스테이지에 대한 자세한 정보가 표시됩니다. 스테이지의 세부정보를 보려면 해당 스테이지의 진행률 표시줄을 클릭합니다. 스테이지 정보 패널에는 스테이지에 관한 다음 정보가 표시됩니다.
- 상태
- 시스템 지연: 데이터 항목이 처리를 위해 대기한 최대 시간
- 데이터 워터마크: 이 스테이지의 데이터 입력 완료 예상 시간
- 낙오 항목에 관한 세부정보
- 이 스테이지에 포함되는 파이프라인 단계
패널이 표시되지 않으면 "스테이지 정보" 패널 전환을 클릭합니다.
단계 워크플로
스테이지 워크플로 뷰는 작업 스테이지를 워크플로 그래프로 표시합니다. 스테이지의 세부 정보를 보려면 해당 스테이지의 박스를 클릭합니다.
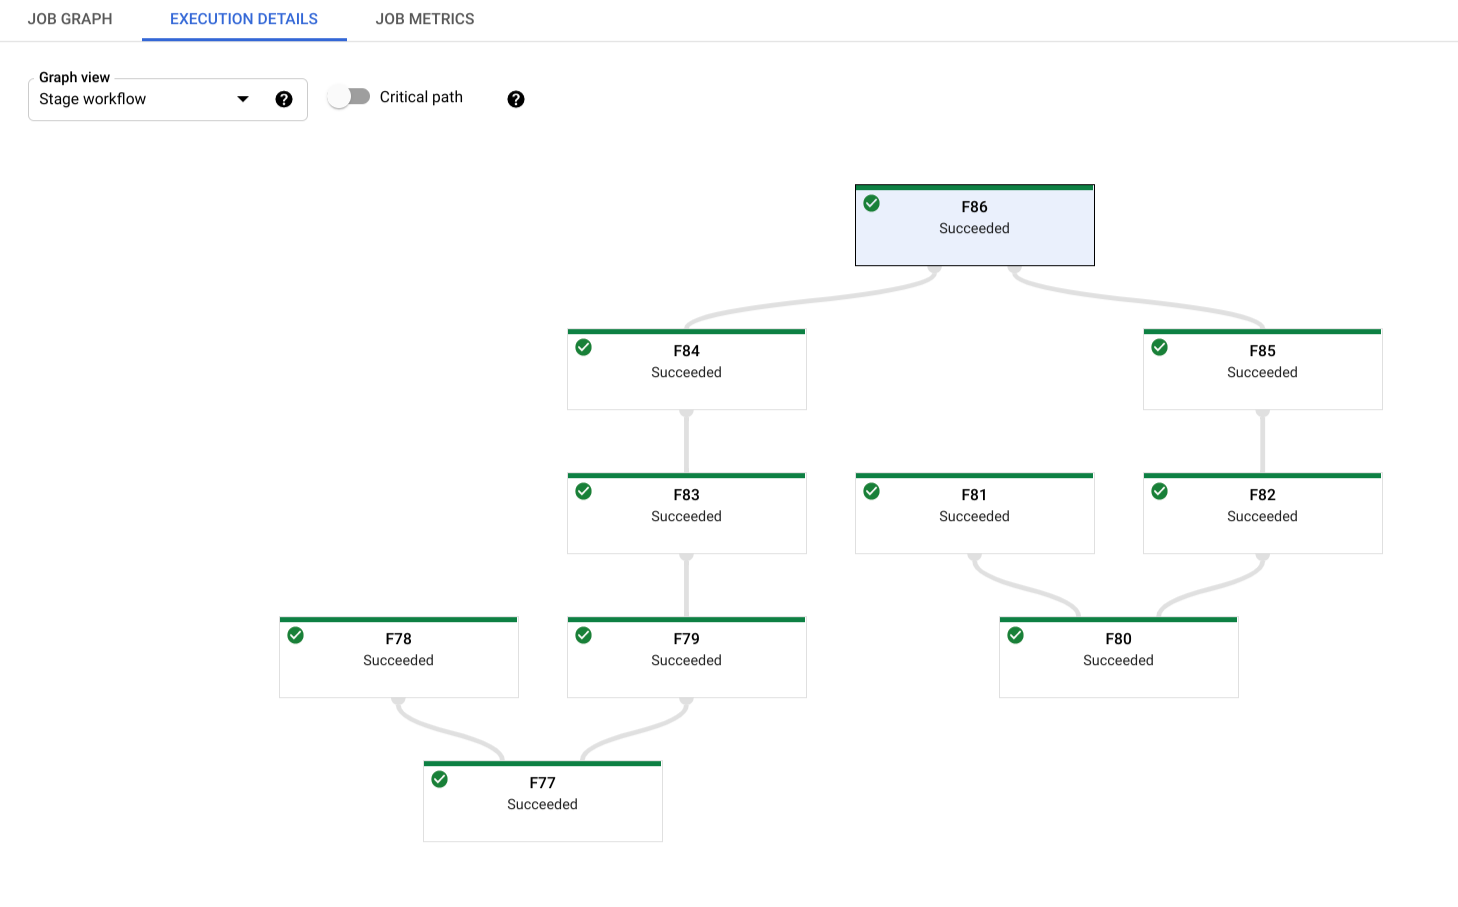
일괄 작업의 경우 중요 경로를 클릭하여 작업의 전체 런타임에 직접 기여하는 스테이지만 표시합니다.
작업자 진행 상황
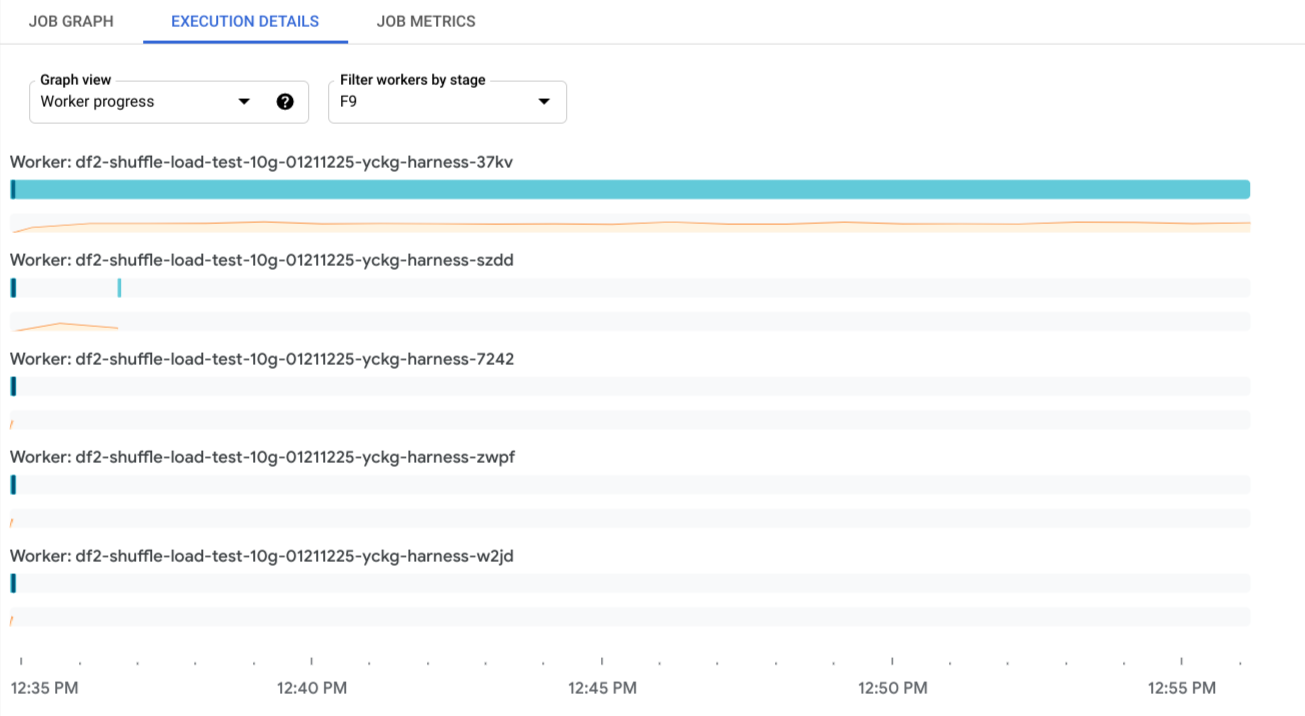
일괄 작업의 경우 작업자 진행 상황 뷰에 특정 스테이지의 작업자가 표시됩니다. 스트리밍 작업에서는 이 뷰를 사용할 수 없습니다. 이 뷰에 액세스하려면 작업자 진행 상황을 선택하고 스테이지별 작업자 필터링에서 스테이지를 선택합니다. 또는 다음과 같이 스테이지 진행 상황 뷰에서 이 뷰를 활성화할 수 있습니다.
- 스테이지 진행 뷰에서 확인하려는 스테이지를 식별합니다.
- 해당 스테이지의 막대 위로 마우스를 가져갑니다.
- 스테이지 카드에서 작업자 보기를 클릭합니다. 스테이지가 미리 선택된 작업자 진행 상황 뷰가 표시됩니다.
각 막대는 작업자에 예약된 작업 항목에 매핑됩니다. 각 작업자에 있는 작업자에서 CPU 사용률을 추적하는 스파크라인이 표시되므로 사용률 저하 문제를 쉽게 찾을 수 있습니다.
다음 단계
- Dataflow 파이프라인 문제 해결에 대해 자세히 알아보기
- Dataflow의 웹 기반 모니터링 사용자 인터페이스의 다양한 구성요소 알아보기