Google Cloud Audit Logging now available across the GCP stack
Joe Corkery, M.D.
Director of Product Management, Healthcare & Life Sciences, Google Cloud
Google Cloud Audit Logging helps you to determine who did what, where and when on Google Cloud Platform (GCP). This fall, Cloud Audit Logging became generally available for a number of products. Today, we’re significantly expanding the set of products integrated with Cloud Audit Logging:
- Google Compute Engine
- Google Container Engine
- Google Cloud Dataproc
- Google Cloud Deployment Manager
- Google Cloud DNS
- Google Cloud Key Management Service (KMS)
- Google Cloud Storage
- Google Cloud SQL
We’re also pleased to announce that audit logging for Google Cloud Dataflow, Stackdriver Debugger and Stackdriver Logging is now generally available.
Cloud Audit Logging provides log streams for each integrated product. The primary log stream is the admin activity log that contains entries for actions that modify the service, individual resources or associated metadata. Some services also generate a data access log that contains entries for actions that read metadata as well as API calls that access or modify user-provided data managed by the service. Right now only Google BigQuery generates a data access log, but that will change soon.
Interacting with audit logs in Cloud Console
You can see a high-level overview of all your audit logs on the Cloud Console Activity page. Click on any entry to display a detailed view of that event, as shown below.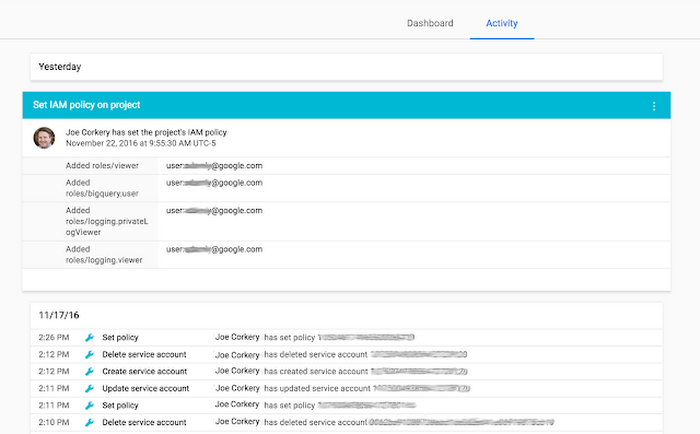

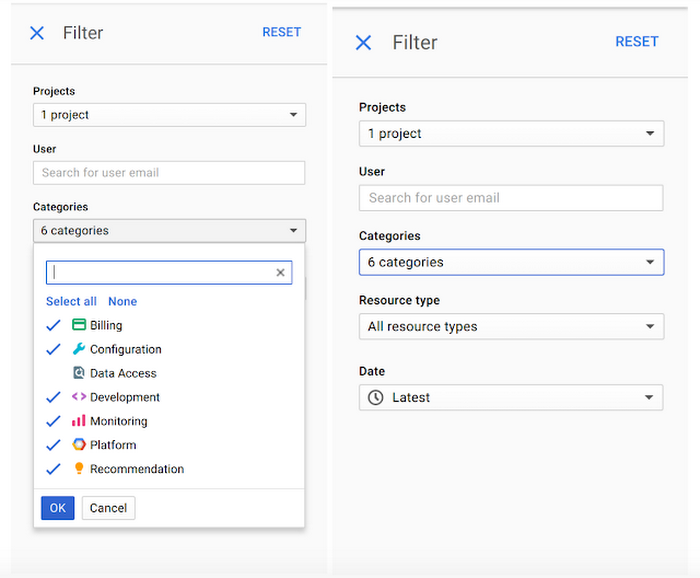
By default, data access logs are not displayed in this feed. To enable them from the Filter configuration panel, select the “Data Access” field under Categories. (Please note, you also need to have the Private Logs Viewer IAM permission in order to see data access logs). You can also filter the results displayed in the feed by user, resource type and date/time.

Interacting with audit logs in Stackdriver
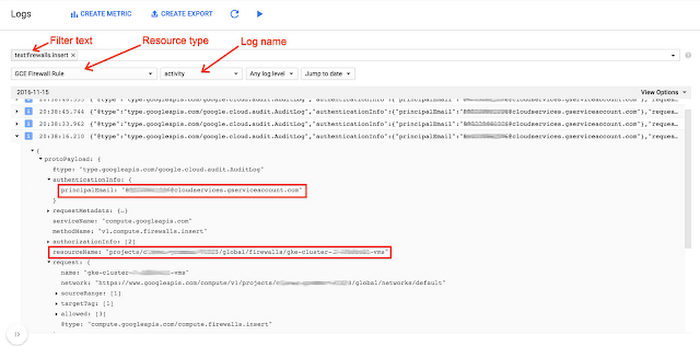
You can also interact with the audit logs just like any other log in the Stackdriver Logs Viewer. With Logs Viewer, you can filter or perform free text search on the logs, as well as select logs by resource type and log name (“activity” for the admin activity logs and “data_access” for the data access logs).Here are some log entries in their JSON format, with a few important fields highlighted.

In addition to viewing your logs, you can also export them to Cloud Storage for long-term archival, to BigQuery for analysis, and/or Google Cloud Pub/Sub for integration with other tools. Check out this tutorial on how to export your BigQuery audit logs back into BigQuery to analyze your BigQuery spending over a specified period of time.
Google Cloud Audit Logs couldn't be simpler to use; exported to BigQuery it provides us with a powerful way to monitor all our applications from one place.
— Darren Cibis, Shine Solutions
Partner integrations
We understand that there are many tools for log analysis out there. For that reason, we’ve partnered with companies like Splunk, Netskope, and Tenable Network Security. If you don’t see your preferred provider on our partners page, let us know and we can try to make it happen.Alerting using Stackdriver logs-based metrics
Stackdriver Logging provides the ability to create logs-based metrics that can be monitored and used to trigger Stackdriver alerting policies. Here’s an example of how to set up your metrics and policies to generate an alert every time an IAM policy is changed.The first step is to go to the Logs Viewer and create a filter that describes the logs for which you want to be alerted. Be sure that the scope of the filter is set correctly to search the logs corresponding to the resource in which you are interested. In this case, let’s generate an alert whenever a call to SetIamPolicy is made.


Once you're satisfied that the filter captures the correct events, create a logs-based metric by clicking on the "Create Metric" option at the top of the screen.
Now, choose a name and description for the metric and click "Create Metric." You should then receive a confirmation that the metric was saved.


Next, select “Logs-based Metrics” from the side panel. You should see your new metric listed there under “User Defined Metrics.” Click on the dots to the right of your metric and choose "Create alert from metric."
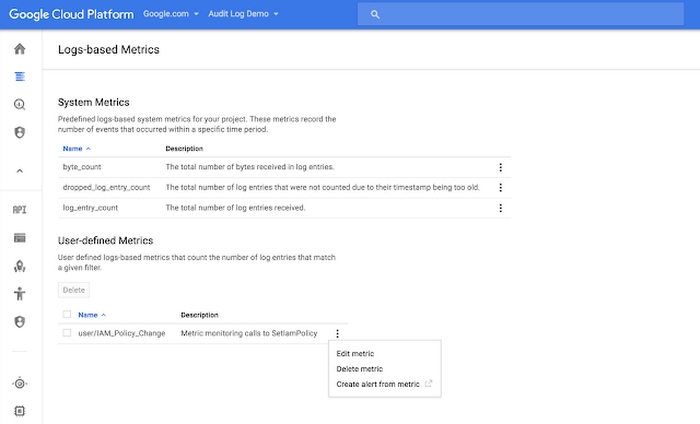

Now, create a condition to trigger an alert if any log entries match the previously specified filter. To do that, set the threshold to "above 0" in order to catch this occurrence. Logs-based metrics count the number of entries seen per minute. With that in mind, set the duration to one minute as the duration specifies how long this per-minute rate needs to be sustained in order to trigger an alert. For example, if the duration were set to five minutes, there would have to be at least one alert per minute for a five-minute period in order to trigger the alert.
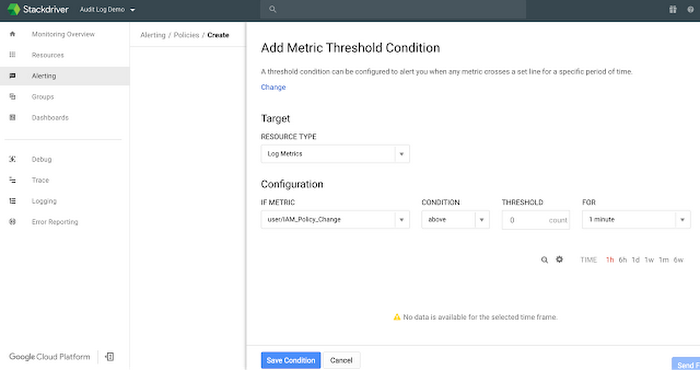

Finally, choose “Save Condition” and specify the desired notification mechanisms (e.g., email, SMS, PagerDuty, etc.). You can test the alerting policy by giving yourself a new permission via the IAM console.
Responding to audit logs using Cloud Functions
Cloud Functions is a lightweight, event-based, asynchronous compute solution that allows you to execute small, single-purpose functions in response to events such as specific log entries. Cloud functions are written in JavaScript and execute in a standard Node.js environment. Cloud functions can be triggered by events from Cloud Storage or Cloud Pub/Sub. In this case, we'll trigger cloud functions when logs are exported to a Cloud Pub/Sub topic. Cloud Functions is currently in alpha, please sign up to request enablement for your project.
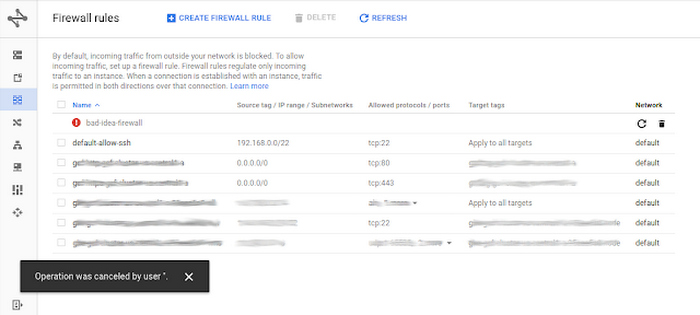
Let’s look at firewall rules as an example. Whenever a firewall rule is created, modified or deleted, a Compute Engine audit log entry is written. The firewall configuration information is captured in the request field of the audit log entry. The following function inspects the configuration of a new firewall rule and deletes it if that configuration is of concern (in this case, if it opens up any port besides port 22). This function could easily be extended to look at update operations as well.
As the function above uses the gcloud Node.js module, be sure to include that as a dependency in the package.json file that accompanies the index.js file specifying your source code:
In the image below, you can see what happened to a new firewall rule (“bad-idea-firewall”) that did not meet the acceptable criteria as determined by the cloud function. It's important to note, that this cloud function is not applied retroactively, so existing firewall rules that allow traffic on ports 80 and 443 are preserved.

This is just one example of many showing how you can leverage the power of Cloud Functions to respond to changes on GCP.
