App Engine 앱을 Cloud Logging과 통합할 수 있습니다.
이 접근 방식을 사용하면 Google 관련 코드 몇 줄만으로 Cloud Logging에서 제공하는 모든 기능을 사용할 수 있습니다.
stdout 및 stderr에 구조화된 로그 작성
기본적으로 App Engine은 Cloud Logging 클라이언트 라이브러리를 사용하여 로그를 전송합니다.
그러나 이 메서드는 구조화된 로깅을 지원하지 않습니다. stdout/stderr을 사용하여 구조화된 로그만 쓸 수 있습니다. 또한 stdout 및 stderr에 텍스트 문자열을 보낼 수도 있습니다. 기본적으로 로그 페이로드는 로그 항목의 textPayload 필드에 저장되는 텍스트 문자열입니다. 문자열은 로그 탐색기, 명령줄, Cloud Logging API에 메시지로 표시되며 이를 출력한 App Engine 서비스와 버전과 연결됩니다.
로그 탐색기에서 이러한 문자열을 심각도 수준으로 필터링하면 로그를 더 유용하게 활용할 수 있습니다. 이러한 문자열을 필터링하려면 문자열의 형식을 구조화된 데이터로 지정해야 합니다.
이를 위해 한 줄로 직렬화된 JSON 형식으로 로그를 작성합니다. App Engine은 이 직렬화된 JSON 줄을 수집하고 파싱하여 textPayload 대신 로그 항목의 jsonPayload 필드에 배치합니다.
App Engine 표준 환경에서 stdout 및 stderr에 구조화된 로그를 작성하는 작업은 Cloud Logging API의 분당 로그 수집 요청 할당량에 포함되지 않습니다.
메시지의 특수 JSON 필드
구조화된 로그를 JSON 사전으로 제공하면 일부 특수 필드가 jsonPayload에서 삭제되고 특수 필드 문서에 설명된 대로 생성된 LogEntry의 해당 필드에 작성됩니다.
예를 들어 JSON에 severity 속성이 포함되어 있으면 이 속성은 jsonPayload에서 삭제되고 대신 로그 항목의 severity로 표시됩니다.
message 속성이 있으면 이 속성은 로그 항목의 기본 표시 텍스트로 사용됩니다.
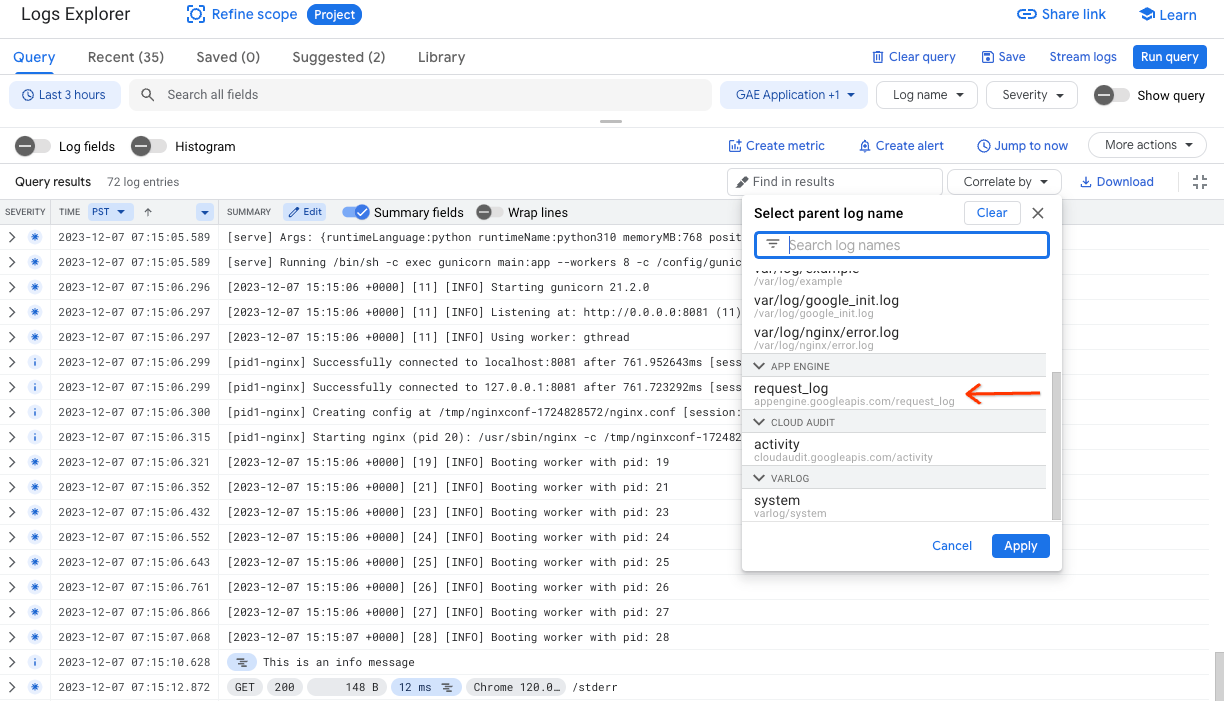
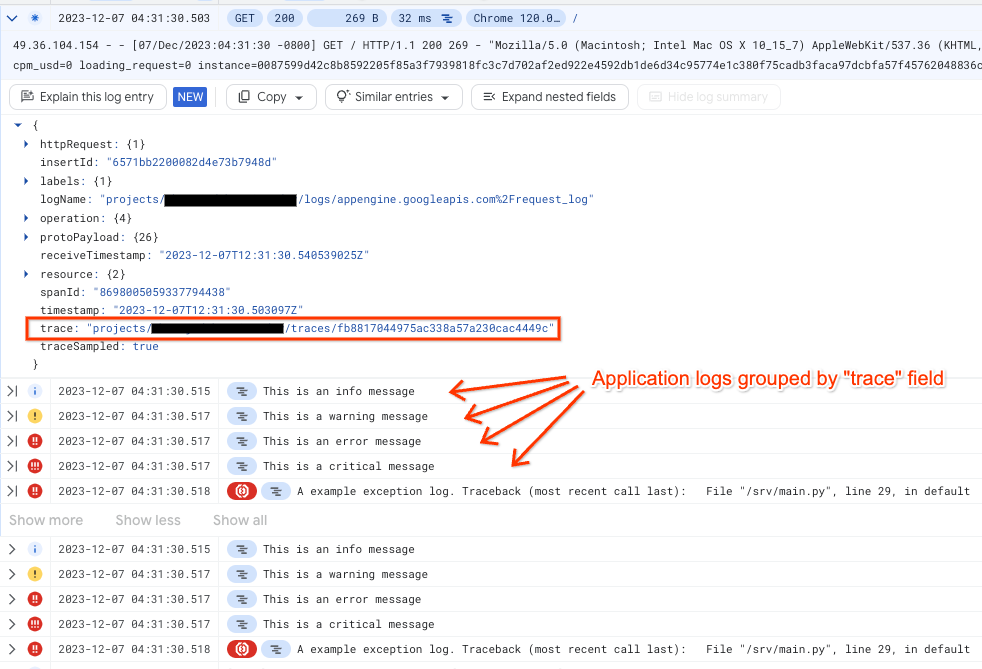
요청 로그와 앱 로그의 상관관계
항목의 형식을 JSON 객체로 지정하고 특정 메타데이터를 제공한 후 요청 로그 필터링 및 상관관계를 사용 설정할 수 있습니다.
요청 로그 항목과 앱 로그 항목의 상관관계를 지정하려면 요청의 trace 식별자가 필요합니다. 안내에 따라 로그 메시지의 상관관계를 지정합니다.
X-Cloud-Trace-Context 요청 헤더에서 trace 식별자를 추출합니다.
구조화된 로그 항목에서 logging.googleapis.com/trace라는 필드에 ID를 작성합니다.
X-Cloud-Trace-Context 헤더에 대한 자세한 내용은 요청을 강제로 추적을 참조하세요.
로그 싱크에서 Cloud Storage로 로그를 라우팅하면 Cloud Storage 대상에 요청 로그만 포함됩니다. App Engine은 앱 로그를 다른 폴더에 작성합니다.
요청 로그의 @type 입력란으로 인해 BigQuery에서 로그를 수집하지 못합니다. BigQuery에서 필드 이름에 @type을 허용하지 않기 때문에 자동 스키마 감지가 중단됩니다. 이 문제를 해결하려면 스키마를 수동으로 정의하고 요청 로그에서 @type 입력란을 삭제해야 합니다.
로깅 REST API를 사용하는 경우 백그라운드 스레드가 로그를 Cloud Logging에 작성합니다.
기본 스레드가 활성 상태가 아니면 인스턴스가 CPU 시간을 얻지 못하여 백그라운드 스레드가 중지됩니다. 로그 처리 시간이 지연됩니다. 어느 시점에서 인스턴스가 삭제되고 전송되지 않은 로그는 손실됩니다. 로그가 손실되지 않도록 하려면 다음 옵션 중 하나를 사용하세요.
gRPC를 사용하도록 Cloud Logging SDK를 구성합니다. gRPC를 사용하면 로그가 즉시 Cloud Logging으로 전송됩니다. 하지만 이로 인해 필요한 CPU 한도가 늘어날 수 있습니다.
stdout/stderr을 사용하여 Cloud Logging에 로그 메시지를 전송합니다. 이 파이프라인은 App Engine 인스턴스 외부에 있으며 제한되지 않습니다.
다음 단계
지연 시간 모니터링 및 알림을 참조하여 Cloud Logging을 사용하여 로그에서 디버깅 오류 로그를 확인하는 방법과 Cloud Trace를 사용하여 앱 지연 시간을 파악하는 방법을 알아보세요.
[[["이해하기 쉬움","easyToUnderstand","thumb-up"],["문제가 해결됨","solvedMyProblem","thumb-up"],["기타","otherUp","thumb-up"]],[["이해하기 어려움","hardToUnderstand","thumb-down"],["잘못된 정보 또는 샘플 코드","incorrectInformationOrSampleCode","thumb-down"],["필요한 정보/샘플이 없음","missingTheInformationSamplesINeed","thumb-down"],["번역 문제","translationIssue","thumb-down"],["기타","otherDown","thumb-down"]],["최종 업데이트: 2025-05-01(UTC)"],[[["\u003cp\u003eApp Engine automatically collects request logs for each HTTP request and app logs based on entries written to supported frameworks or files.\u003c/p\u003e\n"],["\u003cp\u003eApp logs can be written using Cloud Logging integration or by writing structured logs to \u003ccode\u003estdout\u003c/code\u003e and \u003ccode\u003estderr\u003c/code\u003e, allowing for structured data in the \u003ccode\u003ejsonPayload\u003c/code\u003e field.\u003c/p\u003e\n"],["\u003cp\u003eTo correlate request and app logs, extract the trace identifier from the \u003ccode\u003eX-Cloud-Trace-Context\u003c/code\u003e header and include it in the \u003ccode\u003elogging.googleapis.com/trace\u003c/code\u003e field of your structured log entry.\u003c/p\u003e\n"],["\u003cp\u003eLogs can be viewed in the Logs Explorer by selecting "GAE Application" as the resource type, or via the Google Cloud CLI using the \u003ccode\u003egcloud app logs tail\u003c/code\u003e command, and programmatically using several methods.\u003c/p\u003e\n"],["\u003cp\u003eLog management includes controlling log activity from the app, using log exclusions for request logs, and understanding the pricing, quotas, and retention policies for Cloud Logging.\u003c/p\u003e\n"]]],[],null,["# Write and view logs\n\n\u003cbr /\u003e\n\n\u003cbr /\u003e\n\n\nGo Java Node.js PHP Python Ruby\n\nThis page describes the logs that are available for App Engine apps, and\nhow to write, correlate, and view log entries.\n\nApp Engine collects two types of logs:\n\n- **Request log:** Logs of requests sent to your app. By default, App Engine\n automatically emits a log entry for each HTTP request an app receives.\n\n- **App log:** Log entries that are emitted by an App Engine app\n based on the log entries you write to a supported framework or file.\n\nApp Engine automatically sends both the request logs and app logs to the\n[Cloud Logging](/logging/docs/overview) agent.\n\n\nWrite app logs\n--------------\n\nApp Engine automatically emits logs for requests sent to your app, so\nthere is no need to write request logs. This section covers how to write app logs.\n\nWhen you write app logs from your App Engine app, the logs are picked up\nautomatically by Cloud Logging, as long as the logs are written using the\nfollowing methods:\n\n- [Integrate with Cloud Logging](#integrate_logging)\n- [Write structured logs with `stdout` and `stderr`](#stdout_stderr)\n\n\u003cbr /\u003e\n\n### Integrate with Cloud Logging\n\nYou can integrate your App Engine app with Cloud Logging.\nThis approach lets you use all the features offered by Cloud Logging and requires\nonly a few lines of Google-specific code.\n\n\n| **Important:** The Logs Explorer does not display an app log entry that exceeds 16 kilobytes.\n\n### Write structured logs to `stdout` and `stderr`\n\nBy default, App Engine uses the Cloud Logging client library to send logs.\nHowever, this method doesn't support structured logging. You can only write\nstructured logs using `stdout/stderr`. Additionally, you can also send text strings to\n`stdout` and `stderr`. By default, the log payload is a\ntext string stored in the `textPayload` field of the log entry. The strings\nappear as messages in the Logs Explorer, the command line, and the\nCloud Logging API, and are associated with the App Engine service\nand version that emitted them.\n\nTo get more value from the logs, you can filter these strings in the Logs Explorer\nby severity level. To filter these strings, you need to format the strings as\n[**structured data**](/logging/docs/structured-logging).\nTo do this, you write logs in the form of a single\nline of serialized JSON. App Engine picks up and parses this serialized JSON line,\nand places it into the `jsonPayload` field of the log entry instead of `textPayload`.\n\n\u003cbr /\u003e\n\nIn the App Engine standard environment, writing structured logs to `stdout` and `stderr`\ndon't count against the log ingestion requests per minute quota in the Cloud Logging API.\n\n\n### Special JSON fields in messages\n\nWhen you provide a structured log as a JSON dictionary, some special fields are\nstripped from the `jsonPayload` and are written to the corresponding field in\nthe generated\n[LogEntry](/logging/docs/reference/v2/rest/v2/LogEntry) as described in\nthe documentation for [special fields](/logging/docs/agent/configuration#special-fields).\n\nFor example, if your JSON includes a `severity` property, it is removed from\nthe `jsonPayload` and appears instead as the log entry's `severity`.\nThe `message` property is used as the main display text of the log entry if present.\n\n\u003cbr /\u003e\n\n### Correlate request logs with app logs\n\n\nAfter you've [formatted the entries as a JSON object](#stdout_stderr) and provided\nspecific metadata, you can enable filtering and correlation with request logs.\nTo correlate the request log entries with the app log entries, you need the request's\ntrace identifier. Follow the instructions to correlate log messages:\n\n1. Extract the trace identifier from the `X-Cloud-Trace-Context` request header.\n2. In your structured log entry, write the ID to a field named `logging.googleapis.com/trace`. For more information about the `X-Cloud-Trace-Context` header, see [Forcing a request to be traced](/trace/docs/setup#force-trace).\n\nTo view correlated logs, see [View correlated log entries in the Logs Explorer](#view_correlated_logs).\n\n\nView logs\n---------\n\nYou can view app logs and request logs in several ways:\n\n- [Use Logs Explorer](#logs_explorer) from Cloud Logging in the Google Cloud console.\n- [Use the Google Cloud CLI](#cli) to view logs using gcloud.\n- [Read logs programmatically](#read-programmatically) using various methods.\n\n### Use Logs Explorer\n\nYou can view your app and request logs using the\n[Logs Explorer](/logging/docs/view/logs-explorer-interface):\n\n1. Go to **Logs Explorer** in the Google Cloud console:\n\n [Go to Logs Explorer](https://console.cloud.google.com/logs/query)\n2. Select an existing Google Cloud project at the top of the page.\n\n3. In **Resource Type** , select **GAE Application**.\n\nYou can filter the Logs Explorer by App Engine service, version and\nother criteria. You can also search the logs for specific entries.\nSee [Using the Logs Explorer](/logging/docs/view/logs-explorer-interface)\nfor details.\n\nIf you send simple text entries to standard output, you cannot use the Logs\nViewer to filter app entries by severity, nor can you see which app logs\ncorrespond to specific requests. You can still use other types of filtering\nin the Logs Explorer, such as text and timestamp.\n\n### View correlated log entries in the Logs Explorer\n\nIn the Logs Explorer, to view the child log entries correlated with a parent\nlog entry, expand the log entry.\n\nFor example, to display your App Engine request log entry and application log\nentries, do the following:\n\n1. In the navigation panel of the Google Cloud console, select\n **Logging** , and then select **Logs Explorer**:\n\n [Go to Logs Explorer](https://console.cloud.google.com/logs/query)\n2. In **Resource Type** , select **GAE Application**.\n\n3. To view and correlate request logs, in **Log Name** , select **request_log** . Alternatively,\n to correlate by request logs, click **Correlate by** and select **request_log**.\n\n4. In the **Query results** pane, to expand a log entry,\n click **Expand**. On expanding, each request log\n will show the associated app logs.\n\nAfter creating a filter for the logs, each request log shows corresponding\napp logs as child logs. Logs Explorer achieves this by correlating\nthe `trace` field in app logs and a given request log, assuming the application\nuses the `google-cloud-logging` library.\n\nThe following image shows app logs grouped by the `trace` field:\n\n### Use the Google Cloud CLI\n\nTo view your App Engine logs from the command line, use the\nfollowing command: \n\n```bash\ngcloud app logs tail\n```\n\nFor more information, see [gcloud app logs tail](/sdk/gcloud/reference/app/logs/tail).\n\n### Reading logs programmatically\n\nIf you want to read the logs programmatically, you can use one of these methods:\n\n- Use a [log sink to Pub/Sub and a script to pull from Pub/Sub](/logging/docs/export).\n- Call the Cloud Logging API through the [client library](/logging/docs/reference/libraries) for your programming language.\n- Call the [Cloud Logging API REST endpoints](/logging/docs/reference/v2/rest) directly.\n\nPricing, quotas, and logs retention policy\n------------------------------------------\n\nFor information about pricing that applies to both request and app logs, see\n[Pricing for Cloud Logging](/logging/pricing#logging-costs).\n\nFor the logs retention policy and the maximum size of log entries, see [Quotas\nand limits](/logging/quotas). If you want to store your logs for a longer\nperiod, you can [export your logs](/logging/docs/export) to Cloud Storage.\nYou can also export your logs to BigQuery and Pub/Sub for\nfurther processing.\n\n### Managing log resource usage\n\nYou can control the amount of logging activity from your app logs by writing\nmore or fewer entries from your app's code. Request logs are created\nautomatically, so to manage the number of request log entries associated with\nyour app, Use the [logs exclusion](/logging/docs/exclusions#overview) feature\nfrom Cloud Logging.\n\nKnown issues\n------------\n\nThe following are some logging issues in the second-generation runtimes:\n\n- Sometimes app log entries are not correlated with the request log. This\n happens the first time your app receives a request and any other time\n App Engine writes status messages to your app's log. For more\n information, see\n \u003chttps://issuetracker.google.com/issues/138365527\u003e.\n\n- When you route logs from log sink to Cloud Storage, the Cloud Storage\n destination only contains request logs. App Engine writes app logs to\n different folders.\n\n- BigQuery fails to ingest logs due to the `@type` field in request logs. This\n disrupts the auto-schema detection, since BigQuery doesn't allow `@type` in field\n names. To resolve this, you must manually define the schema, and remove the\n `@type` field from request logs.\n\n- If you use the logging REST APIs, a background thread writes logs to Cloud Logging.\n If the main thread isn't active, the instance doesn't get CPU time, which causes\n the background thread to stop. Log processing time is delayed. At\n some point, the instance is removed and any unsent logs are lost. To avoid losing logs, use one of the following options:\n\n - Configure the Cloud Logging SDK to use gRPC. With gRPC, the logs are sent to Cloud Logging immediately. However this can increase the required CPU limits.\n - Send log messages to Cloud Logging using `stdout/stderr`. This pipeline is outside the App Engine instance and doesn't get throttled.\n\nWhat's next\n-----------\n\n- See [Monitor and alert latency](/appengine/docs/standard/monitoring-and-alerting-latency) to learn how to use Cloud Logging to view logs for debugging errors, and how to use Cloud Trace to understand app latency."]]