You're viewing Apigee and Apigee hybrid documentation.
There is no equivalent
Apigee Edge documentation for this topic.
Symptom
In some cases, external clients are not able to access/connect to Apigee in a desired manner. These include either network connectivity failures (TLS handshake fails) or 4xx/5xx responses from Apigee.
Error message
When sending an API request from your Client to Apigee, you see TLS
handshake failure or a 4xx/5xx response even though the API
proxies might seem healthy in the Apigee UI.
Possible causes
| Cause | Description | Error codes |
|---|---|---|
| TLS errors at HTTPS load balancer | You manage the TLS configuration of the HTTPS load balancer. Investigate any TLS errors in the HTTPS load balancer logs. | TLS handshake errors from the load balancer IP address |
| Google Cloud Armor blocking the requests | If you're using Google Cloud Armor, there may be a rule blocking the request. |
API response code may vary based on Google Cloud Armor
configuration. Deny rules can return an HTTP 403
(Unauthorized), 404 (Access Denied), or 502
(Bad Gateway) response or even another response code.
|
| Apigee proxy VMs are unable to forward the traffic to Apigee instance | The Apigee API traffic router proxy configuration and its health need to be investigated | 502 Server Error |
| Incorrect network configuration | Ensure that the correct network is peered with Apigee VPC. | 502 Server error |
| Unattached environments on the new Apigee instance created as part of region expansion | After creating a new instance, for example a second region, you must attach environments to it, otherwise it cannot respond to API requests. | 503 error response |
Cause: TLS errors at HTTPS load balancer
Diagnosis
- Find the TLS certificate associated with the load balancer.
- Using the Google Cloud console:
-
In the Google Cloud console, go to the Load balancing page.
-
Click the load balancer Name. The Load balancer details page opens.
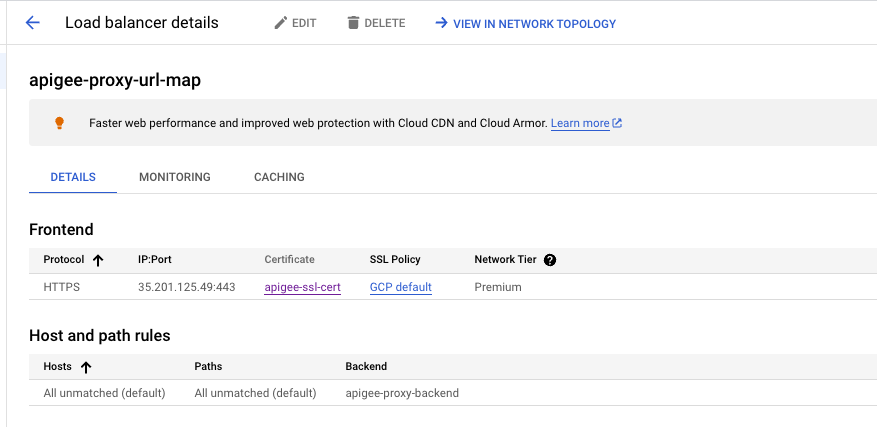
- In the Frontend area, in the IP:Port column, ensure that you are looking at the right load balancer by verifying its IP address and port.
- In the Certificate column, click the certificate name to view the TLS certificate.
-
-
Using a gcloud command:
-
List the load balancers with the following
gcloud command. This command also displays
SSL_CERTIFICATESassociated with each load balancer.gcloud compute target-https-proxies list --project=PROJECT_NAME
Replace
PROJECT_NAMEwith the name of your project.Something similar to the following is returned:
NAME: example-proxy-https-proxy
SSL_CERTIFICATES: example-ssl-cert
URL_MAP: example-proxy-url-map
REGION:
CERTIFICATE_MAP:
-
View the TLS certificate with the following
gcloud command (this assumes you have
jqor a similar tool installed on your machine):gcloud compute ssl-certificates describe CERTICATE_NAME \ --project PROJECT_NAME --format json | jq -r '.certificate' | openssl x509 -text -noout
Replace CERTIFICATE_NAME with the certificate name. For example,
example-ssl-cert.Something similar to the following is returned:
certCertificate:
    Data:
        Version: 3 (0x2)
        Serial Number:
            51:3b:a4:60:fe:49:34:a2:09:af:14:85:96:a2:4f:d9
        Signature Algorithm: sha256WithRSAEncryption
        Issuer: C = US, O = Google Trust Services LLC, CN = GTS CA 1D4
        Validity
            Not Before: Jul 11 11:51:52 2023 GMT
            Not After : Oct  9 12:44:45 2023 GMT
        Subject: CN = 34.149.207.105.nip.io
        Subject Public Key Info:
            Public Key Algorithm: rsaEncryption
                RSA Public-Key: (2048 bit)
                .
                .

                Exponent: 65537 (0x10001)
        X509v3 extensions:
            X509v3 Key Usage: critical
                Digital Signature, Key Encipherment
            X509v3 Extended Key Usage:
                TLS Web Server Authentication
            X509v3 Basic Constraints: critical
                CA:FALSE
            X509v3 Subject Key Identifier:
                A5:DB:7C:6A:8B:0B:7A:22:45:52:1E:85:29:32:77:18:A3:9D:87:76
            X509v3 Authority Key Identifier:
                keyid:25:E2:18:0E:B2:57:91:94:2A:E5:D4:5D:86:90:83:DE:53:B3:B8:92

            Authority Information Access:
                OCSP - URI:http://ocsp.pki.goog/s/gts1d4/qMhEcTt7LjA
                CA Issuers - URI:http://pki.goog/repo/certs/gts1d4.der

            X509v3 Subject Alternative Name:
                DNS:34.149.207.105.nip.io
            X509v3 Certificate Policies:
                Policy: 2.23.140.1.2.1
                Policy: 1.3.6.1.4.1.11129.2.5.3

            X509v3 CRL Distribution Points:

                Full Name:
                  URI:http://crls.pki.goog/gts1d4/LjtNmxrQfWE.crl
Make sure that the common name (CN) in the certificate matches the Hostname configured in Apigee > Admin > Environments > Groups. Ensure that the certificate is valid and not expired. You may use
opensslto perform these checks.
-
List the load balancers with the following
gcloud command. This command also displays
- Using the Google Cloud console:
-
To check the TLS certificate returned by the load balancer, run the
following
opensslcommand from your client machine. Check to see if this certificate matches the one returned in step 1 above.openssl s_client -connect LB_HOSTNAME_OR_IP:443 -servername LB_HOSTNAME -showcerts
Replace the following:
-
LB_HOSTNAME_OR_IP: the load balancer hostname or IP
address. For example,
my-load-balancer. -
LB_HOSTNAME: the load balancer hostname. For example,
my-hostname.
To verify that the certificates match, run the following command from your client:
echo | openssl s_client -connect HOST_NAME:443 -servername HOST_NAME | openssl x509 -noout -text | openssl md5
Replace HOST_NAME with the hostname configured in Apigee (Admin > Environments > Groups).
And then verify that the
md5matches by running the following gcloud command:gcloud compute ssl-certificates describe CERTIFICATE_NAME --project PROJECT_NAME --format json | jq -r '.certificate' | openssl x509 -noout -text | openssl md5
Replace CERTIFICATE_NAME with the name of the certificate. For example,
my-certificate -
LB_HOSTNAME_OR_IP: the load balancer hostname or IP
address. For example,
-
If the step 1 and step 2
certificates match (i.e., if
md5values match), then proceed to collect apacket captureon the client side to investigate the TLS handshake failure. You can take the packet capture on your client side with tools like Wireshark, tcpdump or any other reliable tools. - Enable logs on the load balancer by following the instructions in Enabling logging on an existing backend service.
- Review the load balancer logs for any errors.
Resolution
- If your self-managed certificate on the load balancer is expired or has incorrect CN/SAN values, you may need to replace the certificate on the load balancer.
-
If the certificate returned by load balancer in
step 1 and certificate in step 2
do not match, then it might mean that the load balancer is serving a
stale/incorrect certificate, and you should file a ticket with Google Cloud Customer Care.
-
If a
tcpdumpindicates a TLS handshake failure, investigate if the connection failure is coming from the load balancer or from the client side.- If the failure or connection reset is from the client side, then check your client application to understand why it is misbehaving. For example, you could check the network configuration on your client side or verify that the client application has connectivity with Apigee.
- If you see the failure/reset from load balancer itself, see Troubleshoot general connectivity issues and file a ticket with Google Cloud Customer Care if required.
- If you see errors in the load balancer logs, see Unexplained 5XX errors and file a ticket with Google Cloud Customer Care if required.
If you still require assistance, see Must gather diagnostic information.
Cause: Cloud Armor blocking the requests
Diagnosis
If you see a 403, 404 or a 502 error
response based on Cloud Armor
configuration, review the load balancer and MIG configuration to verify they
are configured correctly and appear healthy.
- If you're using Google Cloud Armor in your Google Cloud environment, review the Google Cloud Armor configuration for any rules that may be blocking the request. The security policies can be found in Configure Google Google Cloud Armor security policies.
- If you're not sure which rule is denying the traffic, you could try to enable logging at the load balancer as described in Enabling logging on an existing backend service.
-
Once logging is enabled, perform a logs query to find any requests blocked by Google Cloud Armor policies:
-
In the Google Cloud console, go to the Logs Explorer page.
-
Paste the following into the Query pane:
jsonPayload.enforcedSecurityPolicy.outcome="DENY"
- Click Run query.
-
The name of the enforced policy is displayed in
jsonPayload.enforcedSecurityPolicy.namein the Query results pane: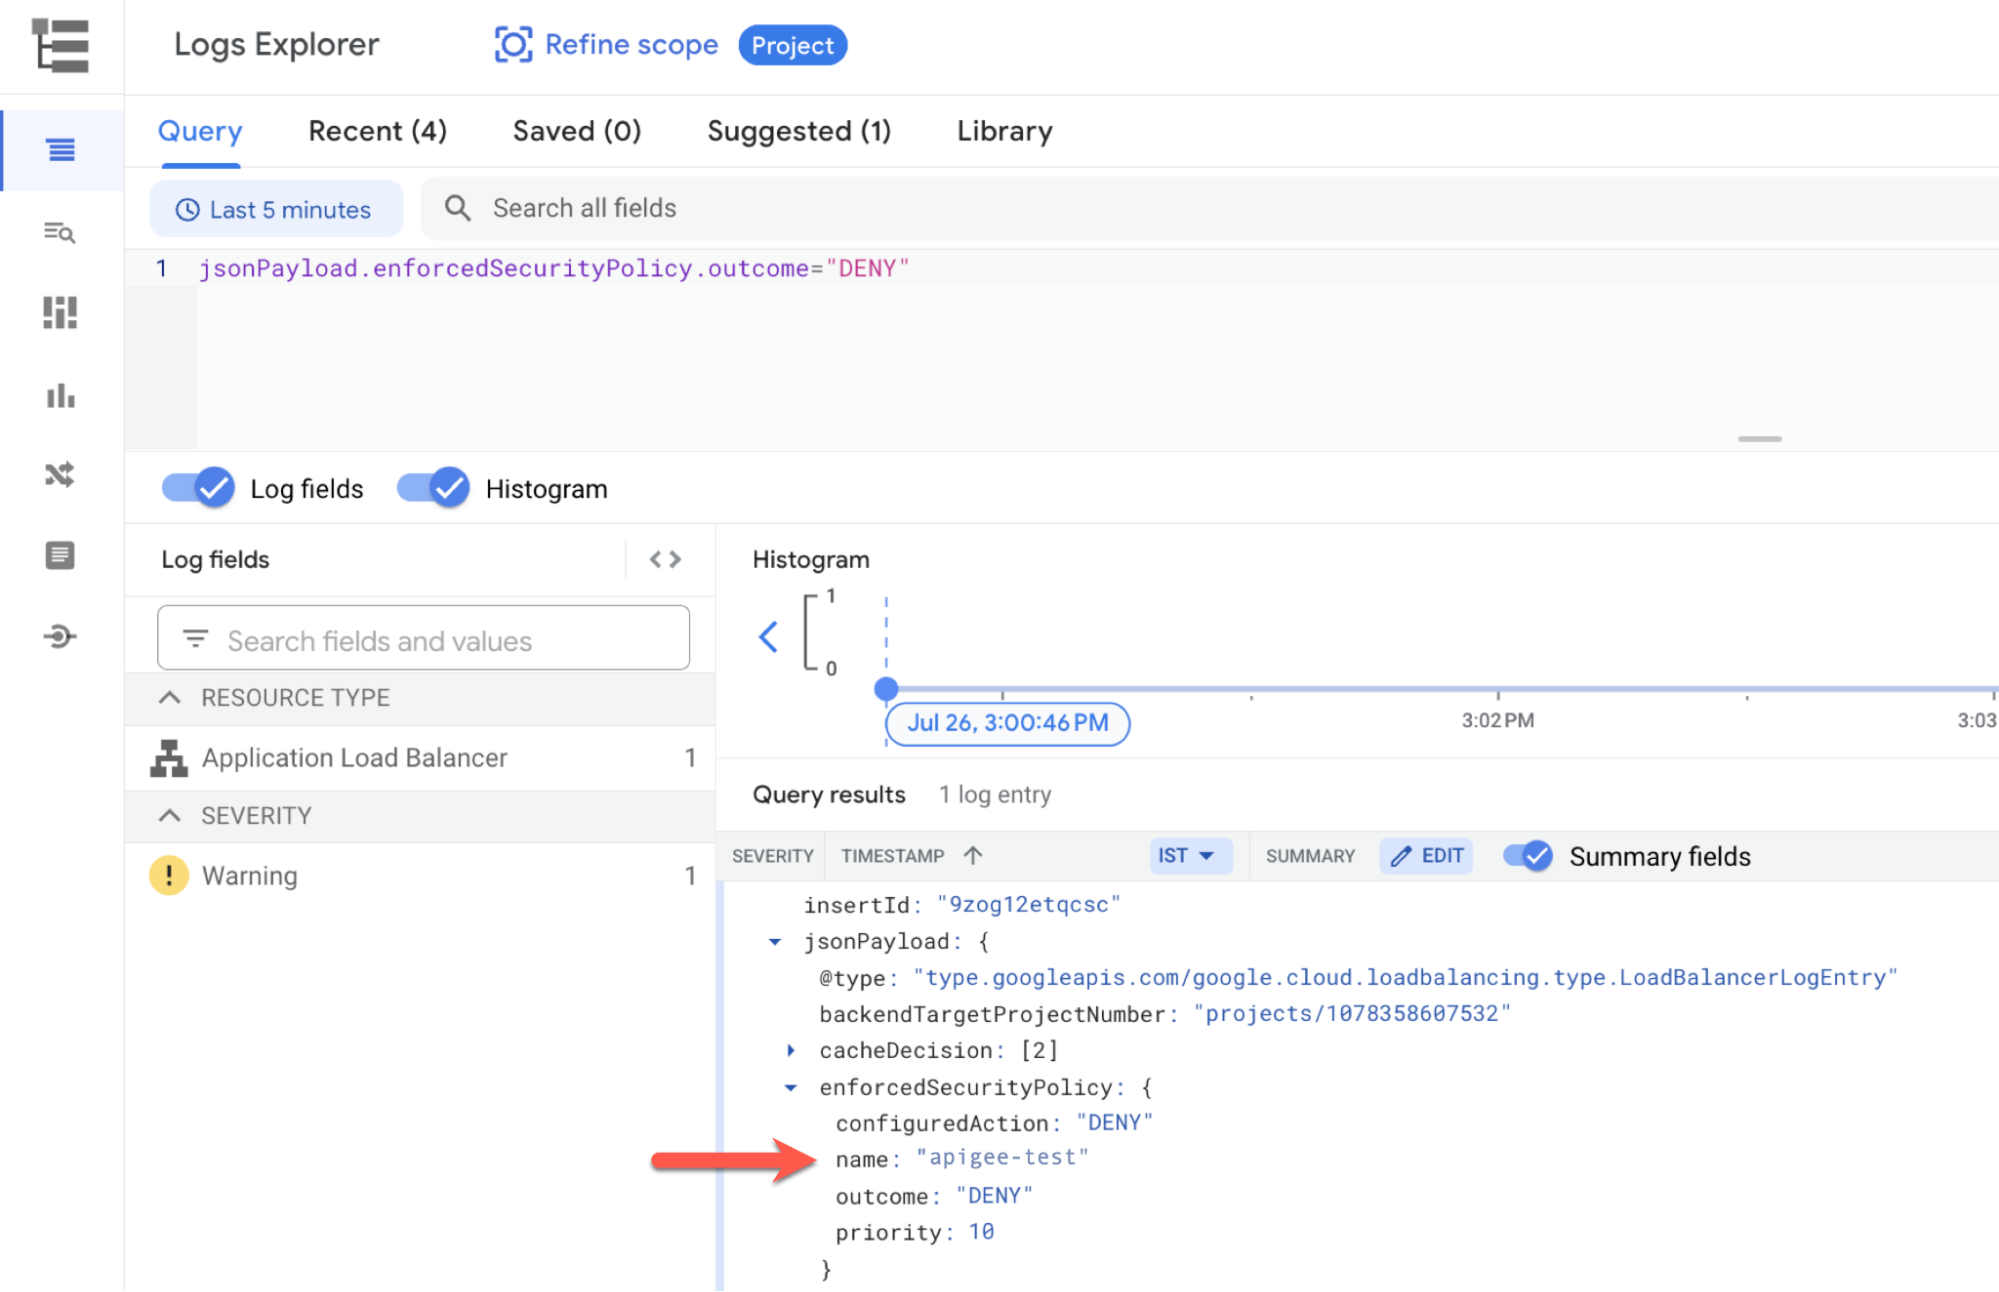
-
Resolution
Modify the Google Cloud Armor rules/configuration to align to your needs to resolve this issue. If you require assistance with this, reach out to Google Cloud Customer Care.
Cause: Apigee proxy VMs are unable to forward the traffic to Apigee instance
Diagnosis
-
If API clients receive
HTTP 502errors with the following error message, then the Apigee API traffic router proxy VMs might be in an unhealthy state.502errors such as the following may be received by the clients:<html><head> <meta http-equiv="content-type" content="text/html;charset=utf-8"> <title>502 Server Error</title> </head> <body text=#000000 bgcolor=#ffffff> <h1>Error: Server Error</h1> <h2>The server encountered a temporary error and could not complete your request.<p>Please try again in 30 seconds.</h2> <h2></h2> </body></html>
Review the load balancer logs for error messages such as the following:
statusDetails: "failed_to_pick_backend"
severity: "WARNING"
There are a set of VMs (with an
apigee-proxyprefix) running in a managed instance group (MIG) that forward the traffic to the Apigee instance. If you are seeing messages like the above, check the health of theapigee-proxyVMs part of the instance group through the following steps:-
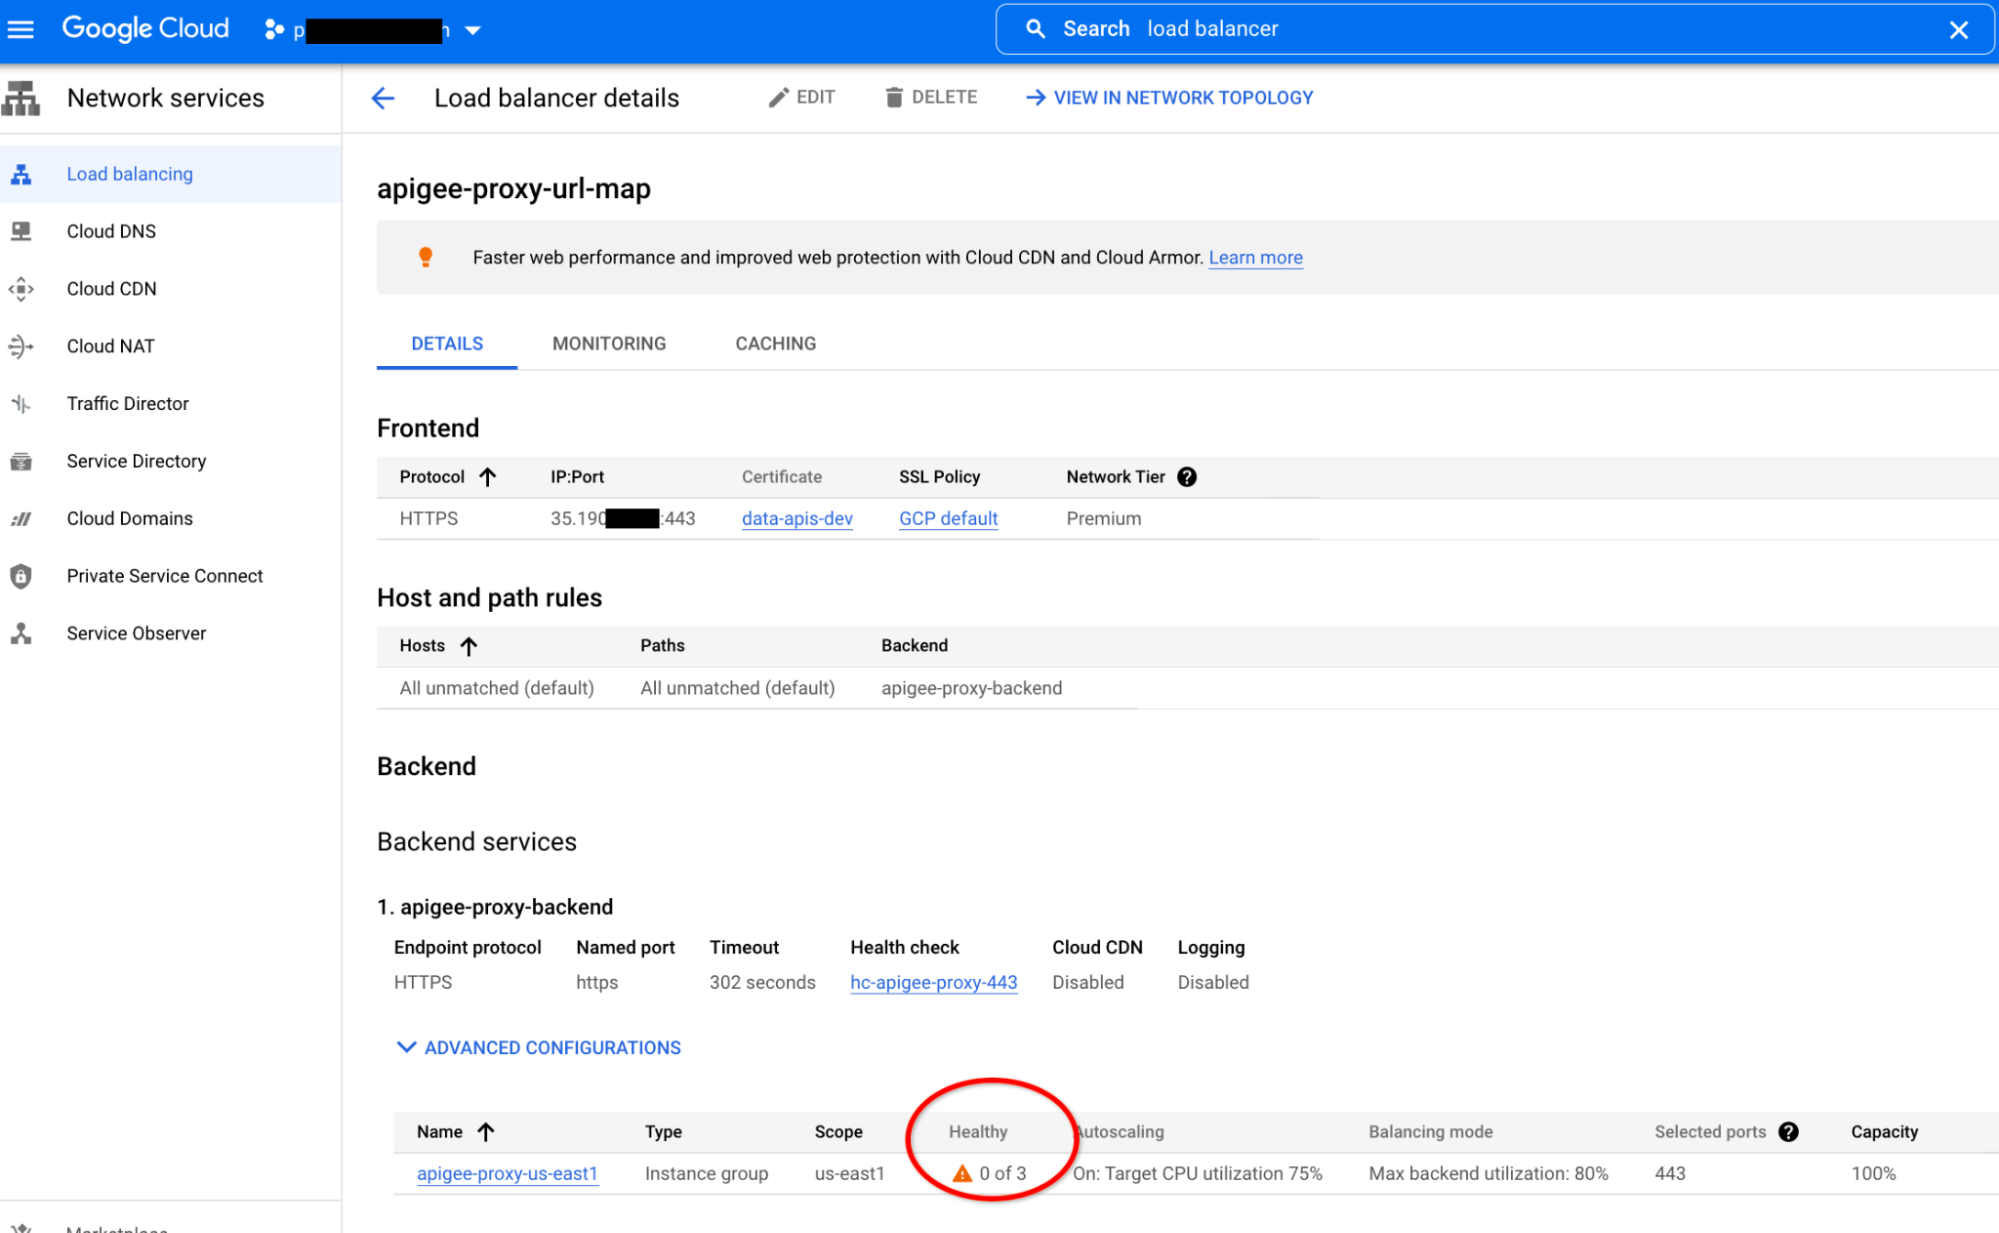
In the Google Cloud console, go to the Load balancing page.
-
Click the load balancer Name. The Load balancer details page opens.
-
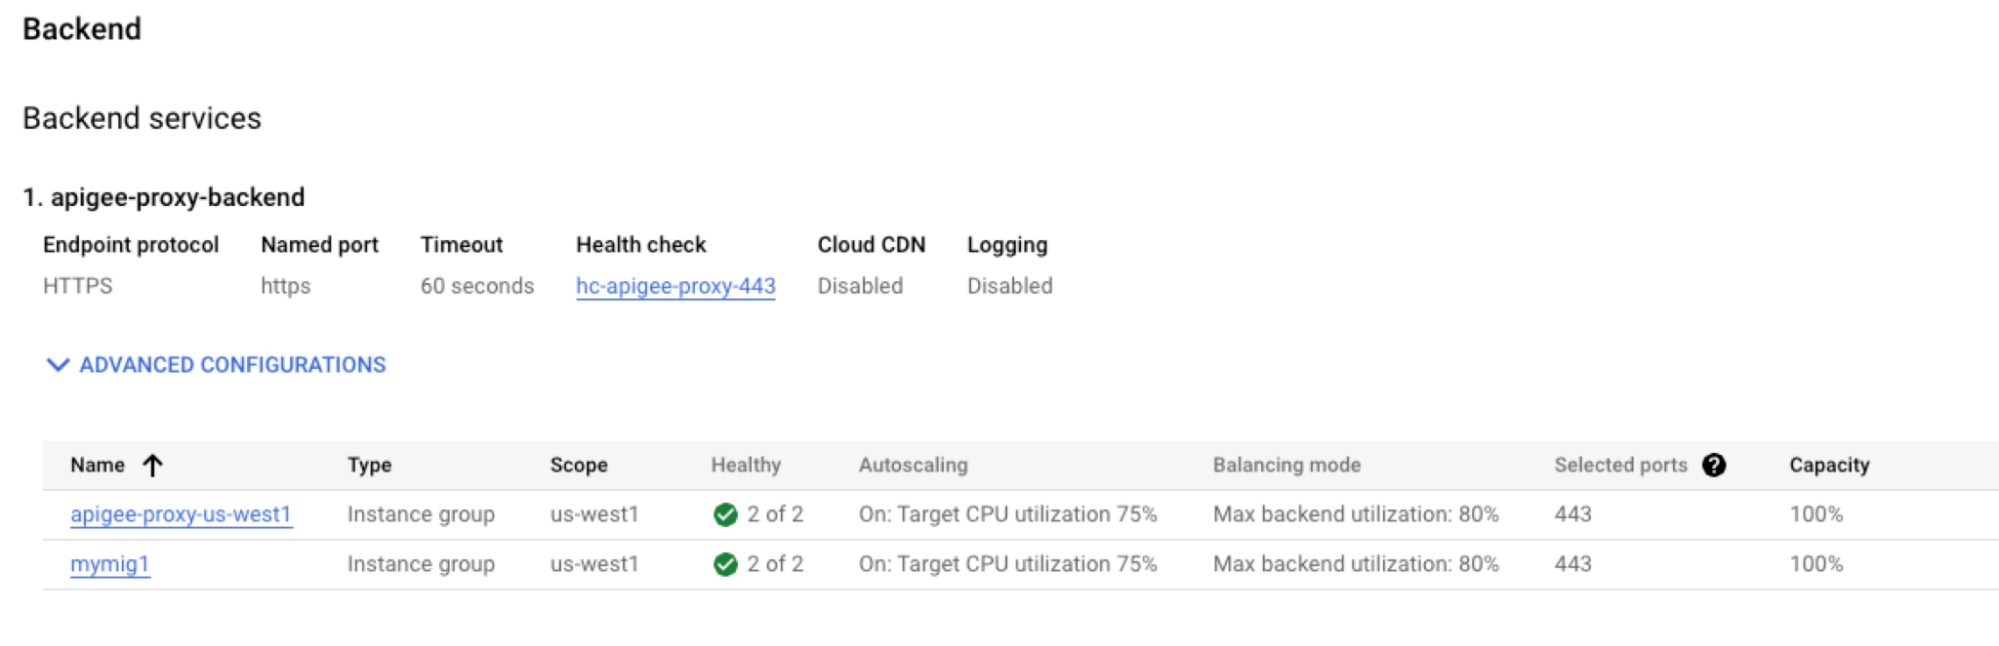
In the Backend section, verify that all load balancer backends have a green check mark in the Healthy column.
-
-
Verify that the endpoint IP address in the MIG template matches the Apigee instance IP address.
The
apigee-proxyVMs are created using an instance template. The template defines theENDPOINTIP address for connecting to the Apigee instance IP address.-
Get the Apigee instance IP address:
curl -s -H "Authorization: Bearer (gcloud auth print-access-token)" \
"https://apigee.googleapis.com/v1/organizations/ORG_NAME/instances/INSTANCE_NAME"
Replace the following:
-
ORG_NAME: the name of your org. For example,
my-org. -
INSTANCE_NAME: the name of your instance. For example,
apigee-proxy-example.
-
ORG_NAME: the name of your org. For example,
-
Or, get the Apigee instance IP address using the Apigee UI:
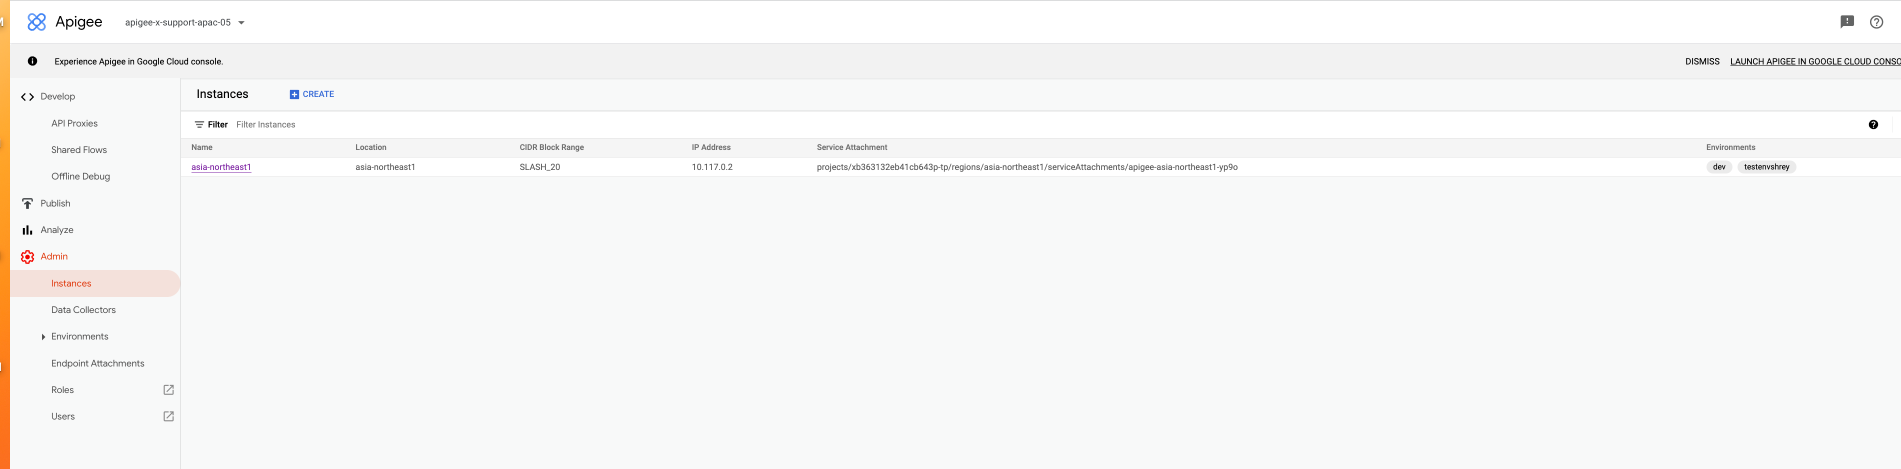
- In the Apigee UI, click Admin > Instances.
-
The IP addresses column lists the IP address:
-
Get the
ENDPOINTIP address from the template:-
In the Google Cloud console, go to the Load balancing page.
- Click the load balancer Name. The Load balancer details page opens.
- In the Backend area, click a backend service name.
-
In the Instance group members area, click a Template name.
-
On the template page, scroll to Custom metadata which is where you will see the ENDPOINT IP address:

-
Ensure that the ENDPOINT IP address matches the Apigee IP address returned in step 2. If it does not match, go to Resolution.
-
Get the Apigee instance IP address:
Resolution
-
If the
apigee-proxyVMs in the instance group display an unhealthy status, then ensure that you have a firewall rule in place which lets the load balancing IP address ranges130.211.0.0/22and35.191.0.0/16access the MIG. -
In the Google Cloud console, go to the Firewall page.
-
Ensure that an ingress firewall rule exists with
target-taglikegke-apigee-proxyand source IP ranges like130.211.0.0/22and35.191.0.0/16over the443 TCPport: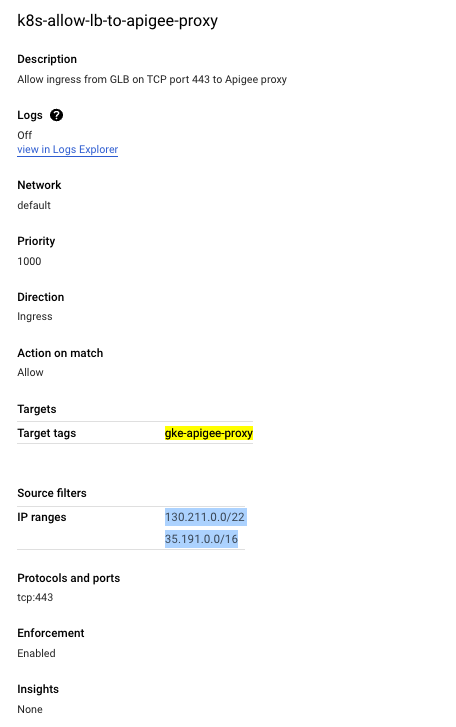
If the MIG has a different tag than
gke-apigee-proxy, then make sure that the tag is added to thetarget-tagin the firewall rule.If the firewall rule does not exist, then add it.
- If the ENDPOINT IP address does not match the Apigee instance IP address, it is possible that the instance was deleted and recreated, which would result in an IP address that no longer matches the IP address in the template. To update the template to use the new IP address, follow the instructions in Changing instance IPs.
Cause: Incorrect network configuration
Diagnosis
-
Locate the value for
authorizedNetworkby running the following API call:curl -H "Authorization: Bearer $(gcloud auth print-access-token)" "https://apigee.googleapis.com/v1/organizations/ORG_NAME"
Something similar to the following is returned:
{
  "name": "apigee-example-org",
  "createdAt": "1621287579456",
  "lastModifiedAt": "1674063833580",
  "environments": [
    "test"
  ],
  "properties": {
    "property": [
      {
        "name": "features.mart.connect.enabled",
        "value": "true"
      },
      {
        "name": "features.hybrid.enabled",
        "value": "true"
      }
    ]
  },
  "analyticsRegion": "us-west1",
  "authorizedNetwork": "default",
  "runtimeType": "CLOUD",
  "subscriptionType": "PAID",
  "caCertificate": "certificate-number",
  "runtimeDatabaseEncryptionKeyName": "projects/apigee-example-org/locations/us-west1/keyRings/my-database-key-ring/cryptoKeys/my-database-key",
  "projectId": "apigee-example-org",
  "state": "ACTIVE",
  "billingType": "SUBSCRIPTION",
  "addonsConfig": {
    "advancedApiOpsConfig": {},
    "integrationConfig": {},
    "monetizationConfig": {}
  },
  "apigeeProjectId": "l09587a43efde330cp-tp"
}
In this example, the value for
authorizedNetworkis default. -
Verify that the
authorizedNetworkvalue is the same as the network which is peered withservicenetworking:-
In the Google Cloud console of the host project, go to the VPC network peering page.
-
The value listed for
servicenetworking-googleapis-comin Your VPC network should be the same as the value returned from the API call. For example,default.
-
-
If you're using a Shared VPC, make sure that
authorizedNetworkvalue has the value of the actual VPC in the host project which is peered withservicenetworking.-
In the Google Cloud console, go to the Shared VPC page.
- Select the host project.
-
The value listed for
servicenetworking-googleapis-comin Your VPC network should be the same as the valueauthorizedNetworkreturned from the API call. For example,default.
-
-
Verify that the instance group associated with the load balancer is the same network as the
authorizedNetworkvalue:-
In the Google Cloud console, go to the Load balancing page.
-
Click a load balancer name. The Load balancer details page opens. A list of instance groups is displayed in the Backend area:
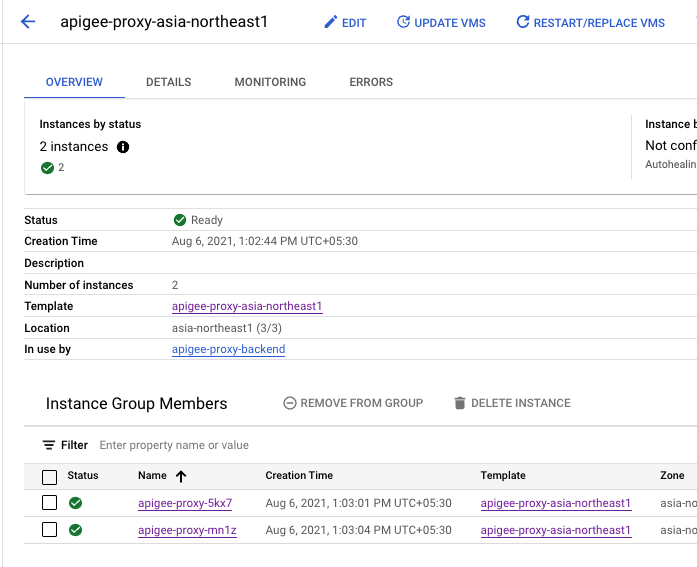
- Click the name of an instance group. The instance group Overview page is displayed.
- Click the Details tab.
-
Scroll to the Networking section:
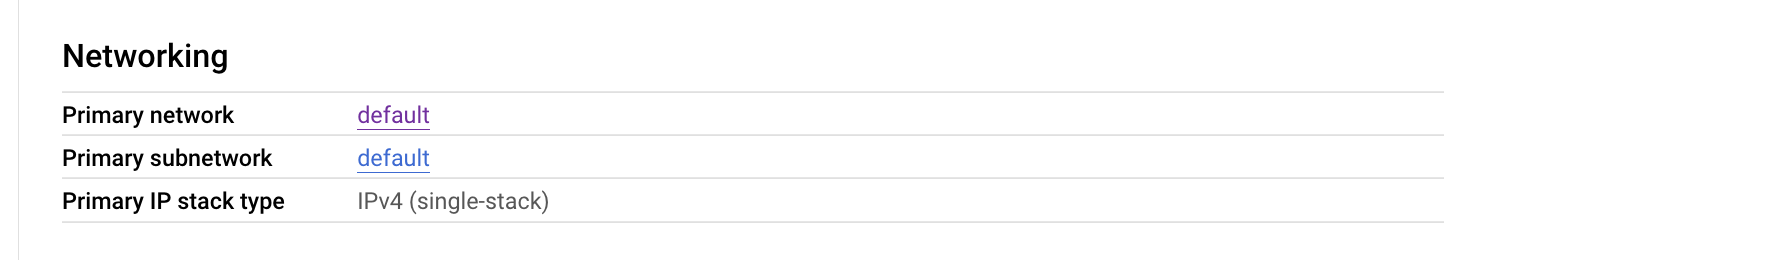
-
Verify that the Primary network here is the same as the
authorizedNetworkvalue. For example,default. - Click the Overview tab.
- In the Instance Group Members section, click the name of an instance. The Details page is displayed.
-
Scroll to the Network Interfaces section:
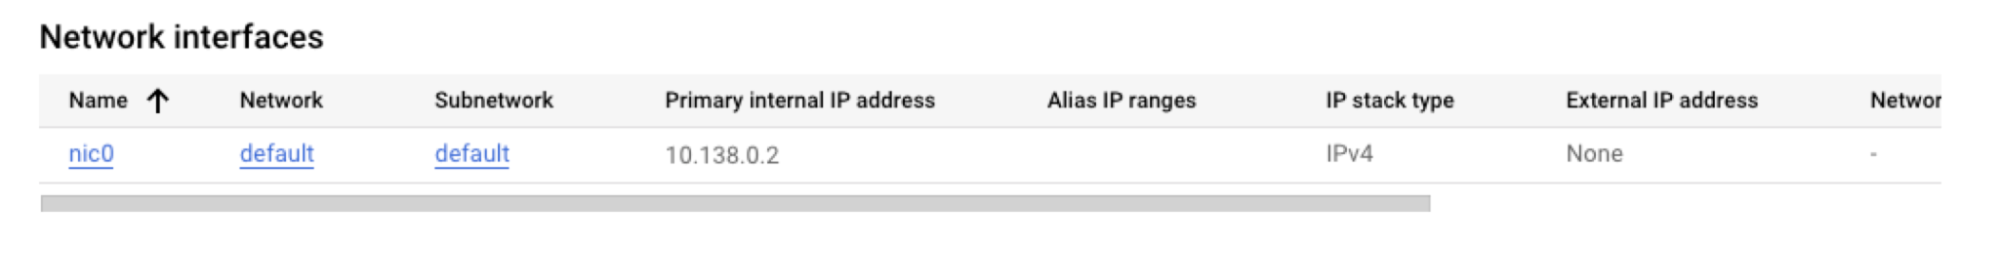
-
Verify that the Network value is the same as
authorizedNetworkvalue. For example,default. - Go to the Overview tab and repeat step h through step j for every instance in the Instance Group Members section.
-
Resolution
-
If in either step 2 or step 3, the
authorizedNetworkvalue is not the same as the network which is peered withservicenetworking, then make sure that you have peered the correct VPC network withservicenetworkingby following the steps in Step 4: Configure service networking. -
If in step 4f and 4j, the network
values are not the same as the
authorizedNetworkvalue, then verify that theauthorizedNetworkis the network peered withservicenetworking.If it is peered correctly, and the network is still not the same as theauthorizedNetwork,then this means the instance group was created incorrectly and you should contact Google Cloud Customer Care.
Cause: Unattached environment on the new Apigee instance created as a part of region expansion
Diagnosis
-
You see a
503error on the client side. For example:HTTP/2 503 date: Thu, 08 Jun 2023 07:22:15 GMT content-length: 0 via: 1.1 google alt-svc: h3=":443"; ma=2592000,h3-29=":443"; ma=2592000
-
If you are seeing
503errors on the second region immediately after a region expansion:-
Ensure that the environments are attached to the new instance by
running the following
API call:
curl -H "Authorization: Bearer $(gcloud auth print-access-token)" "https://apigee.googleapis.com/v1/organizations/ORG_NAME/instances/NEW_INSTANCE/attachments"
For example:
curl -H "Authorization: Bearer $(gcloud auth print-access-token)" "https://apigee.googleapis.com/v1/organizations/apigee-example-org/instances/apigee-proxy-example/attachments"
Something similar to the following is returned:
{
  "attachments": [
    {
      "name": "9ed157df-5ef2-4cdc-b1d5-2643b480eb33",
      "environment": "dev",
      "createdAt": "1628153855420"
    },
    {
      "name": "a9e04dff-4ca4-4749-902f-5058e28c26a5",
      "environment": "prod",
      "createdAt": "1664517347106"
    }
  ]
}
In this example, the instance named
apigee-proxy-exampleis attached to two environments:devandprod. -
Ensure that the managed instance group (MIG) for the second region has
been created and is showing as healthy:
-
In the Google Cloud console, go to the Load balancing page.
- Click the load balancer Name. The Load balancer details page opens.
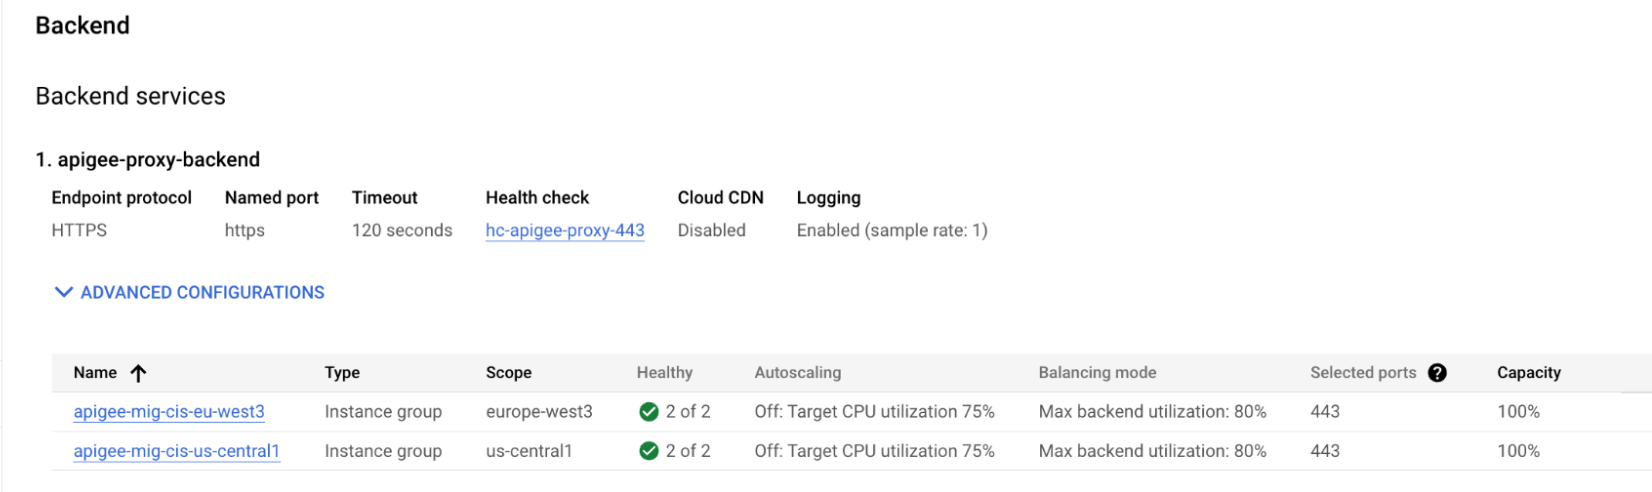
-
Under Backend, you should see two MIGs; one for region 1, and
one for region 2. Verify that both are healthy:
- Validate the second MIG by following the steps in Apigee proxy VMs are unable to forward the traffic to Apigee instance.
-
-
Ensure that the environments are attached to the new instance by
running the following
API call:
Resolution
-
If the new instance is not attached to the environment, then attach the instance to the environment by following the instructions in Attach environments to the new instance.
Another option is make sure the load balancer routes the request to the correct backend where the environment is already attached. For example, of a nonprod env. You may want to attach this to only one region; however, the load balancer may be routing the request to the wrong region. You would need to update the load balancer config to make sure it routes to the correct region.
- If a MIG is unhealthy, See Diagnosis and Resolution in Apigee proxy VMs are unable to forward the traffic to Apigee instance.
Must gather diagnostic information
If the problem persists even after following the above instructions, gather the following diagnostic information and then contact Google Cloud Customer Care:
- Apigee organization
- Environment and API proxy seeing the issue
- Downloaded debug session (if the issue is intermittent)
- Verbose curl output of a failed request.
- Load balancer configured to send API calls to Apigee