Fehlerbehebung bei Problemen mit der Beobachtbarkeit für SAP
Mit Sammlungen den Überblick behalten
Sie können Inhalte basierend auf Ihren Einstellungen speichern und kategorisieren.
In diesem Dokument wird beschrieben, wie Sie Probleme beheben, die bei der Verwendung des Observability-Dienstes für SAP-Arbeitslasten in Workload Manager auftreten können.
Die SAP-System-ID wird nicht im Observability-Dashboard aufgeführt
Nachdem Sie den Agent von Google Cloud für SAP für die Beobachtbarkeit konfiguriert und den Dienstkonten für alle VMs, auf denen die verschiedenen Elemente eines SAP-Systems (z. B. Central Services, Anwendungsserver und SAP HANA-Datenbanken) gehostet werden, die erforderlichen Berechtigungen erteilt haben, wird die System-ID im SAP-Beobachtbarkeitsdashboard angezeigt. Google CloudWenn die System-ID nicht aufgeführt ist, prüfen Sie die Agent-Konfiguration und die Logs, wie in den folgenden Abschnitten beschrieben.
Agent-Konfiguration prüfen
Sie müssen dafür sorgen, dass alle erforderlichen Funktionen für denGoogle Cloud-Agent für SAP richtig konfiguriert sind.
Führen Sie den folgenden Befehl aus, um den Status der Funktionen Ihrer Agent-Instanz abzurufen:
sudo/usr/bin/google_cloud_sap_agentstatus
In dieser Befehlsausgabe werden die aktivierten und deaktivierten Funktionen zusammengefasst. Außerdem werden fehlende IAM-Berechtigungen oder Konfigurationsprobleme angegeben.
Weitere Informationen finden Sie unter Einrichtung für die Beobachtbarkeit von Workload Manager validieren.
VM-Instanzlogs prüfen
Sehen Sie sich in den VM-Instanzlogs Probleme an, die damit zusammenhängen, dass der Agent für SAP die SAP-Systeminformationen nicht aktualisieren kann.
So rufen Sie Logs auf:
Wählen Sie eine VM aus, um die Seite Details zu öffnen.
Klicken Sie auf den Tab Beobachtbarkeit, um Informationen zur VM aufzurufen.
Wählen Sie Alle Protokolle aus und sortieren Sie nach „Fehler“ als Schweregrad.
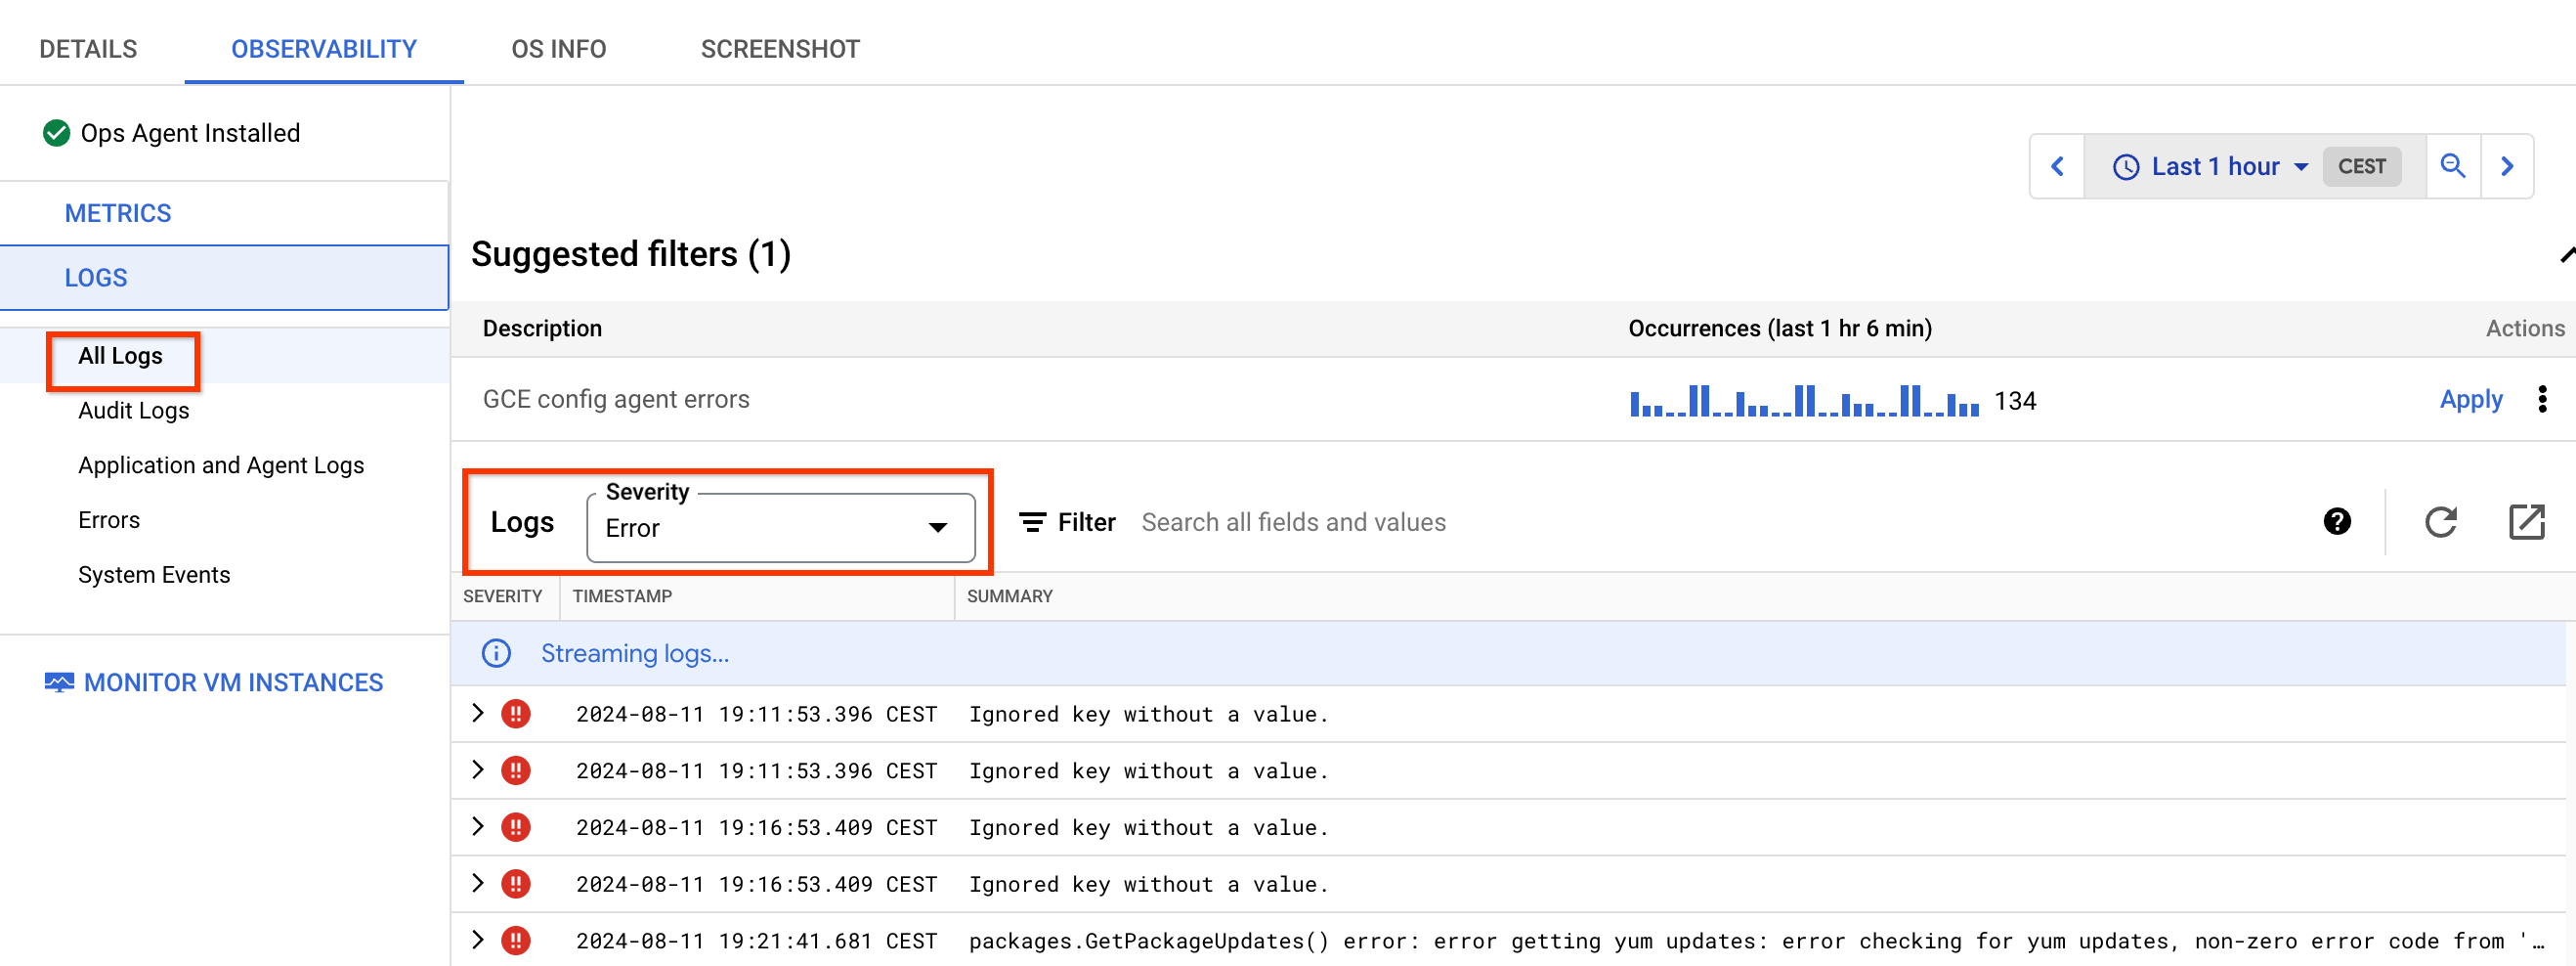
Sie müssen dafür sorgen, dass der Agent für SAP Ihre SAP-Arbeitslasten richtig erkennt.
So rufen Sie Logeinträge für die VM-Instanz auf, auf der der Agent gehostet wird:
Wählen Sie in der Google Cloud Console Logging und anschließend Log-Explorer aus:
Wählen Sie im Bereich Abfrage die Option Abfrage anzeigen aus und geben Sie die folgende Abfrage ein:
jsonPayload.@type:"SapDiscovery"
Wenn Sie keine Informationen von den VMs sehen, auf denen der Agent gehostet wird, ist der Agent möglicherweise nicht konfiguriert oder funktioniert nicht richtig. Weitere Informationen finden Sie unter Agent für SAP konfigurieren.
Optional: Wenn Sie Logs im Zusammenhang mit dem Prozess aufrufen möchten, wenn der Agent für SAP die SAP-Erkennungsdaten hochlädt, verwenden Sie die folgende Abfrage:
Der Systemstatus wird als „nicht angegeben“ angezeigt
Es kann mehrere Ursachen für den Systemdiagnosestatus Unspecified (graue Farbe) des SAP-Systems geben. Dieser Systemstatus wird verwendet, um Systeme zu identifizieren, die aufgrund fehlender Messwerte oder Einstellungen nicht korrekt von Workload Manager bewertet werden können.
Die häufigsten Ursachen für diesen Status sind:
Der Agent für SAP von Google Cloudist möglicherweise beendet oder meldet die erforderlichen Messwerte falsch. Weitere Informationen finden Sie unter Installation des Agents validieren.
Wenn der Agent für SAP ausgeführt wird und der Systemstatus Unspecified lautet, prüfen Sie, ob die Funktionen Process Monitoring und SAP HANA Monitoring im Agent aktiviert und entsprechend den auf der VM ausgeführten SAP-Prozessen richtig konfiguriert sind.
Für Central Services und Application Servers muss das Prozessmonitoring aktiviert sein, für SAP HANA-Datenbanken müssen das Prozessmonitoring und das SAP HANA-Monitoring aktiviert sein.
Die Standardwerte für die Erfassungshäufigkeit der schnell und langsam wechselnden Prozessmonitoring-Messwerte sind 5 Sekunden bzw. 30 Sekunden. Wenn diese Werte über die Standardwerte hinaus erhöht werden, wird der Integritätsstatus möglicherweise als Nicht angegeben angezeigt.
Prüfen Sie auf der Seite „Systemübersicht“, ob Architektur und Skalierungstyp für Ihr System richtig angegeben sind. Wenn einer oder beide dieser Parameter falsch sind, liegt ein zugrunde liegendes Problem mit demGoogle Cloud-Agent für SAP oder den in Google Cloudhochgeladenen SAP-Daten vor.
Wenden Sie sich für weitere Analysen an Cloud Customer Care. Weitere Informationen finden Sie unter Support für den Google Cloud-Agent für SAP erhalten.
Die Rollen für jede VM, die mit dem System zusammenhängen, werden aufgrund von Problemen mit den Messwerten workload/sap/nw/instance/role oder workload/sap/hana/ha/availability oder aufgrund fehlender Messwerte nicht richtig identifiziert.
Prüfen Sie die identifizierten SAP-Rollen in der Liste der VMs auf den Dashboards „Anwendungen“ und „Datenbanken“.
Die folgenden Rollen sind für die einzelnen Architekturtypen erforderlich:
Zentralisierte Architektur: Central Services, Application Server und primärer SAP HANA-Server.
Verteilte Architektur: Central Services, Application Server und primärer SAP HANA-Server.
Verteilt mit HA: Central Services, ERC, Anwendungsserver, primärer SAP HANA-Server und sekundärer SAP HANA-Server.
Allen VMs in der Liste sollte eine Rolle zugewiesen sein.
Prüfen Sie, ob die erforderlichen Messwerte einen gültigen Wert haben. Dazu können Sie entweder den Messwert in Cloud Monitoring prüfen oder die API-Methode timeSeries verwenden, um den neuesten Wert abzurufen, der vom Agent für SAP gesendet wurde. Wenn der Messwert in Cloud Monitoring nicht vorhanden ist oder keinen Wert hat, wird der Gesundheitsstatus als Nicht angegeben gekennzeichnet, da nicht genügend Daten zur Bewertung dieses Messwerts vorhanden sind.
Prüfen Sie bei Architekturen mit HA-Verteilung, ob im Cluster eine fehlgeschlagene Aktion vorhanden ist, und führen Sie eine Bereinigung mit den folgenden Befehlen durch:
RHEL
pcs resource cleanup RESOURCE_ID
SLES
crm resource cleanup RESOURCE_ID
Ersetzen Sie RESOURCE_ID durch die ID der fehlgeschlagenen Ressource im Cluster.
Fehlerhafte Aktionen im Cluster können sich auf die Messwerte workload.googleapis.com/sap/cluster/nodes und workload.googleapis.com/sap/cluster/resources auswirken und zu falschen Werten führen.
Prüfen Sie, ob die Version des Google Cloud-Agents für SAP aktuell ist und ob Sie die neueste verfügbare Version verwenden. Neuere Versionen des Agents enthalten Korrekturen für Probleme und Fehler im Zusammenhang mit Messwerten zur Beobachtbarkeit.
Falsche Messwerte können dazu führen, dass der Systemzustand Nicht angegeben lautet.
Prüfen Sie bei SAP HANA-Datenbanken, die auf einen sekundären Standort repliziert werden, ob eine gültige Clusterkonfiguration zwischen primärem und sekundärem Standort vorhanden ist.
[[["Leicht verständlich","easyToUnderstand","thumb-up"],["Mein Problem wurde gelöst","solvedMyProblem","thumb-up"],["Sonstiges","otherUp","thumb-up"]],[["Schwer verständlich","hardToUnderstand","thumb-down"],["Informationen oder Beispielcode falsch","incorrectInformationOrSampleCode","thumb-down"],["Benötigte Informationen/Beispiele nicht gefunden","missingTheInformationSamplesINeed","thumb-down"],["Problem mit der Übersetzung","translationIssue","thumb-down"],["Sonstiges","otherDown","thumb-down"]],["Zuletzt aktualisiert: 2025-09-04 (UTC)."],[],[],null,["# Troubleshoot observability issues for SAP\n\n| **Preview**\n|\n|\n| This product or feature is subject to the \"Pre-GA Offerings Terms\" in the General Service Terms section\n| of the [Service Specific Terms](/terms/service-terms#1).\n|\n| Pre-GA products and features are available \"as is\" and might have limited support.\n|\n| For more information, see the\n| [launch stage descriptions](/products#product-launch-stages).\n\nThis document describes how to resolve issues that you might encounter while\nusing the observability service for SAP workloads in Workload Manager.\n\nSAP system ID is not listed on the observability dashboard\n----------------------------------------------------------\n\nAfter [configuring the Google Cloud's Agent for SAP](/workload-manager/docs/observe/sap/configure-agent) for observability and\ngranting the required permissions to service accounts for all VMs that host\nthe different elements of an SAP system (such as Central Services,\nApplication Servers, and SAP HANA databases), the system ID appears\non the SAP observability dashboard. If the system ID is not listed, check the\nagent configuration and logs as explained in the following sections.\n\n### Verify the agent configuration\n\nYou must ensure that all required features are correctly configured for the\nGoogle Cloud's Agent for SAP.\n\nTo get the status of the features of your agent instance, run the following command: \n\n sudo /usr/bin/google_cloud_sap_agent status\n\nThis command output summarizes the enabled and disabled features. It also\nindicates any missing IAM permissions or configuration issues.\nFor more information, see [Validate the setup for Workload Manager observability](/workload-manager/docs/observe/sap/configure-agent#validate-setup).\n\n### Check the VM instance logs\n\nIn the VM instance logs, view issues related to the Agent for SAP not being able to update the SAP system information.\nTo view logs, do the following:\n\n1. Select a VM to open the **Details** page.\n2. Click the **Observability** tab to display information about the VM.\n3. Select **All logs** and sort by Error as the **Severity**.\n\n Most of these errors are related to missing permissions for the service account\n attached to the VM. To resolve these errors, [grant the required permissions](/workload-manager/docs/observe/sap/prerequisites#service-account)\n to the service account.\n\n### Check logs using Cloud Logging\n\nYou must ensure that the Agent for SAP discovers your SAP workloads correctly.\nTo view log entries for the VM instance that hosts the agent, do the following:\n\n1. In the Google Cloud console, select **Logging** , and then select **Logs Explorer**:\n\n [Go to the Logs Explorer](https://console.cloud.google.com/logs)\n2. In the **Query** pane, select **Show query** and enter the following query:\n\n ```\n jsonPayload.@type:\"SapDiscovery\"\n ```\n\n If you cannot see any information from the VMs that host the agent, then the\n agent might not be configured or working properly. For more information,\n see [Configure Agent for SAP](/workload-manager/docs/observe/sap/configure-agent).\n3. Optional: To view logs related to the process when Agent for SAP\n uploads the SAP discovery data, use the following query:\n\n ```\n -jsonPayload.caller=~\"third_party/sapagent/internal/system/clouddiscovery/cloud_discovery.go\"\n -jsonPayload.caller=~\"third_party/sapagent/internal/system/sapdiscovery\"\n ```\n\nHealth status appears as unspecified\n------------------------------------\n\nThere might be multiple root causes for *Unspecified* (gray color) health status\nof the SAP system. This health status is used to identify systems that cannot\nbe correctly evaluated by Workload Manager due to missing metrics or settings.\nThe most common causes for this health status are as follows:\n\n- The Google Cloud's Agent for SAP might be stopped or incorrectly\n reporting the required metrics. For more information, see [Validate your installation of the agent](/sap/docs/agent-for-sap/latest/install-config-on-vm#validate-agent4sap-installation).\n\n- If Agent for SAP is up and running and the system status is *Unspecified* ,\n check that the [Process Monitoring](/sap/docs/agent-for-sap/latest/process-monitoring) and [SAP HANA Monitoring](/sap/docs/agent-for-sap/latest/monitoring-sap-hana) features are enabled and configured\n correctly in the agent depending on the SAP processes running on the VM.\n Central Services and Application Servers require Process Monitoring to be enabled\n while SAP HANA databases require Process Monitoring and SAP HANA Monitoring enabled.\n\n - The default values for the [collection frequency](/sap/docs/agent-for-sap/latest/process-monitoring#pm_metric_types) of the fast-changing and slow-changing Process Monitoring metrics are 5 seconds and 30 seconds respectively. If these values are increased above the default values, you might see the health status as *Unspecified*.\n- On the System overview page, check whether the **Architecture** and **Scale-Type**\n are correctly identified for your system. If any or both of these parameters\n are incorrect, then there is an underlying issue with either the\n Google Cloud's Agent for SAP or the uploaded SAP data to Google Cloud.\n For further analysis, contact Cloud Customer Care. See [Getting support\n for Google Cloud's Agent for SAP](/sap/docs/agent-for-sap/latest/troubleshooting#getting_support_for_agent).\n\n- The roles for each VM related to the system are not correctly identified due\n to the metrics `workload/sap/nw/instance/role`\n or `workload/sap/hana/ha/availability` not working correctly or missing.\n Check the identified SAP roles in the list of VMs on the Applications and Databases dashboards.\n\n | **Note:** On the observability dashboards, the *role* for a VM represents the SAP service hosted on that VM.\n\n The following roles are required for each of the architecture types:\n - Centralized Architecture: Central Services, Application Server, and SAP HANA Primary.\n - Distributed Architecture: Central Services, Application Server, and SAP HANA Primary.\n - Distributed with HA: Central Services, ERC, Application Server, SAP HANA Primary, and SAP HANA Secondary.\n\n All the VMs in the list should have a role assigned to them.\n- Verify that [the required metrics](/workload-manager/docs/observe/sap/view-dashboards#metrics) have a valid value by either checking\n the metric inside Cloud Monitoring or by using the [timeSeries](/monitoring/api/ref_v3/rest/v3/projects.timeSeries) API method\n to have the latest value pushed by the Agent for SAP. If the metric is not present in Cloud Monitoring or has no value,\n then the health status is marked as *Unspecified* because there is not enough data to evaluate such a metric.\n\n- On Distributed with HA architectures, check if there is a failed action\n in the cluster and perform a cleanup by running the following commands:\n\n ### RHEL\n\n ```sh\n pcs resource cleanup RESOURCE_ID\n ```\n\n ### SLES\n\n\n ```sh\n crm resource cleanup RESOURCE_ID\n ```\n\n \u003cbr /\u003e\n\n Replace \u003cvar translate=\"no\"\u003eRESOURCE_ID\u003c/var\u003e with the ID of the failed resource\n in the cluster.\n\n Failed action in the cluster might impact the metrics `workload.googleapis.com/sap/cluster/nodes`\n and `workload.googleapis.com/sap/cluster/resources` and it reports incorrect values.\n- Check whether the Google Cloud's Agent for SAP version is up to date and that\n you are running the latest version available. Newer versions of the\n agent contains fixes for issues and bugs related to observability metrics.\n Incorrect metrics might result in the *Unspecified* health status of the system.\n\n- For SAP HANA databases replicating to a secondary site, check if there is a valid cluster configuration between primary and secondary."]]