This document describes how to resolve issues that you might encounter while using the observability service for SAP workloads in Workload Manager.
SAP system ID is not listed on the observability dashboard
After configuring the Google Cloud's Agent for SAP for observability and granting the required permissions to service accounts for all VMs that host the different elements of an SAP system (such as Central Services, Application Servers, and SAP HANA databases), the system ID appears on the SAP observability dashboard. If the system ID is not listed, check the agent configuration and logs as explained in the following sections.
Verify the agent configuration
You must ensure that all required features are correctly configured for the Google Cloud's Agent for SAP.
To get the status of the features of your agent instance, run the following command:
sudo /usr/bin/google_cloud_sap_agent status
This command output summarizes the enabled and disabled features. It also indicates any missing IAM permissions or configuration issues. For more information, see Validate the setup for Workload Manager observability.
Check the VM instance logs
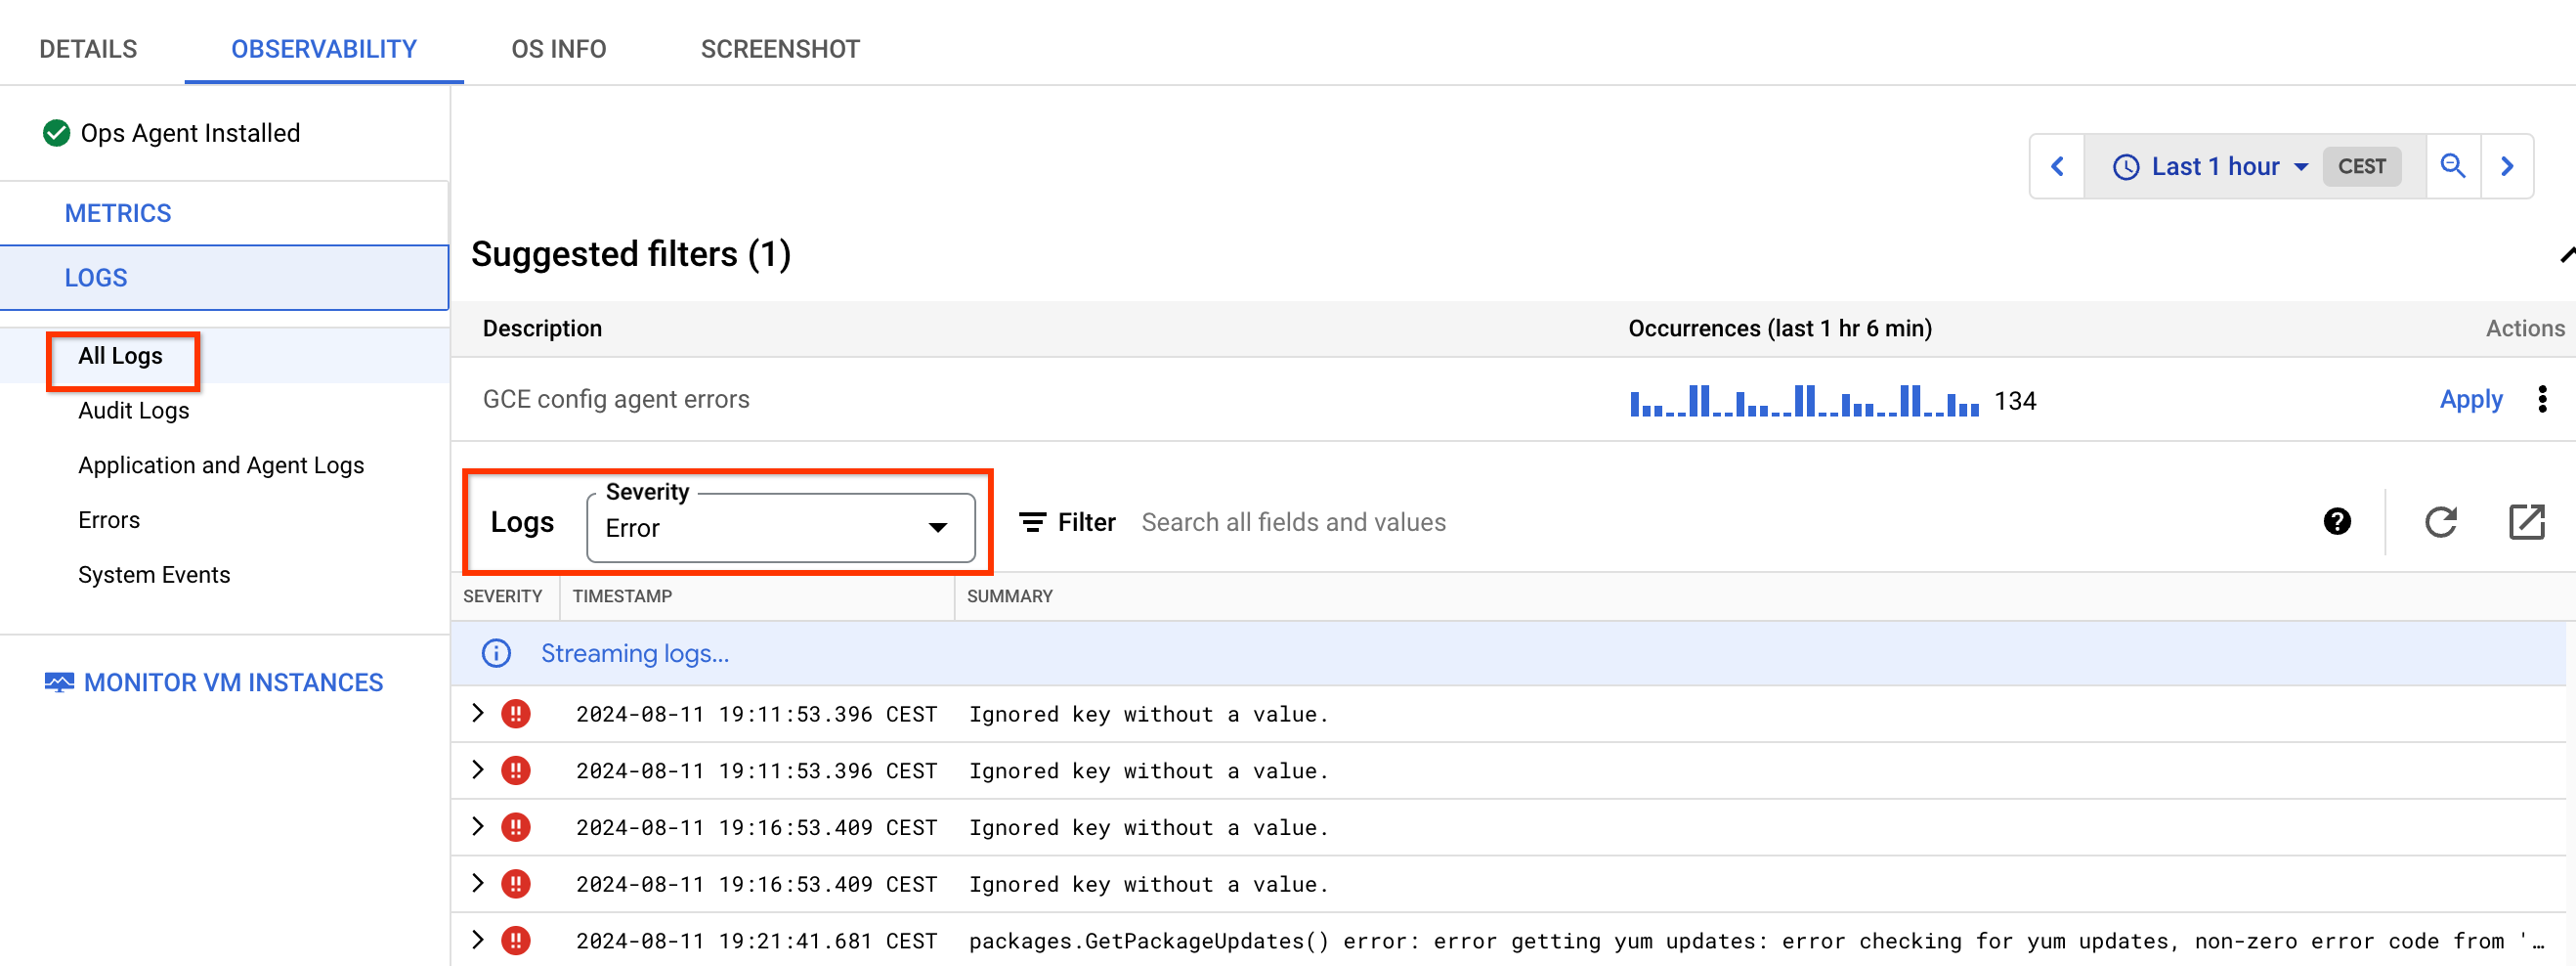
In the VM instance logs, view issues related to the Agent for SAP not being able to update the SAP system information. To view logs, do the following:
- Select a VM to open the Details page.
- Click the Observability tab to display information about the VM.
Select All logs and sort by Error as the Severity.

Most of these errors are related to missing permissions for the service account attached to the VM. To resolve these errors, grant the required permissions to the service account.
Check logs using Cloud Logging
You must ensure that the Agent for SAP discovers your SAP workloads correctly. To view log entries for the VM instance that hosts the agent, do the following:
In the Google Cloud console, select Logging, and then select Logs Explorer:
In the Query pane, select Show query and enter the following query:
jsonPayload.@type:"SapDiscovery"
If you cannot see any information from the VMs that host the agent, then the agent might not be configured or working properly. For more information, see Configure Agent for SAP.
Optional: To view logs related to the process when Agent for SAP uploads the SAP discovery data, use the following query:
 -jsonPayload.caller=~"third_party/sapagent/internal/system/clouddiscovery/cloud_discovery.go"
 -jsonPayload.caller=~"third_party/sapagent/internal/system/sapdiscovery"
Health status appears as unspecified
There might be multiple root causes for Unspecified (gray color) health status of the SAP system. This health status is used to identify systems that cannot be correctly evaluated by Workload Manager due to missing metrics or settings. The most common causes for this health status are as follows:
The Google Cloud's Agent for SAP might be stopped or incorrectly reporting the required metrics. For more information, see Validate your installation of the agent.
If Agent for SAP is up and running and the system status is Unspecified, check that the Process Monitoring and SAP HANA Monitoring features are enabled and configured correctly in the agent depending on the SAP processes running on the VM. Central Services and Application Servers require Process Monitoring to be enabled while SAP HANA databases require Process Monitoring and SAP HANA Monitoring enabled.
- The default values for the collection frequency of the fast-changing and slow-changing Process Monitoring metrics are 5 seconds and 30 seconds respectively. If these values are increased above the default values, you might see the health status as Unspecified.
On the System overview page, check whether the Architecture and Scale-Type are correctly identified for your system. If any or both of these parameters are incorrect, then there is an underlying issue with either the Google Cloud's Agent for SAP or the uploaded SAP data to Google Cloud. For further analysis, contact Cloud Customer Care. See Getting support for Google Cloud's Agent for SAP.
The roles for each VM related to the system are not correctly identified due to the metrics
workload/sap/nw/instance/roleorworkload/sap/hana/ha/availabilitynot working correctly or missing. Check the identified SAP roles in the list of VMs on the Applications and Databases dashboards.The following roles are required for each of the architecture types:
- Centralized Architecture: Central Services, Application Server, and SAP HANA Primary.
- Distributed Architecture: Central Services, Application Server, and SAP HANA Primary.
- Distributed with HA: Central Services, ERC, Application Server, SAP HANA Primary, and SAP HANA Secondary.
All the VMs in the list should have a role assigned to them.
Verify that the required metrics have a valid value by either checking the metric inside Cloud Monitoring or by using the timeSeries API method to have the latest value pushed by the Agent for SAP. If the metric is not present in Cloud Monitoring or has no value, then the health status is marked as Unspecified because there is not enough data to evaluate such a metric.
On Distributed with HA architectures, check if there is a failed action in the cluster and perform a cleanup by running the following commands:
RHEL
pcs resource cleanup RESOURCE_ID
SLES
crm resource cleanup RESOURCE_ID
Replace
RESOURCE_IDwith the ID of the failed resource in the cluster.Failed action in the cluster might impact the metrics
workload.googleapis.com/sap/cluster/nodesandworkload.googleapis.com/sap/cluster/resourcesand it reports incorrect values.Check whether the Google Cloud's Agent for SAP version is up to date and that you are running the latest version available. Newer versions of the agent contains fixes for issues and bugs related to observability metrics. Incorrect metrics might result in the Unspecified health status of the system.
For SAP HANA databases replicating to a secondary site, check if there is a valid cluster configuration between primary and secondary.
