이 페이지에서는 에이전트에서 Cloud Trace를 사용 설정하고 trace를 확인하여 쿼리 응답 시간과 실행된 작업을 분석하는 방법을 보여줍니다.
trace는 에이전트가 각 쿼리에 응답할 때의 요청 타임라인입니다. 예를 들어 다음 Gantt 차트는 LangchainAgent의 샘플 trace를 보여줍니다.
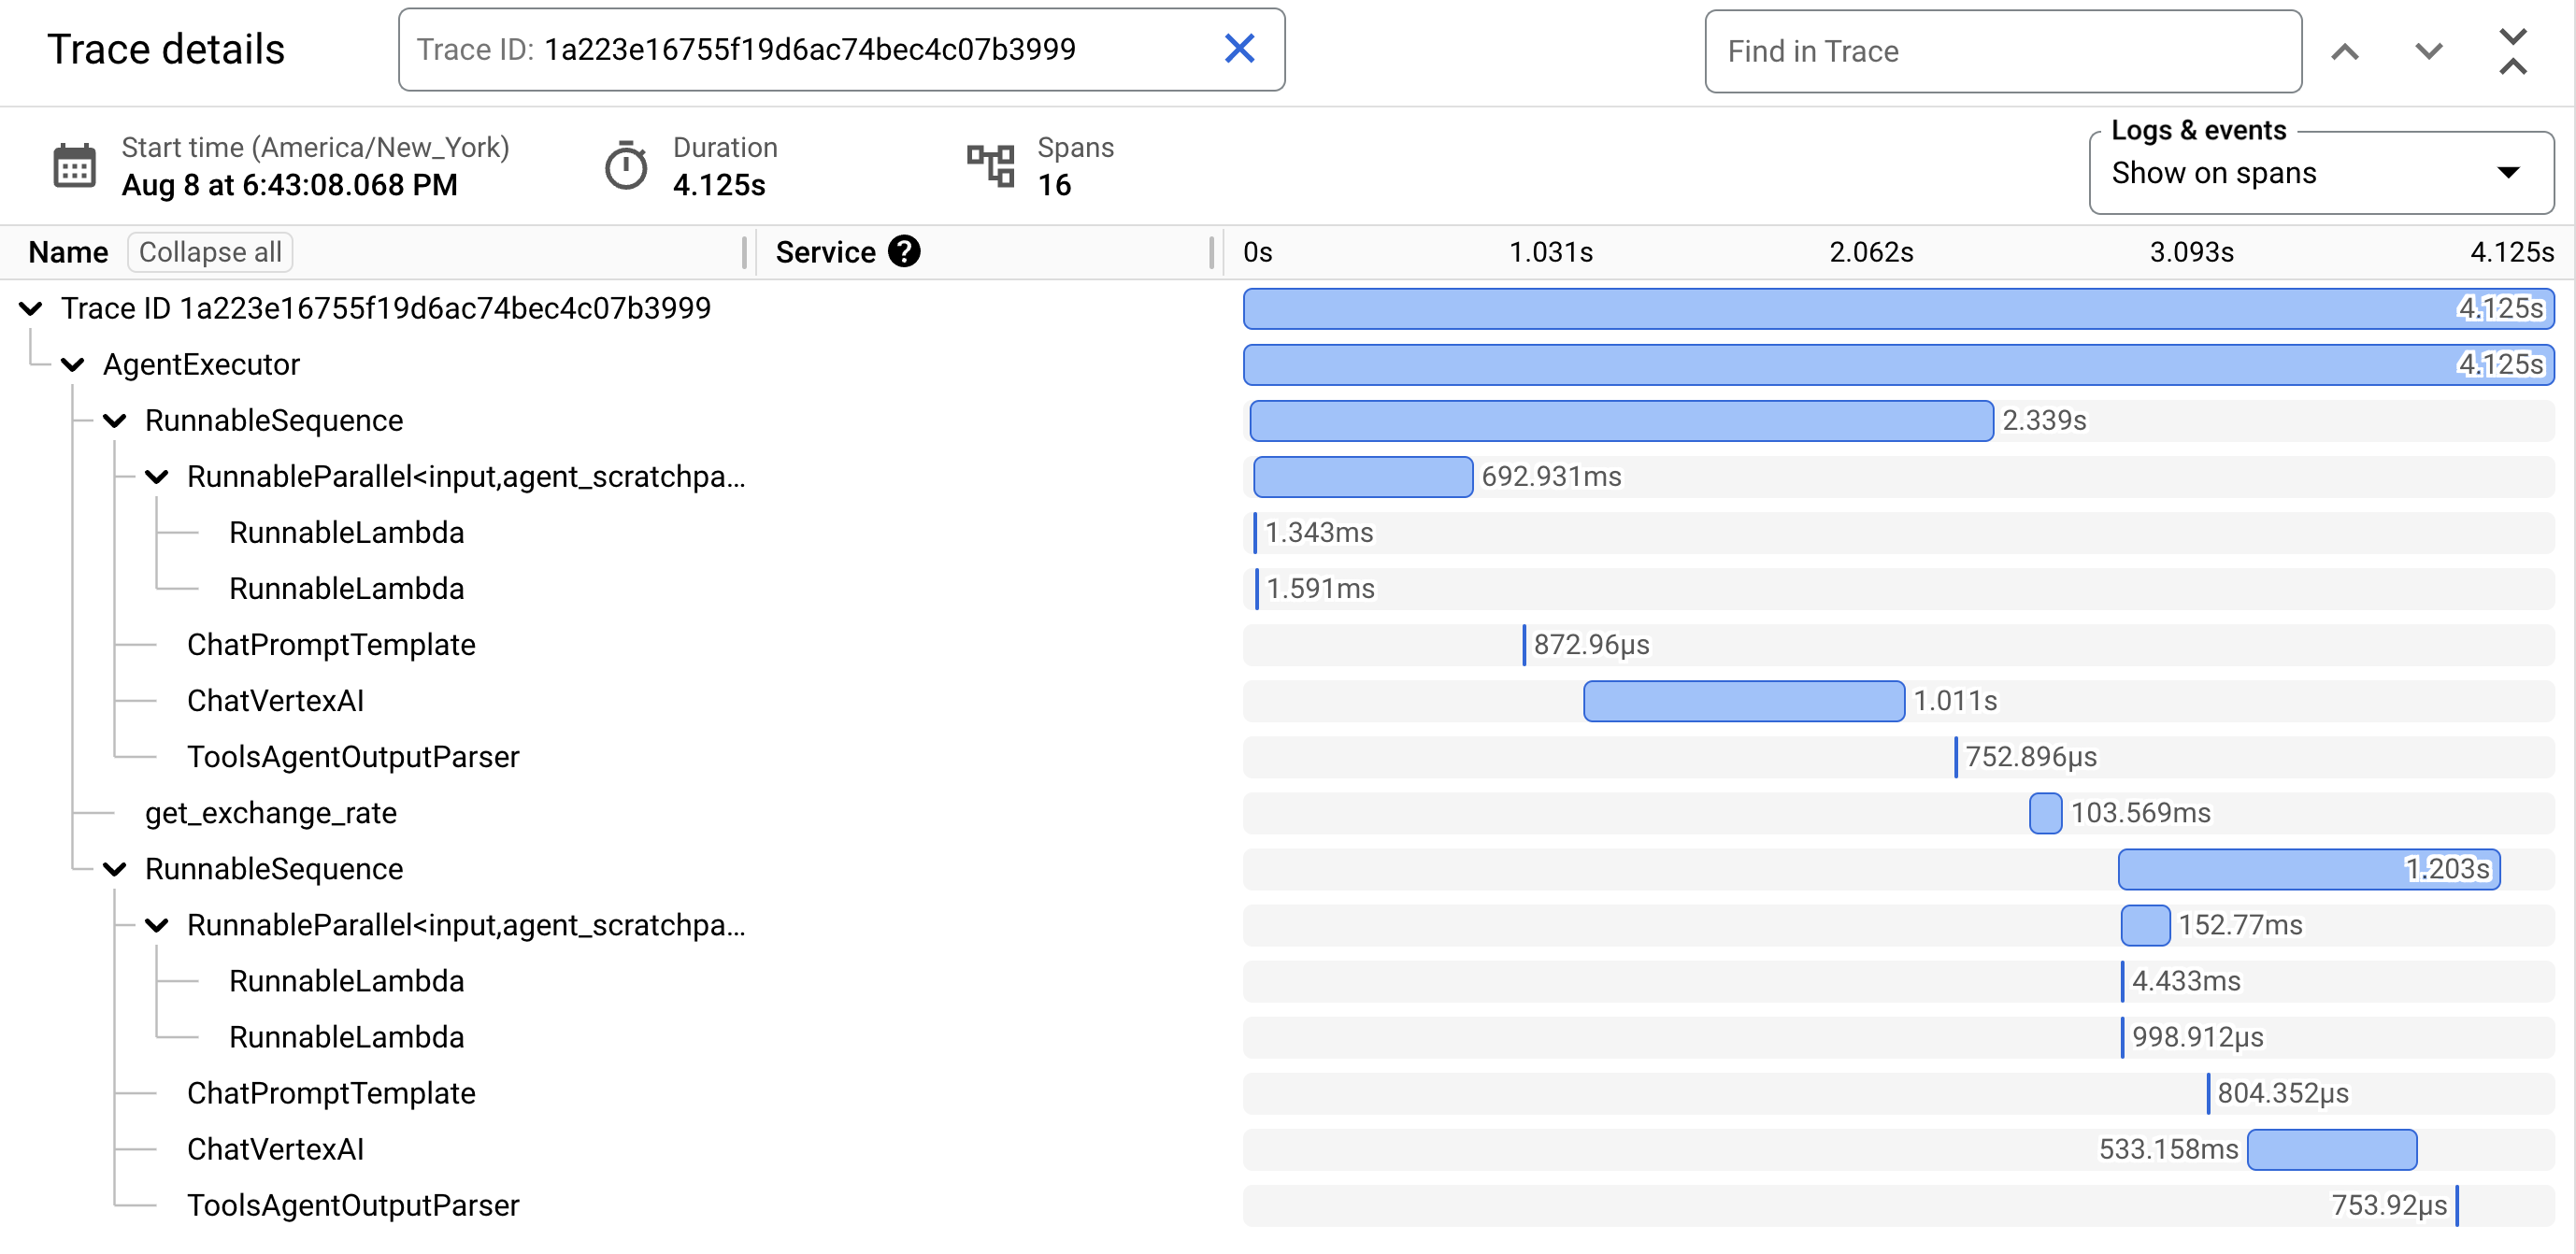
Gantt 차트의 첫 번째 행은 trace입니다. trace는 함수 호출이나 LLM과의 상호작용과 같은 단일 작업 단위를 나타내는 개별 스팬으로 구성되며, 첫 번째 스팬은 전체 요청을 나타냅니다. 각 스팬은 요청 내에서 작업의 이름, 시작 및 종료 시간, 관련 속성과 같은 특정 작업에 관한 세부정보를 제공합니다. 예를 들어 다음 JSON은 대규모 언어 모델(LLM) 호출을 나타내는 단일 스팬을 보여줍니다.
{"name":"llm","context":{"trace_id":"ed7b336d-e71a-46f0-a334-5f2e87cb6cfc","span_id":"ad67332a-38bd-428e-9f62-538ba2fa90d4"},"span_kind":"LLM","parent_id":"f89ebb7c-10f6-4bf8-8a74-57324d2556ef","start_time":"2023-09-07T12:54:47.597121-06:00","end_time":"2023-09-07T12:54:49.321811-06:00","status_code":"OK","status_message":"","attributes":{"llm.input_messages":[{"message.role":"system","message.content":"You are an expert Q&A system that is trusted around the world.\nAlways answer the query using the provided context information, and not prior knowledge.\nSome rules to follow:\n1. Never directly reference the given context in your answer.\n2. Avoid statements like 'Based on the context, ...' or 'The context information ...' or anything along those lines."},{"message.role":"user","message.content":"Hello?"}],"output.value":"assistant: Yes I am here","output.mime_type":"text/plain"},"events":[],}
[[["이해하기 쉬움","easyToUnderstand","thumb-up"],["문제가 해결됨","solvedMyProblem","thumb-up"],["기타","otherUp","thumb-up"]],[["이해하기 어려움","hardToUnderstand","thumb-down"],["잘못된 정보 또는 샘플 코드","incorrectInformationOrSampleCode","thumb-down"],["필요한 정보/샘플이 없음","missingTheInformationSamplesINeed","thumb-down"],["번역 문제","translationIssue","thumb-down"],["기타","otherDown","thumb-down"]],["최종 업데이트: 2025-09-04(UTC)"],[],[],null,["This page shows you how to enable [Cloud Trace](/trace/docs/overview) on your agent\nand view traces to analyze query response times and executed operations.\n\nA [**trace**](https://opentelemetry.io/docs/concepts/signals/traces/)\nis a timeline of requests as your agent responds to each query. For example, the following Gantt chart shows a sample trace from a `LangchainAgent`:\n\n\u003cbr /\u003e\n\nThe first row in the Gantt chart is for the trace. A trace is\ncomposed of individual [**spans**](https://opentelemetry.io/docs/concepts/signals/traces/#spans), which\nrepresent a single unit of work, like a function call or an interaction with an\nLLM, with the first span representing the overall\nrequest. Each span provides details about a specific operation, such as the operation's name, start and end times,\nand any relevant [attributes](https://opentelemetry.io/docs/concepts/signals/traces/#attributes), within the request. For example, the following JSON shows a single span that represents\na call to a large language model (LLM): \n\n {\n \"name\": \"llm\",\n \"context\": {\n \"trace_id\": \"ed7b336d-e71a-46f0-a334-5f2e87cb6cfc\",\n \"span_id\": \"ad67332a-38bd-428e-9f62-538ba2fa90d4\"\n },\n \"span_kind\": \"LLM\",\n \"parent_id\": \"f89ebb7c-10f6-4bf8-8a74-57324d2556ef\",\n \"start_time\": \"2023-09-07T12:54:47.597121-06:00\",\n \"end_time\": \"2023-09-07T12:54:49.321811-06:00\",\n \"status_code\": \"OK\",\n \"status_message\": \"\",\n \"attributes\": {\n \"llm.input_messages\": [\n {\n \"message.role\": \"system\",\n \"message.content\": \"You are an expert Q&A system that is trusted around the world.\\nAlways answer the query using the provided context information, and not prior knowledge.\\nSome rules to follow:\\n1. Never directly reference the given context in your answer.\\n2. Avoid statements like 'Based on the context, ...' or 'The context information ...' or anything along those lines.\"\n },\n {\n \"message.role\": \"user\",\n \"message.content\": \"Hello?\"\n }\n ],\n \"output.value\": \"assistant: Yes I am here\",\n \"output.mime_type\": \"text/plain\"\n },\n \"events\": [],\n }\n\n| **Note:** The format of the trace(s) and span(s) depends on the instrumentation option you go with. The example span is experimental and subject to change so you shouldn't rely on the format to be stable for now. For details, see the [Semantic Conventions for Generative AI systems](https://opentelemetry.io/docs/specs/semconv/gen-ai/) being developed in OpenTelemetry.\n\nFor details, see the Cloud Trace documentation on\n[Traces and spans](/trace/docs/traces-and-spans) and\n[Trace context](/trace/docs/trace-context).\n\nWrite traces for an agent\n\nTo write traces for an agent: \n\nADK\n\nTo enable tracing for `AdkApp`, specify `enable_tracing=True` when you\n[develop an Agent Development Kit agent](/vertex-ai/generative-ai/docs/agent-engine/develop/adk).\nFor example: \n\n from vertexai.preview.reasoning_engines import AdkApp\n from google.adk.agents import Agent\n\n agent = Agent(\n model=model,\n name=agent_name,\n tools=[get_exchange_rate],\n )\n\n app = AdkApp(\n agent=agent, # Required.\n enable_tracing=True, # Optional.\n )\n\nLangchainAgent\n\nTo enable tracing for `LangchainAgent`, specify `enable_tracing=True` when you\n[develop a LangChain agent](/vertex-ai/generative-ai/docs/agent-engine/develop/langchain).\nFor example: \n\n from vertexai.preview.reasoning_engines import LangchainAgent\n\n agent = LangchainAgent(\n model=model, # Required.\n tools=[get_exchange_rate], # Optional.\n enable_tracing=True, # [New] Optional.\n )\n\nLanggraphAgent\n\nTo enable tracing for `LanggraphAgent`, specify `enable_tracing=True` when you\n[develop a LangGraph agent](/vertex-ai/generative-ai/docs/agent-engine/develop/langgraph).\nFor example: \n\n from vertexai.preview.reasoning_engines import LanggraphAgent\n\n agent = LanggraphAgent(\n model=model, # Required.\n tools=[get_exchange_rate], # Optional.\n enable_tracing=True, # [New] Optional.\n )\n\nLlamaIndex\n\n\n| **Preview**\n|\n|\n| This feature is subject to the \"Pre-GA Offerings Terms\" in the General Service Terms section\n| of the [Service Specific Terms](/terms/service-terms#1).\n|\n| Pre-GA features are available \"as is\" and might have limited support.\n|\n| For more information, see the\n| [launch stage descriptions](/products#product-launch-stages).\n\n\u003cbr /\u003e\n\nTo enable tracing for `LlamaIndexQueryPipelineAgent`, specify `enable_tracing=True` when you\n[develop a LlamaIndex agent](/vertex-ai/generative-ai/docs/agent-engine/develop/llama-index/query-pipeline).\nFor example: \n\n from vertexai.preview import reasoning_engines\n\n def runnable_with_tools_builder(model, runnable_kwargs=None, **kwargs):\n from llama_index.core.query_pipeline import QueryPipeline\n from llama_index.core.tools import FunctionTool\n from llama_index.core.agent import ReActAgent\n\n llama_index_tools = []\n for tool in runnable_kwargs.get(\"tools\"):\n llama_index_tools.append(FunctionTool.from_defaults(tool))\n agent = ReActAgent.from_tools(llama_index_tools, llm=model, verbose=True)\n return QueryPipeline(modules = {\"agent\": agent})\n\n agent = reasoning_engines.LlamaIndexQueryPipelineAgent(\n model=\"gemini-2.0-flash\",\n runnable_kwargs={\"tools\": [get_exchange_rate]},\n runnable_builder=runnable_with_tools_builder,\n enable_tracing=True, # Optional\n )\n\nCustom\n\nTo enable tracing for [custom agents](/vertex-ai/generative-ai/docs/agent-engine/develop/custom),\nvisit [Tracing using OpenTelemetry](/vertex-ai/generative-ai/docs/agent-engine/develop/custom#tracing)\nfor details.\n\nThis will export traces to Cloud Trace under the project in\n[Set up your Google Cloud project](/vertex-ai/generative-ai/docs/agent-engine/set-up#project).\n\nView traces for an agent\n\nYou can view your traces using the [Trace Explorer](/trace/docs/finding-traces):\n\n1. To get the permissions to view trace data in the Google Cloud console or\n select a trace scope, ask your administrator to grant you the\n [Cloud Trace User](/iam/docs/understanding-roles#cloudtrace.user)\n (`roles/cloudtrace.user`) IAM role on your project.\n\n2. Go to **Trace Explorer** in the Google Cloud console:\n\n [Go to the Trace Explorer](https://console.cloud.google.com/traces/list)\n3. Select your Google Cloud project (corresponding to \u003cvar translate=\"no\"\u003ePROJECT_ID\u003c/var\u003e)\n at the top of the page.\n\nTo learn more, see the [Cloud Trace documentation](/trace/docs/finding-traces).\n\nQuotas and limits\n\nSome attribute values might get truncated when they reach quota limits. For\nmore information, see [Cloud Trace Quota](/trace/docs/quotas).\n\nPricing\n\nCloud Trace has a free tier. For more information, see\n[Cloud Trace Pricing](/trace#pricing)."]]