データベースのオブザーバビリティは、ログ、指標、トレースで生成されるデータまたはテレメトリーに基づいて、データベース システムの内部状態をどの程度正確に推定できるかを表す尺度です。
アプリケーション内の問題の診断とトラブルシューティングは、データベースが関係する場合は特に困難で、時間がかかる可能性があります。テレメトリーの収集は極めて重要です。テレメトリーをアプリケーションのコンテキストで拡充すると、データベース インスタンスのわかりやすさとオブザーバビリティが向上し、メンテナンスが容易になります。コストのかかるダウンタイムを発生させることなく、問題と問題の傾向を容易に特定し、早期に解決できます。さらに、そのようなデータを使用して、開始時点から適切な種類のデータを収集するように新しいデータベース インスタンスを構成できます。
データを効果的かつ積極的に活用することで、問題を防止し、戦略的イノベーションに集中できます。適切なテレメトリーの収集は特に DevOps モデルで役立ちます。DevOps モデルの場合、データベース ジェネラリストは、急速に変化するアプリケーションのパフォーマンスと正常性をモニタリングし、評価と最適化を行うために、テレメトリーを個別に分析する必要があります。
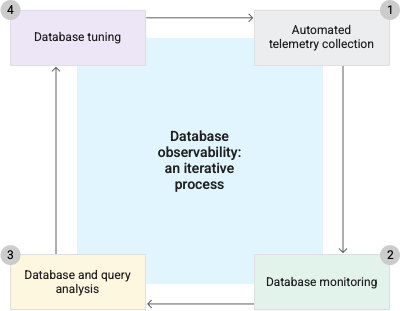
Google Cloud には、オブザーバビリティの 4 つの反復ステージを網羅し、Cloud SQL データベースの正常性の維持に役立つ機能が用意されています。
テレメトリーの自動収集
オブザーバビリティの目標を達成するにはテレメトリーを収集しますが、可能であれば、このプロセスは自動的に行います。テレメトリーを一定期間収集することで、さまざまな負荷の条件下で指標のベースラインを確立できます。
Google Cloud サービスでは、完全なオブザーバビリティの概要を示す際に役立つ指標、ログ、トレースなど、オブザーバビリティ データが自動的に生成されます。
Cloud Monitoring は、使用しているサービスと Google Cloud リソースの測定値を収集します。Cloud SQL では、組み込みのメモリ カスタム エージェントを使用してクエリ テレメトリーを収集します。これにより、パフォーマンスへの影響が少なくなり、エージェントのメンテナンスやセキュリティ オーバーヘッドが不要になります。
Cloud Logging は、一般的なアプリケーション コンポーネントからロギングデータを収集します。Cloud SQL については、インスタンス ログの表示もご覧ください。
Cloud Trace は、レイテンシ データと実行したクエリプランをアプリケーションから収集します。これにより、リクエストがアプリケーション全体でどのように影響するのかを追跡できます。これらのレイテンシの分布を時系列またはバージョン間で比較できます。Cloud Trace でアプリケーションを計測すると、アプリケーションのレイテンシ プロファイルに大幅な変化が見つかったときに、Cloud Trace からアラートが送信されます。
Sqlcommenter(データベース用の OpenTelemetry ライブラリ)を使用すると、アプリケーションの視点からデータベースをモニタリングできます。OpenTelemetry トレース コンテキスト情報をデータベースに伝達するため、Sqlcommenter は ORM を自動的に測定し、タグを使用して SQL ステートメントを拡張します。
データベースのタグとトレース アプリケーションを使用すると、アプリケーション コードをデータベース パフォーマンスと簡単に関連付けて、マイクロサービス ベースのアーキテクチャをトラブルシューティングできます。
データベースのモニタリング
適切なモニタリングを行うことで、アプリケーションが適切に機能しているかどうかを確認できます。モニタリングは、移行を開始する前や新しいアプリケーションを本番環境にデプロイする前など、早期の段階で実装します。アプリケーションの問題と、基盤となるクラウドの問題を明確に区別する必要があります。
Cloud SQL の概要ページには、主要な指標のグラフが表示されます。
Cloud SQL は、選択したインスタンスの指標を比較する場合にも役立ちます。
Cloud Monitoring を使用して、指標をモニタリングするカスタム ダッシュボードを作成し、アラート ポリシーを設定することで、通知をタイムリーに受け取ることができます。
データベースの調整
データベースのトラブルシューティングと調整は繰り返し行うことができます。
Cloud SQL Recommender は、データベースの現在の使用状況の分析をサポートし、ヒューリスティックな方法と機械学習に基づいて推奨事項と分析情報を提供します。
Cloud SQL Recommender の概要は次のとおりです。
| 名前 | 説明 |
|---|---|
| ディスク容量不足 Recommender | Cloud SQL インスタンスのディスク容量不足が原因で発生する可能性があるダウンタイムのリスクを軽減できます。 |
| アイドル状態のインスタンスの Recommender | 誤ってアイドル状態になっている Cloud SQL インスタンスをシャットダウンすることで、コストを削減できます。 |
| オーバープロビジョニングされたインスタンスの Recommender | 特定のワークロードで不要に大きい Cloud SQL インスタンスのサイズを変更して、コストを削減します。 |
| アンダープロビジョニング インスタンスの Recommender | CPU とメモリの高使用率によるボトルネックを回避し、CPU やメモリの使用量が多い Cloud SQL インスタンスのサイズを変更して、メモリ不足イベントが発生する可能性を最小限に抑えます。 |
次のステップ
- Cloud SQL 指標の一覧を表示する。
- Cloud Logging と Cloud Monitoring の詳細を確認する。インスタンスのログを表示するもご覧ください。
- データベース インスタンスをトラブルシューティングして調整する。
- Google Cloud Recommender の詳細を確認する。