本頁說明效能資訊主頁如何協助您診斷 Google Cloud 專案中的效能問題。以下各節說明常見的效能問題及其根本原因。
成效診斷:是專案還是 Google Cloud?
您在專案中觀察到延遲或封包遺失值,並想要驗證並與專案以外的參考資料進行比較。效能資訊主頁中的「所有 Google Cloud的效能」檢視畫面可讓您將各專案的網路效能 (例如 VM 對 VM 封包遺失或延遲) 與所有Google Cloud的效能做連結,以便顯示所有相關Google Cloud 基礎架構的封包遺失和延遲。
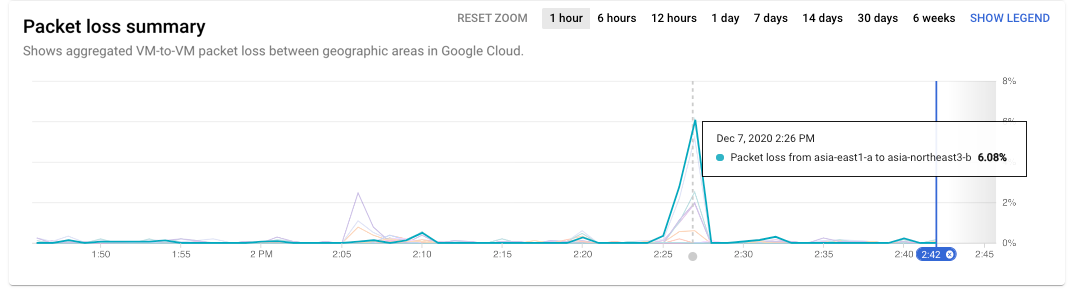
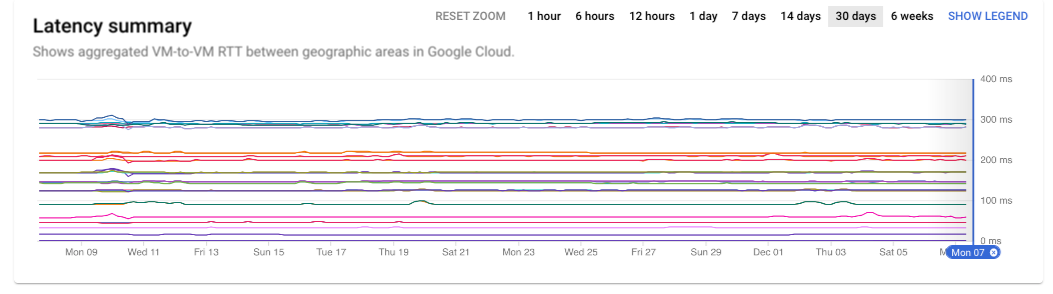
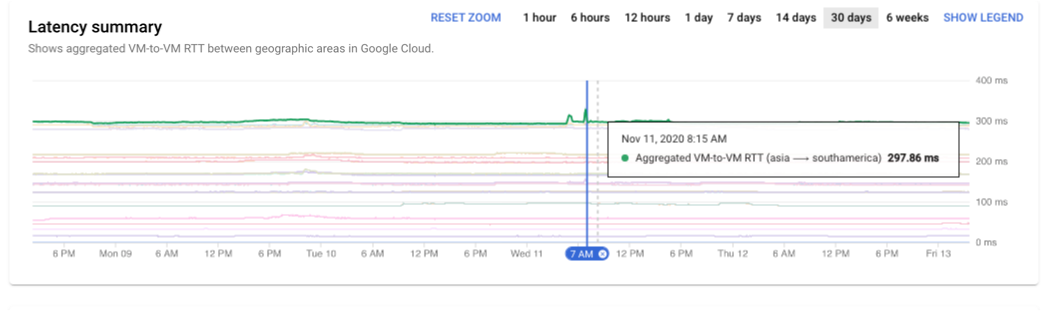
在以下範例中,您可以看到 Google Cloud 流量最近發生封包遺失。將游標停留在圖表上,您會發現損失高峰期發生在下午 2 點 26 分,介於 asia-east1-a 和 asia-northeast3-b 之間。如果專案的問題與這個時間和位置相符,由於問題會影響所有 Google Cloud,因此可節省疑難排解時間。
[[["容易理解","easyToUnderstand","thumb-up"],["確實解決了我的問題","solvedMyProblem","thumb-up"],["其他","otherUp","thumb-up"]],[["難以理解","hardToUnderstand","thumb-down"],["資訊或程式碼範例有誤","incorrectInformationOrSampleCode","thumb-down"],["缺少我需要的資訊/範例","missingTheInformationSamplesINeed","thumb-down"],["翻譯問題","translationIssue","thumb-down"],["其他","otherDown","thumb-down"]],["上次更新時間:2025-09-04 (世界標準時間)。"],[],[],null,["# Performance diagnostics use cases\n\nThis page describes how Performance Dashboard can help you diagnose\nperformance issues in a Google Cloud project. The following sections\ndescribe commonly observed performance issues and their root causes.\n\nPerformance diagnostics: Is it the project or Google Cloud?\n-----------------------------------------------------------\n\nYou observe latency or packet loss values in your project, and you want to\nvalidate and compare against reference data outside of your projects. The\n**Performance for all of Google Cloud** view in Performance Dashboard\nlets you correlate per-project network\nperformance, such as VM-to-VM packet loss or latency, to performance over all of\nGoogle Cloud, to show packet loss and latency across all relevant\nGoogle Cloud infrastructure.\n\nIn the following example, you can see that Google Cloud traffic experienced\npacket loss recently. By holding the pointer over the chart, you can see that\nthe peak loss occurred between `asia-east1-a` and `asia-northeast3-b` at 2:26 PM.\nIf your project's issues correspond to this time and location, you save\ntroubleshooting time because the issues impact all of Google Cloud.\n[](/static/network-intelligence-center/docs/performance-dashboard/images/gcpd-pl-summary.png) Packet loss summary (click to enlarge)\n\nHolding the pointer over a time series shows data for the source and destination.\nTo show the chart legend, you click the **Show Legend** button on the time series\nchart. Holding the pointer over a zone pair in the legend highlights the time series\ndata for that pair.\n[](/static/network-intelligence-center/docs/performance-dashboard/images/gcpd-pl-ts-highlights.png) Packet loss time series highlights (click to enlarge)\n\nTo see all the areas where the packet loss issue occurred at 2:26 PM, you update the\nheatmap by moving the time selector on the time series chart.\n\n### Scenario: Validate if the project performance differs from Google Cloud\n\nUsing the per-project Performance Dashboard in the Network Intelligence Center, you\nidentified a region or zone pair with high latency or packet loss.\nYou want to see if they differ significantly from the Google Cloud average.\n\nHold the pointer over the region or zone pair that you want to validate. You can see\nthe value of latency or packet loss for your project and the value of the\nGoogle Cloud average for the same pair underneath. If they are similar,\nit indicates that the performance observed in your projects is similar to the\naverage across all projects within the same region or zone pair.\n\n### Scenario: Investigate current high latency or packet loss issue\n\nYou identified the region or zone pairs with high packet loss or latency,\nand you want to compare those with the overall Google Cloud values. You can\nrefine the Google Cloud performance view of Performance Dashboard by\nusing the source and destination region selection capability. There are two ways\nin which you can refine the Google Cloud performance view:\n\n- To view data for specific regions, you select the regions from the **Locations**\n menu. You can select up to five regions.\n\n- To view zone-to-zone data for a region pair, you click the square in the\n regional heatmap that corresponds to the region pair.\n\n [](/static/network-intelligence-center/docs/performance-dashboard/images/gpd-lat-loca-heatmap-blue.png) Regional heatmap (click to enlarge)\n\nWith both selection methods, the time series data and heatmap for the\nselected pairs are displayed. In the following example, you selected\n`asia-east1` and `europe-north1`.\n[](/static/network-intelligence-center/docs/performance-dashboard/images/gcpd-lat-ts-hm-blue.png) Timeseries and heatmap for selected pairs (click to enlarge)\n\n### Scenario: Investigate historic high latency or packet loss issue\n\nIf you want to investigate a specific time slot in which you observed abnormal\nlatency or packet loss values, you can use the time zoom in the time series. In\nthis example, you have selected 30 days.\n[](/static/network-intelligence-center/docs/performance-dashboard/images/gcpd-lat-summary.png) Latency summary (click to enlarge)\n\nYou can further refine the time selection by clicking and dragging on the time\nseries chart to select the days or hours related to your investigation.\n\nThe chart displays the data for Monday the 9th through Friday the 13th. You can\npinpoint a modest spike in latency on November 11 at 8:15 AM.\n[](/static/network-intelligence-center/docs/performance-dashboard/images/gcpd-lat-summary-zoom.png) Latency summary time zoom (click to enlarge)\n\nWhat's next\n-----------\n\n- [Project performance use cases](/network-intelligence-center/docs/performance-dashboard/concepts/use-cases-project)\n- [Planning for performance across geographies use cases](/network-intelligence-center/docs/performance-dashboard/concepts/use-cases-performance-across-geographies)\n- [Planning for performance use cases](/network-intelligence-center/docs/performance-dashboard/concepts/use-cases-workload-optimization)\n- [View project-specific packet loss dashboard](/network-intelligence-center/docs/performance-dashboard/how-to/view-project-specific-packet-loss)\n- [Troubleshoot Performance Dashboard](/network-intelligence-center/docs/performance-dashboard/support/troubleshooting)"]]